Markets rise despite subdued economic recovery
Financial markets recorded steady gains during the period under review,1 after the acute stress in March. The rebound in valuations was underpinned by supportive monetary and fiscal policy, particularly in some advanced economies (AEs), as well as evidence that the plunge in economic activity had been arrested. Yet the economic upturn remained incomplete and fragile. Consensus forecasts indicated that a return to pre-crisis trend growth rates was unlikely. This raised questions about whether risky asset prices had disconnected from the underlying economic outlook.
There were clear signs of historically high valuations in equity and corporate credit markets. US and Chinese stock indices extended their April and May gains, surpassing in August the lofty early-year levels. In other equity markets, the upswing was more moderate. And the gains were restricted to a limited number of companies. Amid some recent volatility, technology and health care stocks globally outperformed while energy and financials lagged, possibly reflecting structural changes induced by the pandemic. In credit markets, spreads narrowed to long-term historical levels, despite evidence of deteriorating credit quality. Heavy issuance across the rating spectrum, especially in investment grade, though to a considerable extent precautionary in nature, added to the heavily indebted capital structure of many firms.
Central banks largely maintained their policy stance during the period under review. In late August, the Federal Reserve unveiled its new monetary policy framework, which market participants interpreted as heralding a more prolonged period of accommodation. Over the review period, interest rate levels and volatility compressed further, providing material support to risky asset prices. As inflation break-evens returned to pre-pandemic levels, real yields in AEs delved further into negative territory. In emerging market economies (EMEs), government bond yields retraced the March spike, despite a limited recovery in portfolio inflows.
In this context, a confluence of factors contributed to a depreciation of the US dollar, particularly vis-à-vis AE currencies. Notably, the rapid fall in US interest rates eroded the yield advantage of dollar assets. The dollar depreciated most sharply against the euro as market sentiment towards the common currency was buoyed by a more cohesive policymaking environment in the euro area. Overall, EME currencies remained range-bound, on the back of global investors' lukewarm appetite for local currency assets.
Key takeaways
- Risky assets rose further despite the subdued economic outlook, raising concerns about a disconnection from economic prospects.
- Real yields in advanced economies fell deeper into negative territory as measures of inflation compensation returned to pre-pandemic levels.
- The dollar declined versus its advanced economy peers but was mixed against emerging market economy (EME) currencies amid lukewarm appetite for EME bonds and equities.
Statistical data: data behind all graphs
Stretched valuations in the aftermath of the Covid-19 outbreak
Financial markets recorded further gains during the review period, despite the challenging macroeconomic outlook. A divergence emerged between, on the one hand, elevated stock valuations and tightening credit spreads and, on the other, the reality of an economic recovery that looked incomplete and fragile. While investors did differentiate across sectors, rewarding technology stocks in particular, they seemed to be comforted overall by a stream of economic indicators that turned out better than feared. An accommodating monetary policy stance and news about new fiscal programmes in some jurisdictions also provided critical support for asset prices.
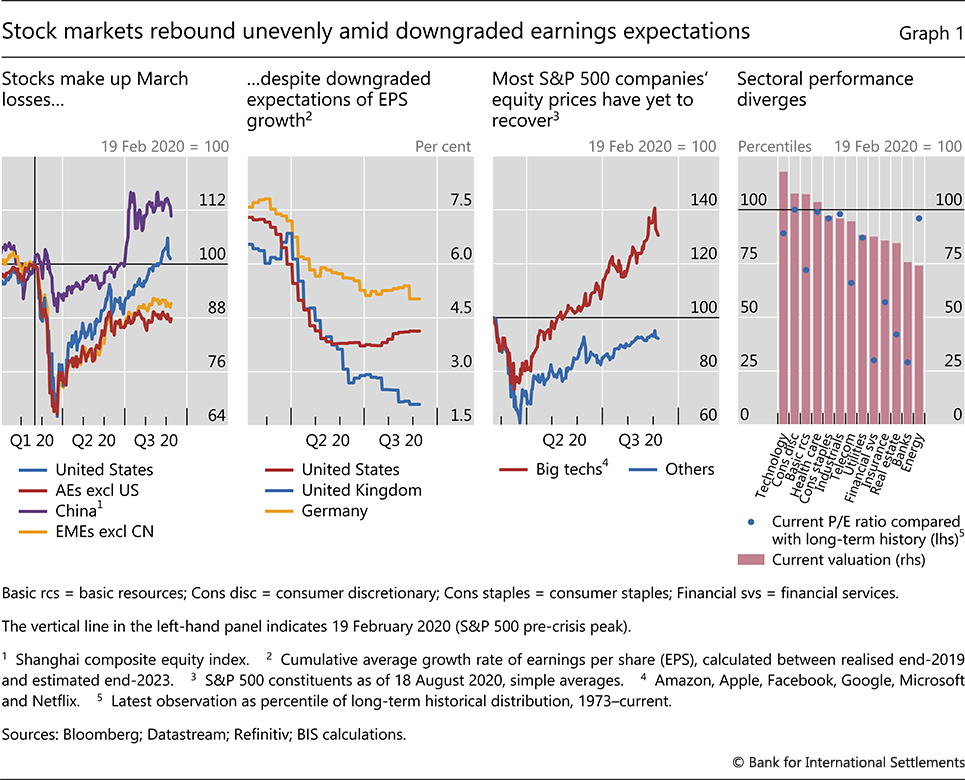
Stock markets overall saw a notable rise between July and early September. After recording strong returns in April and May, equity prices moved largely sideways in June but resumed their ascent thereafter. The gains were largest in the United States and China, whose main equity benchmarks by August had surpassed their pre-pandemic valuations, which had already carried signs of overheating (Graph 1, first panel). While other AE and EME stock indices recouped much of their March losses, they still remained some 10% below previous highs. A sell-off at the end of review period cut some of the early gains, particularly in the technology sector.
The evolution of aggregate valuations appeared to be somewhat at odds with the general economic outlook. The stream of macroeconomic news during the period was only moderately positive. Indices of economic surprises did turn increasingly positive, in particular as regards labour markets, manufacturing and investor sentiment. That said, despite some upward revisions, growth forecasts for the global economy remained generally tepid, anticipating that recent GDP losses would not be recouped before the end of 2021. Furthermore, corporate earnings expectations were revised downwards, sometimes significantly, in some of the largest AE markets (Graph 1, second panel).
That said, the bounceback rally in equity markets was highly heterogeneous at the sectoral, and even company, level. In the United States, for instance, less than half of the stocks included in the S&P 500 index had surpassed their February prices before the sell-off started. By that time, the top six technology firms had exceeded their mid-February prices by about 40%. Meanwhile, the rest of the index did not catch up, despite its components increasing by more than 50% from their deep trough (Graph 1, third panel).
Investors' exuberant sentiment about specific stocks in the technology sector is likely to have fed on itself. Bets that the rally was set to continue led to heavy long positioning in call options. In such transactions, dealers typically seek to hedge their positions by purchasing the underlying stock, which boosts its price and validates the initial bets. As such self-fulfilling mechanisms also work in the downward direction, they tend to be destabilising.
Globally, the distribution of valuation changes across sectors was consistent with the uneven implications of Covid-19. Gains were stronger in sectors that would benefit more from the structural economic changes that the pandemic may induce - such as technology and health care. Highly cyclical sectors - such as basic materials and consumer discretionary - also outperformed, hinting at investors' belief in a swift recovery of the global economy (Graph 1, fourth panel, bars). In contrast, the stocks of financial, real estate and energy corporates lagged behind, as investors factored in the challenges ahead. For the banking sector in particular, the questions relate to chronically low profitability and the accumulation of assets of uncertain credit quality (Box A). In the case of real estate and oil, the concerns stem from the vast uncertainty about the shape of future demand. That said, confirming overall frothiness despite sectoral differentiation, most sector valuations remained stretched, sitting near the top of the historical distribution of price/earnings ratios (fourth panel, dots).
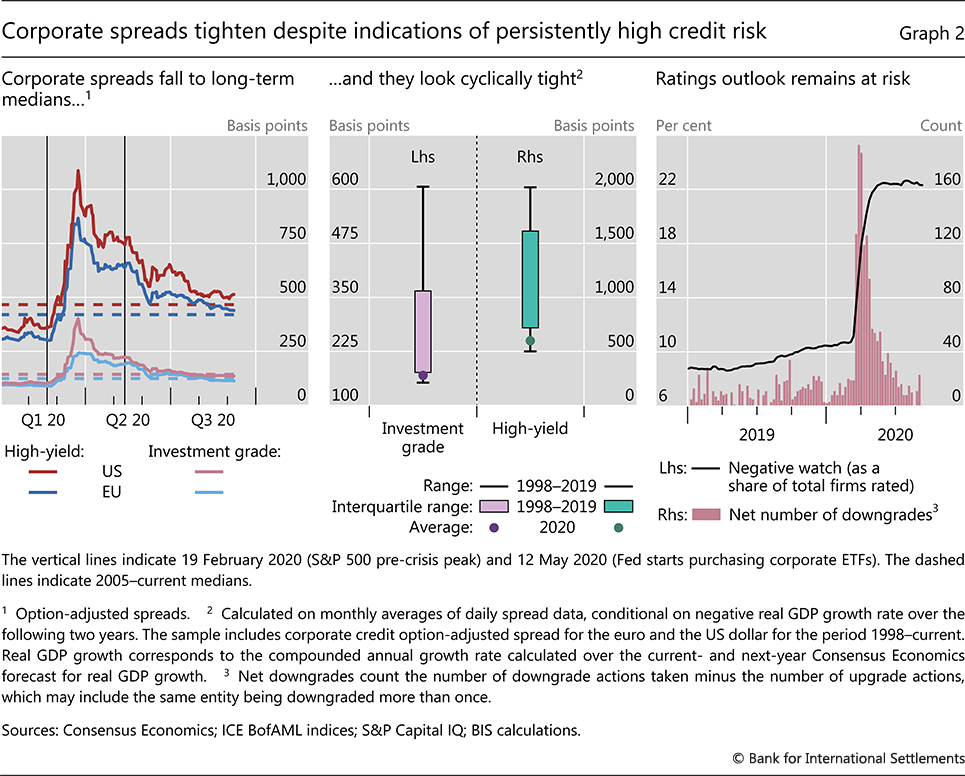
In this risk-on environment, corporate credit spreads tightened further, also suggesting some disconnection from underlying risks. During the review period, all spreads saw material drops, particularly for US high-yield credit (Graph 2, left-hand panel). Overall, the spreads on both investment grade (IG) and high-yield (HY) credit approached their respective long-term levels, on the back of direct and indirect policy support.
Similarly to aggregate stock market patterns, credit spreads looked remarkably tight when contrasted with subdued expectations for the real economy. Lower global activity means lower revenues and cash flows for firms to service their debts. Yet credit spreads in recent months have compressed to the low end of the historical distribution once the weak expected economic performance is taken into account (Graph 2, centre panel). This has taken place despite a persistent deterioration in issuers' credit quality: the share of firms on negative watch has not declined following the large spike in actual downgrades during Q2 (right-hand panel).
As indicated by credit spreads, credit markets seem to expect that corporate bankruptcy rates will continue to be low, even though this would be at odds with historical experience. Concretely, if historical relationships continued to hold, the 2020 GDP growth forecasts - ranging between -4.5 and -11% - would be consistent with bankruptcies increasing by 20-40% in 2020.2 Yet, on the back of public support measures, most economies have witnessed a lower number of bankruptcies since the beginning of the year than over the equivalent period in the previous five years - this despite the pre-pandemic increase in the number of persistently unprofitable firms, so-called "zombies", which are particularly vulnerable to economic downturns.3
Box A
Banks through Covid-19
Bryan Hardy
The Covid-19 crisis raised significant challenges for both banks and prudential authorities. There was high uncertainty about how economic activity would be affected and whether banks could weather the potential losses as businesses closed, either temporarily or permanently. Banks have so far proved to be a source of stability, remaining resilient while supporting the economy. Nevertheless, equity valuations remain depressed, credit rating outlooks are largely negative, and pockets of weakness and risk exist.
Bank stock prices plummeted along with those of other industries as the crisis unfolded. Thereafter, they largely moved sideways, remaining well below global stock prices and below their own pre-crisis levels (Graph A, first panel). Similarly, price-to-book ratios fell, stabilising around 1 on average for banks outside Europe. Less profitable banks in Europe and Japan had ratios below 1 pre-crisis and saw them deteriorate further thereafter.
Why have equity investors responded so negatively to banks? The sector has seen losses accumulate, with loan loss provisions for advanced economy banks increasing by $45 billion (182%) between Q4 2019 and Q1 2020 (Graph A, second panel). Consequently, their profits in Q1 2020 fell considerably, adding to the woes of many that were already suffering from low profitability. These trends are likely to have continued in Q2, in part owing to strong monetary policy accommodation that compressed net interest margins. Restrictions on capital payouts have further dampened investors' appetite for bank equity. Global banks have seen a recent spike in so-called level 3 assets, whose opaqueness is likely to be weighing down on valuations.
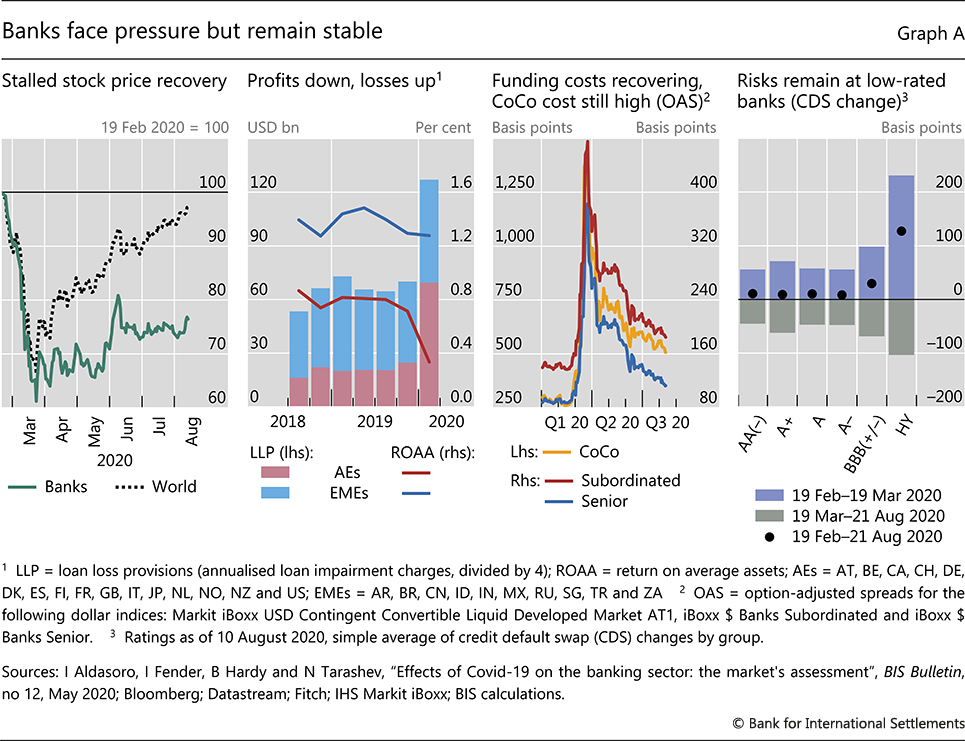
Despite these stresses, banks have remained resilient so far. Basel regulations implemented since the 2008 crisis obliged banks to increase their capital considerably, with the average Common Equity Tier 1 ratio rising from 10% in Q4 2010 to 14% in Q4 2019. Banks thus entered the current crisis well positioned to absorb losses. Because of this strength, authorities turned to them as part of the solution to the economic downturn rather than as part of the problem. They reduced regulatory buffer requirements in some jurisdictions and, more generally, encouraged the use of liquidity and capital buffers to support the flow of credit. Efforts to preserve bank capital during the pandemic, eg capital distribution restrictions, while not welcomed by equity investors, were valued by debt investors for the safety provided. On the back of robust monetary policy support and a generally positive sentiment in debt markets, bank funding costs have largely recovered since late March, in contrast to the flagging stock price (Graph A, third panel). Spreads for Additional Tier 1 instruments, such as contingent convertible bonds (CoCos) used mainly by European banks, were an exception. They are still nearly double their pre-Covid levels, reflecting concerns over possible coupon cancellations from payout restrictions.
That said, vulnerabilities remain. Credit rating outlooks for banks are still generally negative. Credit default swap (CDS) spreads for BBB-rated and high-yield banks in particular have remained elevated, on average 30 and 127 basis points above their pre-Covid positions, respectively (Graph A, fourth panel). The concern in CDS markets over lower-rated banks underscores the value of a cautious approach to bank capital amid uncertainty about the evolution of the pandemic and the underlying quality of banks' assets. The full extent of economic damage from the pandemic will play out in the longer term, and losses may take time to fully materialise. These losses could be larger for more opaque assets, whose true value and risk are more uncertain.
The views expressed are those of the author and do not necessarily reflect the views of the Bank for International Settlements. See I Aldasoro, I Fender, B Hardy and N Tarashev, "Effects of Covid-19 on the banking sector: the market's assessment", BIS Bulletin, no 12, May 2020. This is despite regulators encouraging banks to take a longer view when accounting for losses from the immediate stress. Level 3 assets are banks' most illiquid holdings, resulting in little market/external data to guide valuations and leaving banks to value them based on their own internal experience and methodology. See D Griffin and Y Onaran, "Big banks sit on $250 billion of murkiest trades after Covid", Bloomberg, 19 August 2020. See C Borio, "The prudential response to the Covid-19 crisis", speech on the occasion of the BIS Annual General Meeting, 30 June 2020.
The narrowing of spreads occurred in the face of very strong supply. Corporate issuance through August in all categories outpaced the amounts of the corresponding period during 2019: IG corporates placed $1.7 trillion of new debt through mid-August (versus $1.1 trillion in 2019), while HY corporates issued $322 billion (versus $200 billion). In fact, the aggregate amounts over those eight months exceeded the total amounts for 2019 as a whole. As net leverage ratios4 continued to climb to all-time peaks, corporates' capital structure became increasingly reliant on debt and low interest rates.5
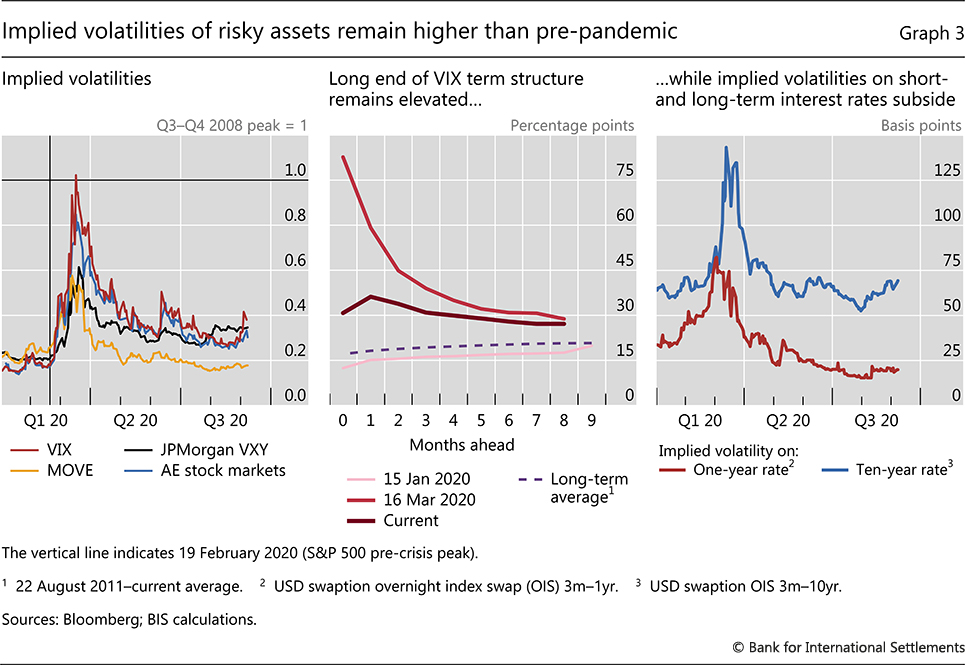
At the same time, option markets pointed to some lingering uncertainties among investors. The implied volatilities of several risky assets, including equities and currencies, remained materially above levels seen early in the year (Graph 3, left-hand panel). And while the call-option buying spree could explain some of these developments, it is remarkable that the long end of the VIX term structure was roughly twice the January marks (centre panel), which were close to the historical average.
In contrast, the implied volatilities of interest rates dropped below pre-pandemic levels. For most of the review period, the MOVE index, which captures the implied volatilities of US Treasury securities across the maturity spectrum, fluctuated around its all-time lows (Graph 3, left-hand panel, yellow line). Volatility compression was even stronger at the shorter end: during the review period, the price of insuring short-term interest rate risk had halved from January, oscillating near its historical minimum. Meanwhile, the price of insuring long-term interest rate risk was roughly back at January marks (Graph 3, right-hand panel).6 The compression of interest rate levels and volatility helped prop up risk-taking by curtailing funding risk, contributing also to the upswing in risky asset prices (Box B). Subdued volatility in fixed income markets reflected, in part, the impact of central bank actions and communication.
Lower bond yields on supportive policies
The stance of global monetary policy remained supportive as major central banks proceeded along the path set earlier in the year. After extraordinarily large purchases of US Treasury securities in March and April to smooth market functioning, the Federal Reserve could afford to scale down its monthly buying from about $700 billion to around $80 billion as market stress eased. In parallel, the ECB actually increased its asset purchases in the sovereign segment, tilting towards non-core securities. As a result, the balance sheet of the Fed and the ECB ballooned to about 30% and 50% of GDP, respectively. Separately, the central banks of some large EMEs cut policy rates, eg Brazil, Indonesia, Malaysia, Mexico and South Africa. Those of Chile and Indonesia announced asset purchase programmes to support market functioning.
Furthermore in late August, Chairman Powell unveiled changes to the Federal Reserve's monetary policy framework. These included basing policy decisions on the assessment of employment "shortfalls", instead of deviations from target, and adopting a "flexible form of average inflation targeting". The changes are intended to help the Fed achieve its dual mandate, in a context where the long-run growth rate and the general level of interest rates have declined, and a strong labour market has not triggered a significant rise in inflation. Given that the announcement was largely anticipated, it generated a limited market reaction: long-term Treasury yields dropped initially but rebounded quickly, ending slightly higher on the day.
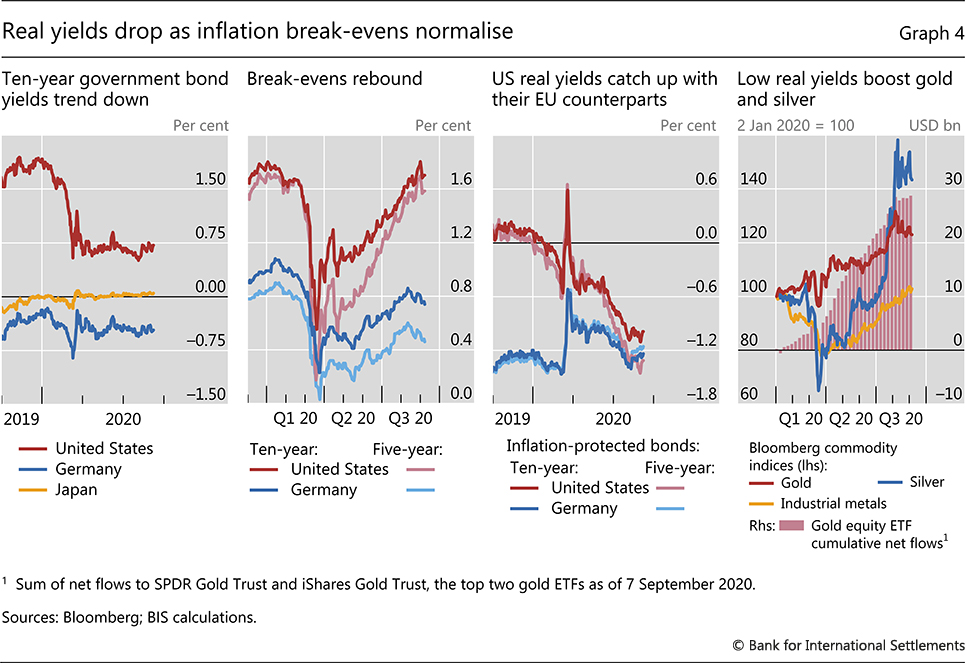
Benefiting from the strong policy support, 10-year government bond yields in the United States and Germany trended down for most of the review period (Graph 4, first panel). In Japan, the bond rate remained anchored by yield curve control. Over the year, the decline in long-term US yields was more pronounced than elsewhere, leading to a substantial compression in the differentials vis-à-vis other global core safe assets. Despite the relative convergence at the long end, the US term structure remained steeper, possibly hinting at investors' different expectations regarding the medium-term growth outlook for the three economies.
Inflation break-evens in major AEs rebounded from their March lows. In the United States, inflation compensation climbed back to pre-pandemic levels across the maturity spectrum (Graph 4, second panel). The increase was sharper at the short end, which caught up with the longer tenors. The rebound in US break-evens was more forceful than in other AEs, in part probably reflecting investors' expectations of a larger fiscal stimulus in the United States. In addition to the fiscal package approved in March, there have been discussions since mid-year about new fiscal measures, which would reinforce the expansionary fiscal stance.
Box B
The short and long end of equity prices during the pandemic
Valuations and the shift in interest rates
Stock markets price in long-term information, stretching far beyond the short-term cyclical fluctuation in the growth outlook. The recent rally in equity prices has attracted attention, among other reasons, for its possible disconnect from the underlying prospects of economies still reeling from the pandemic shock. In this box, we use dividend derivatives to decompose the US and European equity benchmarks into short- and long-term components, corresponding to the value of the short- and long-term dividend stream. Our main goal is to explore whether this dimension, together with depressed interest rates, sheds some light on the apparent disconnection. In line with the subdued short-term economic outlook mentioned above, we find that the short-term components of both indices have seen a limited recovery since March. The benchmarks' strong recent performance is thus predicated on steady gains in their long-term components. Moreover, these gains are related, to a large extent, to the drop in the term structure of interest rates that followed the policy response of central banks to the pandemic shock.
A stock's price can be seen as the sum of the present value of the stream of all expected future dividend payments. Our analysis draws on a variation of such a present value model. The discount rate for each expected future dividend comprises two parts. First, a risk-free rate reflecting the "value of time" and usually taken from the government bond market - we use the term structure of zero coupon yields for the United States and the euro area. Second a risk premium, capturing the compensation that investors require for bearing the uncertainty surrounding future dividends.
We decompose the pricing of the S&P 500 and the EURO STOXX 50 into a short- and a long-term component. The threshold separating them marks the boundary of investors' cyclical considerations about dividend growth. Before that point in time, investors can form relatively detailed expectations about dividend growth, based on their expectations for the broader economy. Beyond that threshold, we assume that they take a long-term view of dividend growth - a constant rate. For practical reasons, we choose that boundary to be five years, which coincides with the availability of reasonably liquid dividend futures contracts for both indices. That is, contracts on the actual annual dividend payout of the firms included in the respective index. Those dividend futures prices provide a direct market assessment of the present value of those dividend coupons.
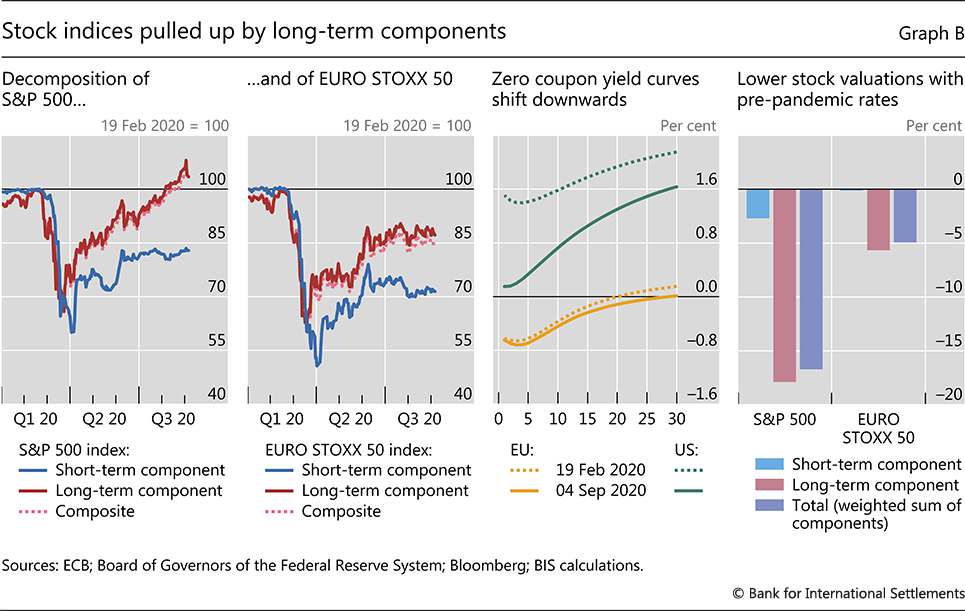
Thus, we construct the short-term component of both the S&P 500 and EURO STOXX 50 by adding up the futures prices of the respective annual dividends for 2020-24. The long-term component is obtained as a residual, as the difference between the full index price and the short-term component. After a parallel downward shift in late February that spanned most of March, the short-term components continued plunging into early April and subsequently displayed a tepid rebound (Graph B, first two panels). This path is consistent with survey data suggesting a subdued recovery of the real economy. In contrast, the long-term components reached a turning point in mid-March, followed by a relatively aggressive rally as the policy response gathered momentum.
The stock market rebound has been accompanied by an overall downward shift of yield curves, especially in the United States. Since the pandemic, the front end of the US zero coupon yield curve has declined by around 140 basis points (Graph B, third panel), while its euro area counterpart has barely moved. Long-term interest rates, as represented by 10-year tenor securities, have fallen by about 80 and 10 basis points in the United States and the euro area, respectively. In addition, long-run steady state interest rates have dropped by about 20 basis points in both.
In this context, a natural question concerns the relative contribution of lower interest rates to the rebound in equity prices. Using our simple model, we address that question empirically by recalculating the September prices of short- and long-term components after replacing the term structure of interest rates prevailing in [early September] with the term structure prevailing in February, before the outbreak of Covid. In addition, we keep unchanged the dividend growth rate and risk sentiment implicit in August prices. Notice that this ceteris paribus exercise does not imply any correlation between stock and bond returns, whose implications are at the centre of a lively debate.
The results suggest that the drop in interest rates has provided a significant boost to stock prices. Most gains were concentrated in the long-term components, which are naturally more sensitive to discount rate changes than their short-term counterparts. All else equal, in the absence of the fall in interest rates, the long-term components of US and European stock prices would have been roughly 18% and 6% lower than they were on 4 September, respectively (Graph B, fourth panel). The short-term components would have been only slightly lower. The estimated total impact - equal to the weighted average of the short- and long-term components - amounts to close to a half and a fifth of the rebound in the US and euro area equity prices, respectively.
See eg I Dew-Becker and S Giglio, "Asset pricing in the frequency domain: theory and empirics," The Review of Financial Studies, vol 29, issue 8, August 2016, pp 2029-68 Buybacks would affect the value of the stock only if they result in an increase in the dividend payout per share for the remaining shares. The zero coupon yield curves for the United States and the euro area are obtained from the Federal Reserve Board and the ECB, respectively. Both fit a Nelson-Siegel-Svensson model to observed interest rates. As of the time of writing, the futures contracts for the annual dividends for the period 2020-24 (five annual contracts) had relatively high open interest, suggesting adequate liquidity. See N Gormsen and R Koijen, "Coronavirus: impact on stock prices and growth expectations", University of Chicago, Becker Friedman Institute for Economics Working Paper, March 2020, use dividend futures data to examine investors' expectations about dividend growth. See eg R Clarida, "Monetary policy, price stability, and equilibrium bond yields: success and consequences," remarks at the High-Level Conference on Global Risk, Uncertainty and Volatility, Zurich, November 2019.
With monetary policy keeping a lid on nominal yields, real yields dropped sharply as break-evens bounced back. In fact, yields on inflation-protected securities (so- called "real yields") were pushed deep into negative territory, even for long-term securities. Once again, the shift was sharper for US securities. Long-term US real yields sank to all-time troughs in early September (Graph 4, third panel). In fact, short-term US real yields fell below their German equivalents for the first time since 2015. Record low US real yields coincided with the steep appreciation of precious metals, particularly gold and silver, as investors appeared to shift away from negative-yielding assets. Large inflows into gold ETFs supported the rally (fourth panel).
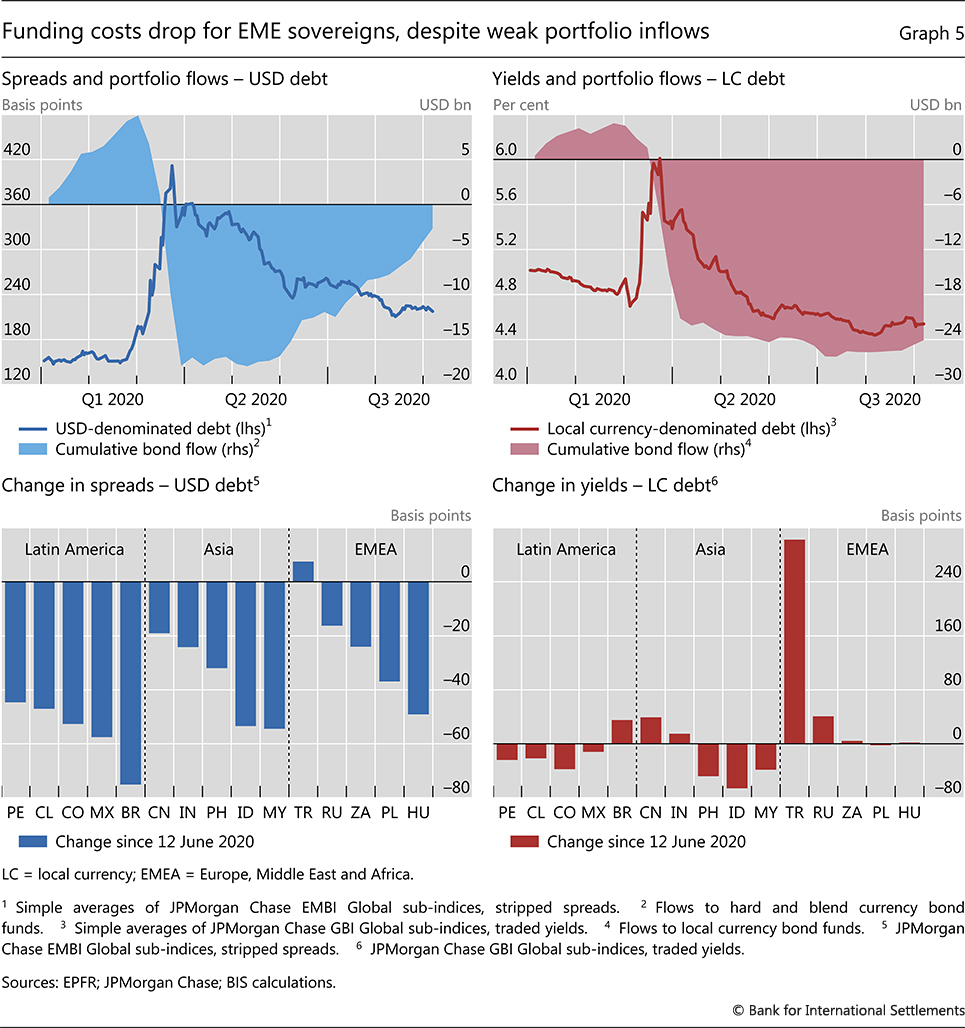
EME sovereign yields continued trending downwards, aided by their own supportive monetary policy. Monetary policy easing has been a significant departure from previous events of stress, when EMEs were often forced to ramp up rates to avoid currency meltdowns. The fall in AE yields contributed to creating monetary policy space for these countries. Overall, spreads on dollar-denominated debt retrenched towards their long-term averages, even as they remained above the unusually compressed pre-pandemic levels (Graph 5, first panel, line).7 Moreover, yields on local currency-denominated bonds hit an all-time low (second panel, line). Turkey was a notable exception to these patterns, as the country came under severe currency pressure after mid-June (bottom panels).
However, the fall in sovereign funding costs was not matched by sizeable portfolio inflows. In the US dollar-denominated segment, the moderate net inflows during the review period partially compensated for the outflows in March (Graph 5. first panel, shaded area). In the local currency segment, in turn, essentially no net inflows took place (second panel, bars).
Headwinds build up against the US dollar
The US dollar depreciated sharply against AE currencies during the period under review. A confluence of factors, including financial and real, appear to have contributed to that outcome. In contrast, EME currencies remained range-bound on average, with a large degree of variation across countries as idiosyncratic factors weighed in.
The erosion of the dollar yield advantage is likely to have put pressure on the currency. On the back of the monetary policy response that followed the pandemic, the nominal "carry" of the dollar vis-à-vis other AE currencies dropped to multi-year lows. This was notably the case with the carry vis-à-vis the euro and the Japanese yen.
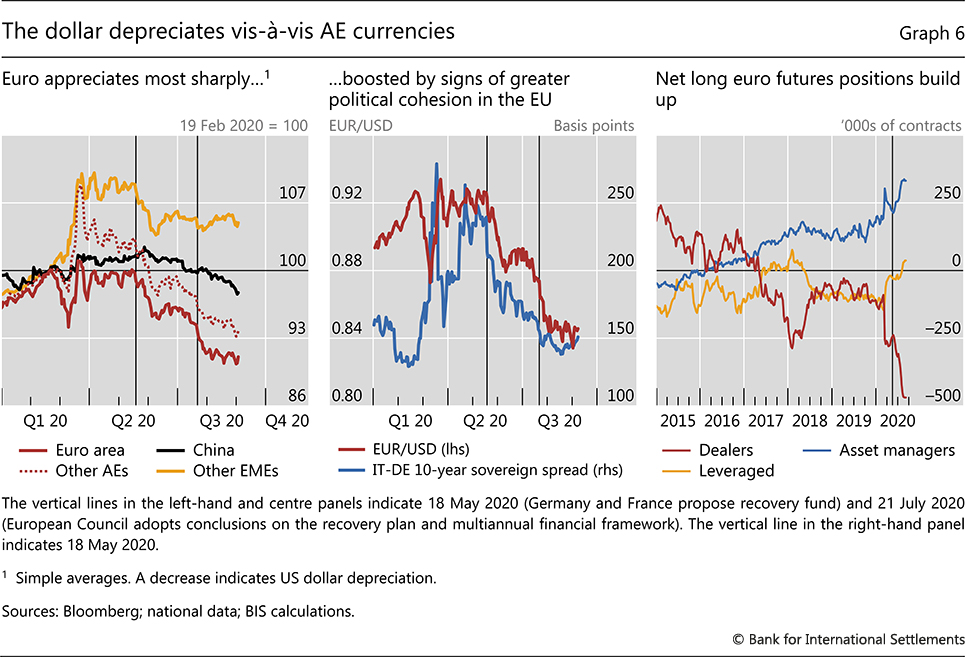
The dollar depreciated most vis-à-vis the euro, and somewhat less with respect to the other AE currencies (Graph 6, left-hand panel). The recent strengthening of the euro appears to reflect to a considerable extent investors' positive response to signs of greater political cohesion in the euro area, which improved sentiment towards the bloc's currency. The most recent turning point in euro/dollar exchange rate can be traced to mid-May, when Germany and France unveiled their proposal for a European Recovery Fund (ERF). Subsequently, the evolution of the euro/dollar exchange rate broadly tracked the compression of the Italian 10-year sovereign spread with German bunds (centre panel). Euro appreciation gathered pace in late July, when the European Council approved the ERF, broadly in line with the initial proposal.8
Positioning in the futures markets was not supportive of the dollar. Asset managers had started increasingly taking net long euro positions in December. These positions surged in the second half of May, after the French-German ERF proposal (Graph 6, right-hand panel, blue line). Echoing the behaviour of asset managers, leveraged funds active in futures shifted increasingly towards net long euro positions (yellow line). The net short euro position of currency dealers, who take the opposite side of all other investors, is at the most extreme level since the mid-2000s (red line). Generally speaking, this in itself can give rise to headwinds for the dollar, as dealers need to take a long euro position in the spot market to hedge their futures position.9
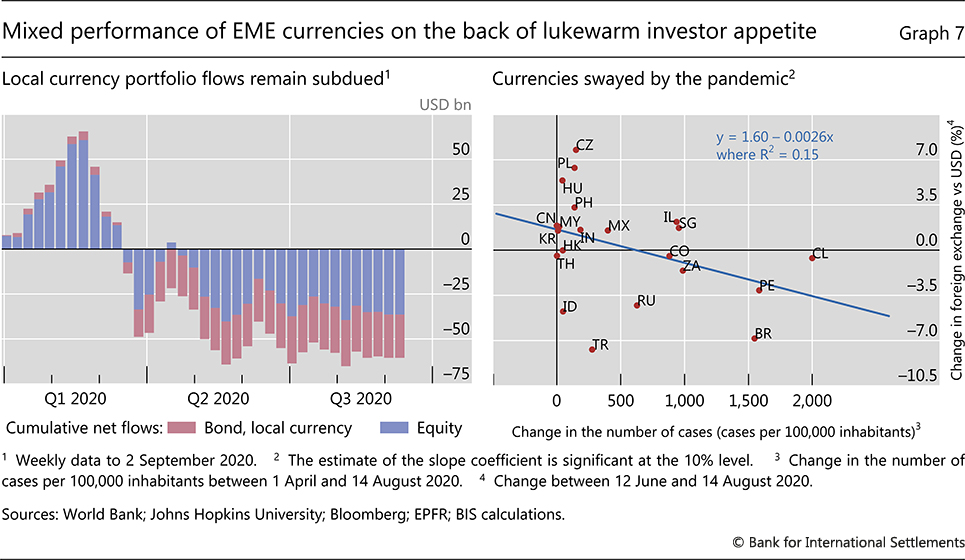
Despite its weakness against AE currencies, the dollar generally traded sideways against EME currencies. This seemingly reflected the lukewarm appetite for EME assets on the part of investors, mostly international. Portfolio flows to local currency-denominated assets, both equity and fixed income, did not see a bounceback from the sharp March outflows (Graph 7, left-hand panel). Several factors contributed to this unenthusiastic sentiment. On the financial side, the attractiveness of the EME carry trade has significantly diminished as interest rates have declined since the beginning of the pandemic. On the real economy side, currencies may reflect investors' concerns over a still deteriorating health situation in the short run, and the viability of some of these countries' growth models in the longer run. Notably, a post-pandemic backlash against globalisation would damage the prospects of key EME sectors that are part of long global value chains (GVCs). Moreover, traditional manufacturing industries may face persistent headwinds as a result of possible structural changes in the post-pandemic environment.
At the country level, the performance of EME currencies was mixed. That reflects, in part, the evolution of the pandemic (Graph 7, right-hand panel). Countries in Latin America tended to experience sharper depreciations as cases mounted with the arrival of the Southern Hemisphere's winter. Asian EMEs, on the other hand, actually saw modest appreciations, as the pandemic was better contained and currencies are likely to have benefited from China's recovery post-outbreak. In fact, the renminbi steadily appreciated during the review period, irrespective of occasional flare-ups of trade tensions. Eastern European currencies also strengthened on the back of a lower incidence of Covid-19 infections and the euro's pull. In some cases, other idiosyncratic factors appeared to have a larger imprint. The Turkish lira tumbled in August after two months of stability. The drop reflected concerns about depleted currency reserves amid a deteriorating growth outlook and runaway inflation. The Russian rouble slid back after a strong rebound in sync with oil prices in Q2 as geopolitical challenges intensified.
1 12 June to 7 September 2020.
2 See R Banerjee, G Cornelli and E Zakrajšek, "The outlook for corporate insolvencies", mimeo, 2020.
3 For analyses of the factors behind zombie firms' existence and rise, see D Andrews and F Petroulakis, "Breaking the shackles: zombie firms, weak banks and depressed restructuring in Europe", OECD Economics Department Working Papers, no 1433, November 2017; R Banerjee and B Hofmann, "The rise of zombie firms: causes and consequences", BIS Quarterly Review, September 2018, pp 67-78; and R Banerjee and B Hofmann, "Corporate zombies: anatomy and life cycle", BIS Working Papers, no 882, September 2020.
4 Net leverage is defined as total debt minus cash holdings, as a share of 12-month trailing EBITDA.
5 See S Aramonte, "Mind the buybacks, beware of the leverage", BIS Quarterly Review, September 2020.
6 The price of insuring short-term (long-term) interest rate risk is reflected in the implied volatility of a three-month option to enter a one-year (10-year) interest rate swap, ie a one-year (10-year) swaption.
7 See "A rude awakening for investors", BIS Quarterly Review, March 2020.
8 The agreement authorised the European Commission to borrow in the capital markets on the European Union's behalf. The ERF will provide grants and loans to member states to fund the recovery from the pandemic, and seems to have been taken by investors as a meaningful first step towards a common EU fiscal policy
9 Futures markets represent only a small fraction of the FX market, but there is readily available data about investors' positioning. Moreover, those data are generally considered a useful barometer of market sentiment.