A rude awakening for investors
Surging market sentiment faltered in mid-January with the worsening news on the new coronavirus (Covid-19) outbreak in China. The upswing in investor risk appetite sparked last October by easing trade tensions had gathered further momentum during the first half of the three-month period under review.1 Starting in mid-January, however, concerns over the economic impact of the new epidemic in China dented investor confidence. The intensity of the ensuing risk-off episode, which had an uneven impact across asset classes and regions, fluctuated in response to news detailing the spread of the coronavirus across the globe. As of late February, jittery markets and abundant signs of investor caution indicated that the risk-off phase was not yet over.
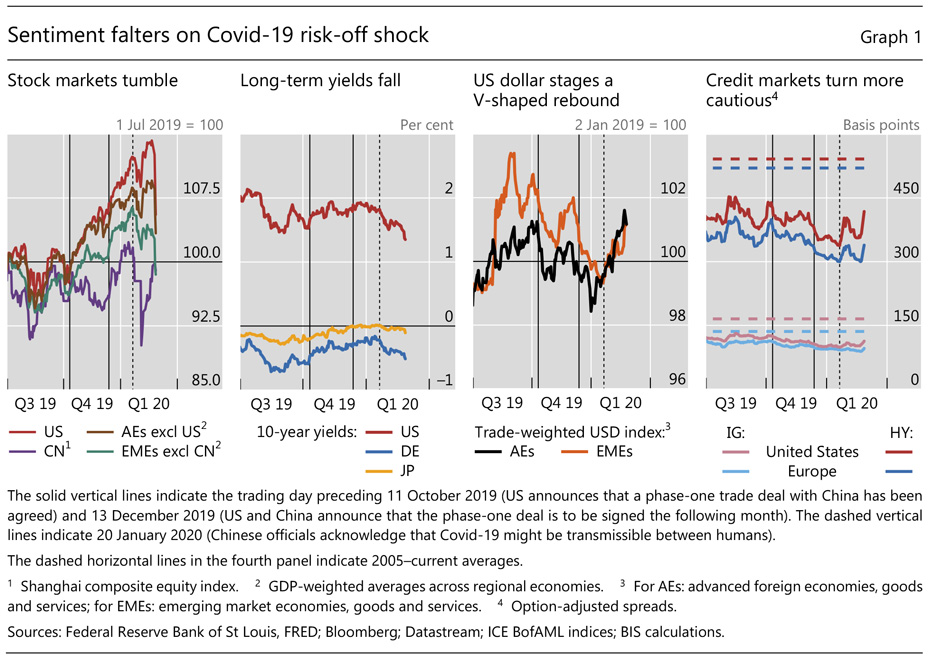
The announcement on 13 December of a formal signing date for the phase-one trade deal between the United States and China breathed new life into a fading stock market rally. In early January, global equity valuations reached new highs amid incoming data suggesting that manufacturing activity was likely to have bottomed out at year-end. Among emerging market economies (EMEs), the stock markets of the countries more closely integrated in global value chains (GVCs) appeared to have benefited relatively more. The buoyant sentiment steepened yield curves and compressed corporate credit spreads in advanced economies (AEs), as well as sovereign and corporate spreads in EMEs. With a risk-on phase in full swing, stock market-implied volatilities fell back to recent lows. Consistent with the rise in risk appetite, the US dollar depreciated notably over this period.
First in mid-January, and then with even greater intensity in late February, the worsening news relating to the Covid-19 outbreak roiled markets. As investors fretted over the outbreak's economic fallout, commodity prices dropped, longer-term yields in AEs declined appreciably, and the mid-range of the US term structure inverted. Stock markets across the globe swung with news of the virus outbreak, relinquishing their earlier gains by late February. The US dollar appreciated, in particular against currencies of emerging Asian economies and commodity exporters. Although credit spreads widened somewhat, credit markets in AEs and fixed income markets in EMEs remained resilient, with portfolio inflows into EMEs continuing into February. All told, a stronger US dollar, depressed commodity prices, heightened stock market-implied volatilities and a deep inversion of the US term structure signalled a significantly more cautious mood by late February - the end of the review period.
Throughout, the central banks of major economies maintained an accommodative policy stance, while those of some large EMEs eased policy further. Overall, investors expected policy rates to stay unchanged in the short to medium run. That said, futures markets priced in some further easing by the Federal Reserve in the second half of this year.
Key takeaways
- The late 2019 upswing in market sentiment faltered in early 2020 amid unease overthe impact of the Covid-19 outbreak.
- The sell-off was uneven across asset classes and regions, affecting countries with close geographical or economic links to China more than others.
- Direct lending by non-banks - private credit to riskier firms - is almost as large as and structurally similar to the better known leveraged loan market.
Trade deal spurs a rally in risk assets
Investor sentiment regained significant momentum early in the period under review. The boost to sentiment reflected the confluence of a marked reduction in global trade tensions and evidence that the downturn in manufacturing was bottoming out.
Trade-related concerns abated significantly late last year. On 13 December, the United States and China announced the formal signing date for their phase-one deal. Around the same time, the UK election dispelled uncertainty about the date and conditions of the United Kingdom's exit from the European Union. And in mid-January, the US Senate approved the US-Mexico-Canada Agreement (USMCA), removing an important roadblock to that deal.
Incoming data during this period reinforced signs that the global economic outlook had turned. The improvement reflected continued healthy labour markets, which supported consumer spending in AEs. In the United States, the housing market was benefiting from the earlier Fed-induced decline in mortgage interest rates, and January survey data pointed to a firming of both consumer and business confidence. Surveys of purchasing managers' expectations (PMIs) released in early January indicated that, despite ongoing weakness in Germany, global manufacturing activity was likely to have bottomed out in December, and factory output was poised to expand. Services PMIs remained resilient to the end of 2019. In addition, corporate earnings announcements in the United States, which largely met or exceeded expectations, also contributed to growing optimism.
Risk assets reacted strongly to the improved economic environment and buoyant sentiment. In the United States the stock market had reached a record high by early January, whereas outside the United States the phase-one deal announcement revived a fading rally (Graph 1, first panel). Measures of compensation for bearing the risk of large declines in equity valuations plummeted, and option-implied volatilities hovered near multi-year lows. Long-term government yields in all major AEs continued on the upward trajectory that had started in October (second panel). Amid surging investor risk appetite, the US dollar depreciated broadly vis-à-vis most currencies, but especially against those of EMEs (third panel).
Corporate bond spreads also narrowed noticeably. In the investment grade segment, spreads declined by about 10 basis points in both the United States and the euro area (Graph 1, fourth panel, light lines). The increase in investor risk appetite was especially apparent in the high-yield segment, where spreads dropped more than 60 basis points in the United States and about 45 basis points in the euro area (Graph 1, third panel, dark lines). In fact, spreads in both segments of the corporate bond market broke through their respective lower bounds of the 2019 trading range and approached multi-year lows.
Global health scare halts sentiment
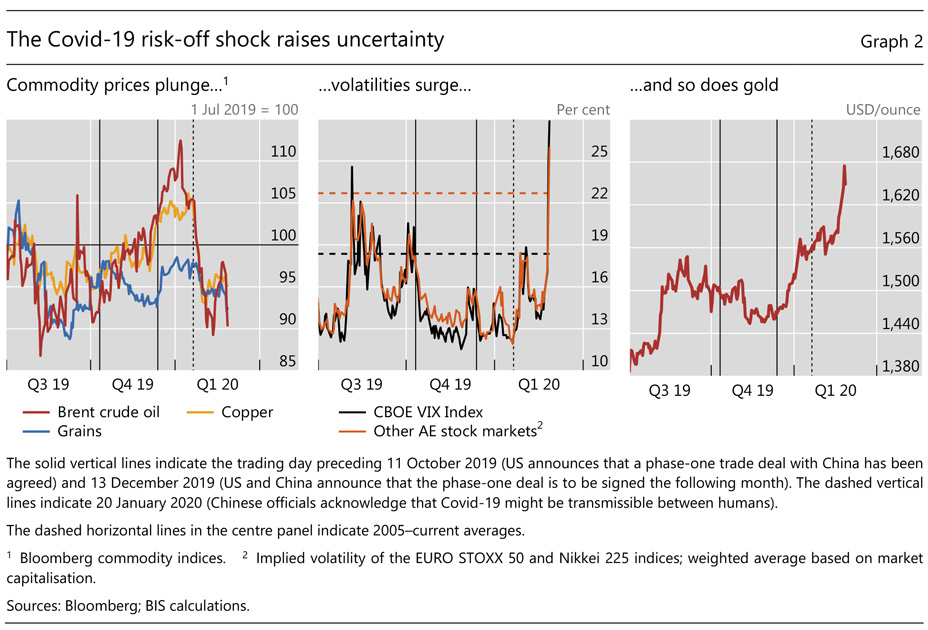
The risk-on phase came to an end in mid-January as concerns mounted over the economic fallout of the Covid-19 outbreak that started in China.2 Global stock markets swung widely, eventually giving up the gains racked up during the trade-induced rally. Long-term government bond yields in AEs declined sharply, credit spreads widened somewhat, and the US dollar strengthened. As investors began to question the outlook for the global economy, the prices of commodities more closely related to energy, construction and manufacturing dived (Graph 2, left-hand panel).
On 27 January, worries that the outbreak could turn into a pandemic sent global stock indices sharply lower. The losses were large in EMEs and non-US AEs, all of which gave up a portion of the gains that had followed the US-China deal (Graph 1, first panel). In early February, when trading resumed in China after an extended lunar new year break, stock prices nosedived again. Market sentiment appeared to have stabilised in early February, and stock markets largely recouped their previous losses, although they stayed subdued in Asia. The interlude, however, was short-lived: a fresh wave of selling pressure swept across equity markets late in the period, following further evidence of the global spread of the coronavirus. Consistent with a pullback in risk-taking, stock market-implied volatilities jumped across jurisdictions, and the price of gold soared (Graph 2, centre and right-hand panels).
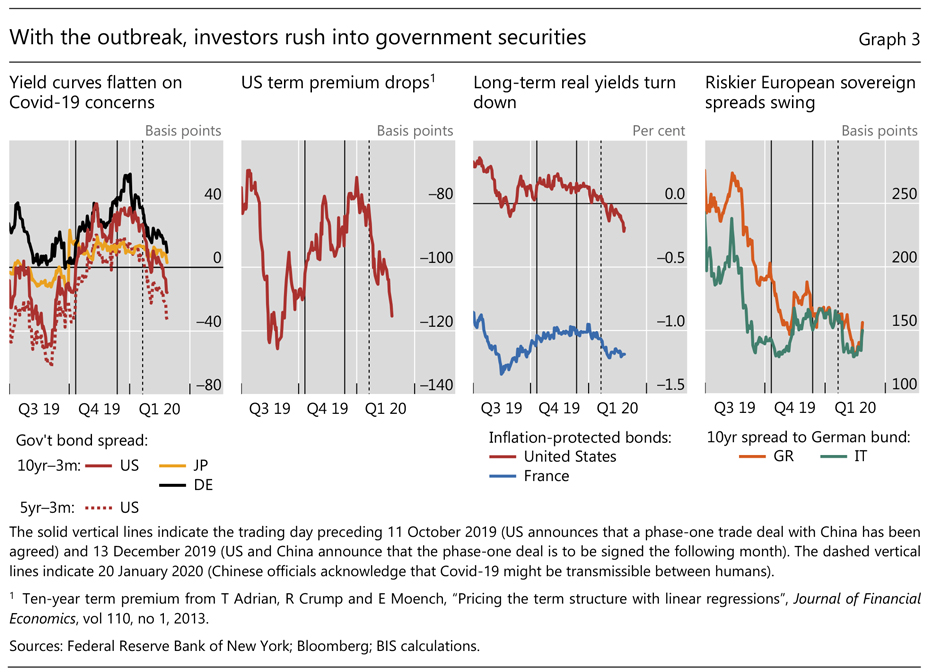
In fixed income markets, the yields of long-term government bonds in AEs declined significantly as investors fretted over the risks to the economic outlook (Graph 1, second panel). During the previous risk-on phase, growing risk appetite had gone hand in hand with steepening yield curves, particularly those of US Treasuries and German bunds (Graph 3, first panel). After being negative for most of 2019, the US 10yr-3m term spread had re-entered positive territory last October, mainly driven by increases in long-term yields. However, as news of the Covid-19 outbreak worsened, longer-dated US yields dropped, pushing the 10yr-3m term spread back into negative territory. The decline in the 10-year yield appeared to be due in large part to a significant drop in the term premium (Graph 3, second panel).
More broadly, the shape of the US term structure suggested that investors were pricing in some additional and persistent monetary accommodation - "low for even longer". In mid-January, the spread between the five-year US Treasury yield and the three-month T-bill rate, a rough gauge of the expected policy path over the medium term, dropped back into the negative range. As news of the virus spreading around the globe roiled financial markets, the 5yr-3m term spread declined further, reaching a level last seen just before the easing of trade tensions in early October (Graph 3, first panel).
During the risk-off phase, a notable decline in estimates of real (inflation-adjusted) long-term yields in major AEs echoed investors' unease about the growth outlook (Graph 3, third panel). During the initial stage of the health scare in late January, the rush into government paper in the euro area did not stop at German bunds, as sovereigns on the periphery also saw their spreads vis-à-vis Germany trimmed (Graph 3, fourth panel). However, later reports of the virus spreading through northern Italy and Korea - in addition to sinking equity markets - sent periphery euro area sovereign spreads back to levels that had prevailed in early January.
The central banks of major economies maintained a supportive policy stance, and some large EME central banks eased further. Sveriges Riksbank was an exception, as in December it ended its foray into negative policy rate territory. On balance, against a backdrop of still strengthening economic activity, subdued inflation and the monetary easing that had been in place since late 2018, major central banks signalled a pause in near-term policy adjustments. Nevertheless, forward rates in the United States suggested that investors were expecting further rate cuts in 2020, even before the virus outbreak.
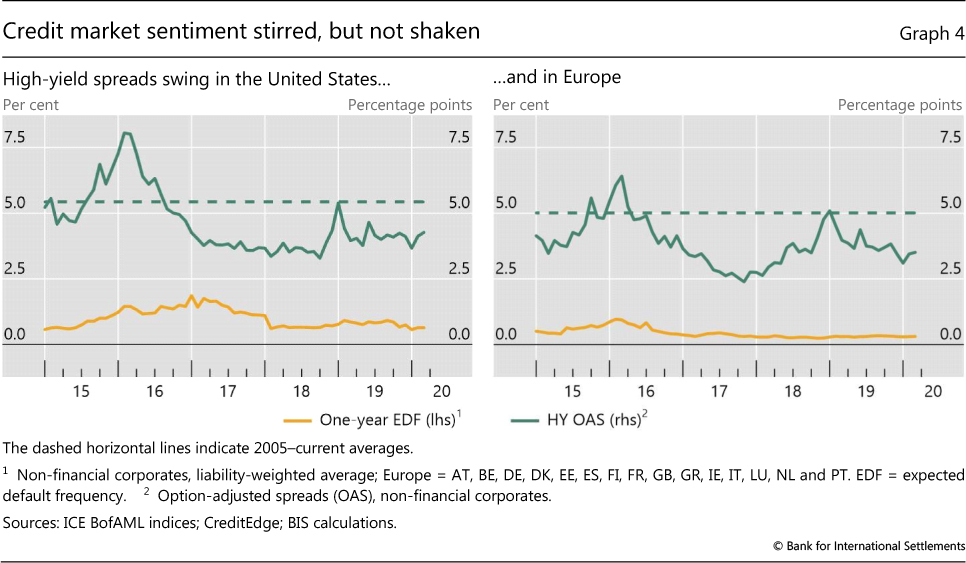
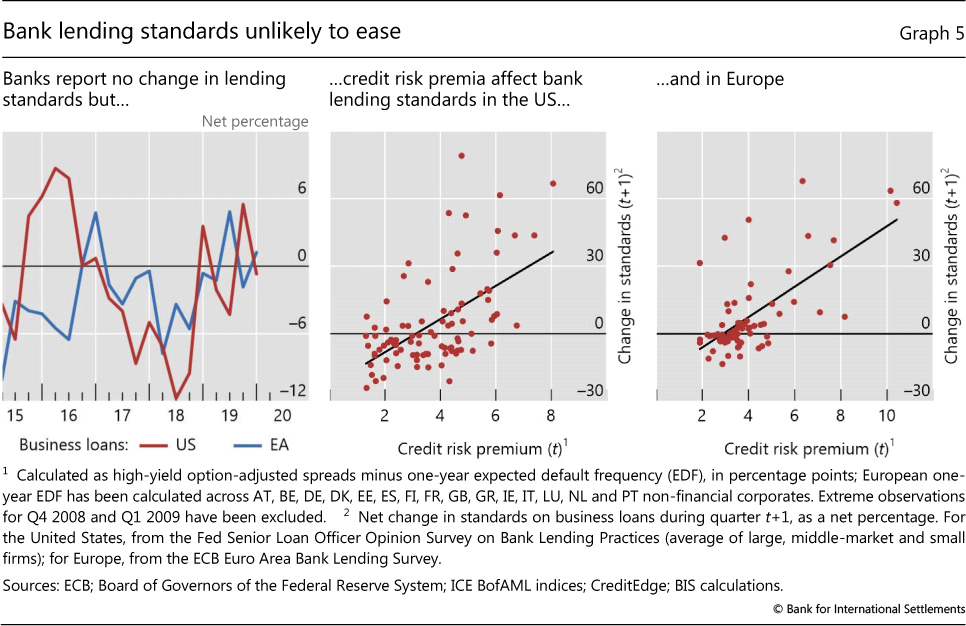
Corporate credit markets appeared fairly resilient in the face of the large stock market correction. Both investment and speculative grade spreads widened somewhat in late January as investors started to pull away from risky assets. This momentum accelerated in late February, when fears over the impact of the Covid-19 outbreak sparked a sell-off in high-yield bonds. Swings in credit market sentiment can be assessed by the gap between the high-yield spread and the expected year-ahead default probability, a rough gauge of the credit risk premium. In early January, as high-yield spreads in both jurisdictions neared their recent lows, this premium approached the 30th percentile of its historical distribution in the United States (Graph 4, left-hand panel); in Europe, the same measure declined to around the 15th percentile of its historical distribution (Graph 4, right-hand panel). As sentiment soured late in the review period, the increase in risk aversion was relatively moderate: in the United States, the credit risk premium moved slightly above the 45th percentile of its historical distribution, whereas in Europe it returned to about the 30th percentile, levels that had prevailed before the onset of the risk-on phase.
Changes in risk appetite in bank-intermediated markets for business credit were mixed. According to the lending surveys released by the Federal Reserve and the ECB earlier this year, US and euro area banks did not change, on net, their lending standards on business loans during the fourth quarter of 2019 (Graph 5, left-hand panel). However, issuance of leveraged loans in the United States and Europe during January 2020 surged to twice the amount recorded in January 2019. From a longer-term perspective, buoyant risk appetite in corporate bond markets tends to be closely associated with subsequent easing of banks' lending standards (Graph 5, centre and right-hand panels). In light of the recent increase in credit risk premia in both the United States and Europe, bank lending standards are unlikely to loosen in the near term. In turn, that may lead to opportunities for non-bank financial intermediaries to further increase their footprint in the market for loans to small and medium-sized businesses (Box A).
Discerning investors in EMEs?
The Covid-19 outbreak had a differentiated impact on the prices of EME assets, as investors refrained from a wholesale sell-off during the period under review. During the trade-related risk-on phase, EME assets extended the rally triggered last October, and the stocks of countries more closely integrated in GVCs appeared to have benefited more. With mounting evidence of the increasing threat represented by the new viral infection, EME share prices and currencies pared their earlier gains, with the losses concentrated on countries closer to China geographically or economically.
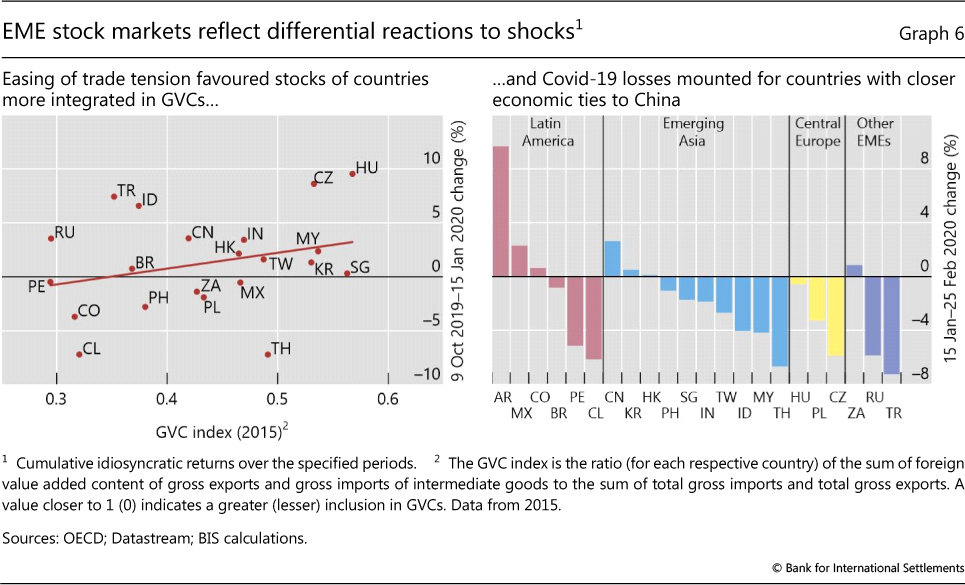
Amid the significant reduction in trade tensions, investors appeared to have favoured the stock markets of countries more embedded in manufacturing GVCs. Once the overall effect of the appreciation of global stock markets during this period is taken into account, equity markets in GVC countries generally outperformed those of commodity producers (Graph 6, left-hand panel). This finding suggests that investors expected larger gains from those markets in which firms would benefit, directly or indirectly, from a resumption of "business as usual" in global manufacturing processes. Markets dominated by commodity producers, in contrast, may not see an improvement in business conditions until manufacturing production increases materially, and commodity inventories are wound down.
On net, those stock market gains largely evaporated as the health scare spooked global financial markets. While equity prices fell across the globe, once this general effect is accounted for, the declines were more pronounced in Asia. In contrast, the same measure of idiosyncratic stock market performance points to a better outcome in geographically distant Latin America, which is mostly linked to China through commodity exports (Graph 6, right-hand panel). In the case of Mexico, for instance, the relatively strong idiosyncratic stock market returns seemed connected to the positive news on the USMCA. Market commentary had drawn numerous comparisons with the 2003 outbreak of severe acute respiratory syndrome (SARS). Such comparisons, however, are inherently difficult, given the profound changes in the global economy and financial markets over the past 20 years. Box B provides an additional perspective on this comparison based on the reaction of stock markets now and then.
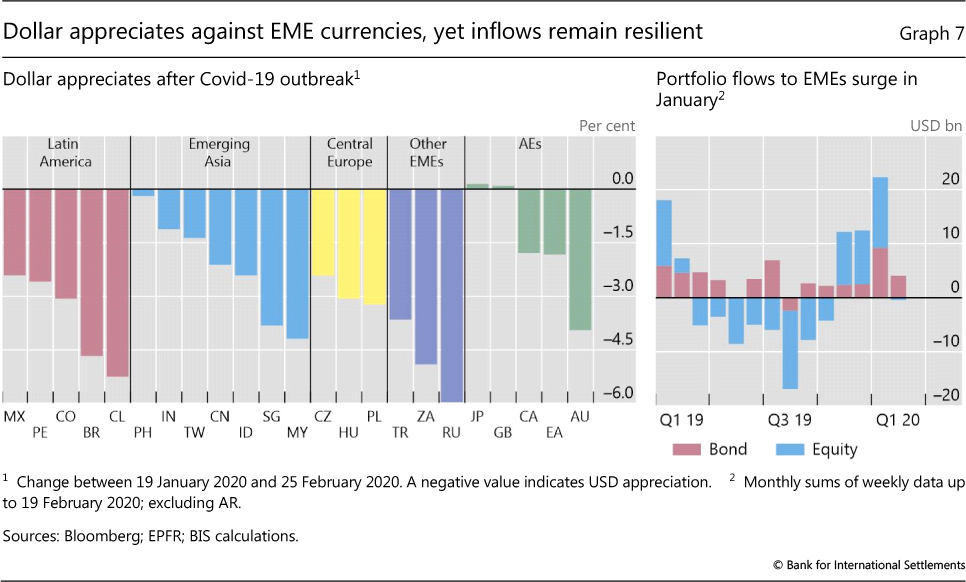
Swings in FX markets were similar to those in stock markets. On balance, EME currencies strengthened significantly against the US dollar during the period under review (Graph 1, third panel, orange line). In trade-weighted terms, EME currencies had hit a trough in early September 2019, after the breakdown in US-China trade negotiations, and rallied thereafter. The appreciation picked up pace after the signing of the phase-one deal. To be sure, the dollar strengthened materially with the onset of the virus risk-off episode. But within each geographical region, including AEs, large commodity exporters and countries with close economic links to China saw a stronger depreciation (Graph 7, left-hand panel).
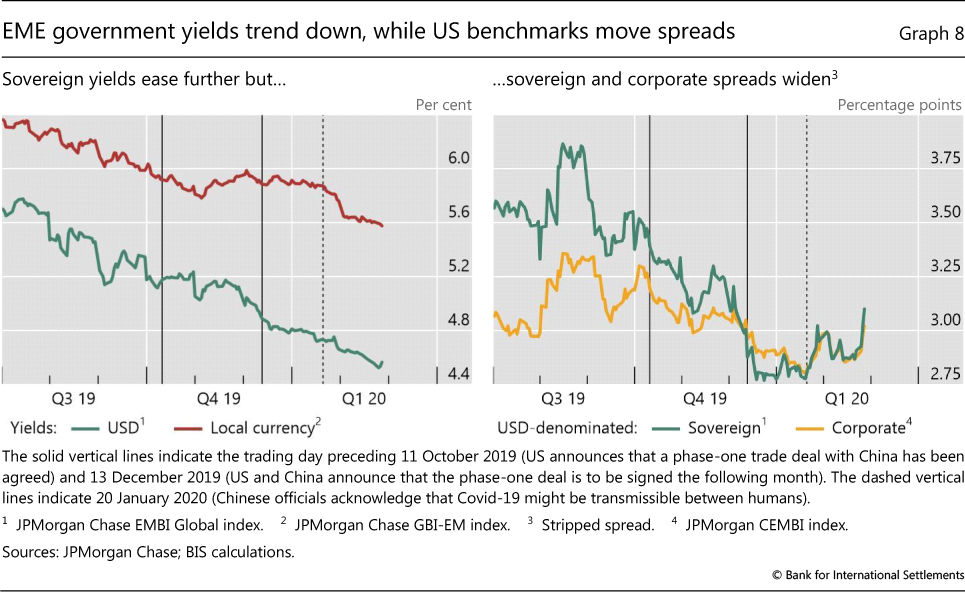
As was the case in AEs, price reactions in EME fixed income markets were more restrained than those of other asset classes. Yields of US dollar-denominated sovereign debt continued to trend lower throughout the last quarter of 2019 and into late February (Graph 8, left-hand panel, green line). The decline in EME yields throughout this period reflected, in part, robust capital flows into EME bond and equity investment funds (Graph 7, right-hand panel). An index of local currency sovereign yields also eased during the period under review, mainly driven by declines in the yields of Brazil and Turkey (Graph 8, left-hand panel, red line).
The appetite for US dollar-denominated EME corporate debt remained robust amid swings in investor sentiment. During the risk-on phase, the spreads on EME corporate debt breached the floor of the range in which they had traded during most of 2019, reaching levels comparable to those observed during the first half of 2018, before the escalation of trade tensions (Graph 8, right-hand panel, yellow line). At the same time, the spreads on US dollar-denominated EME sovereign debt narrowed at a quicker pace, slipping below those on corporate debt (Graph 8, right-hand panel, green line). Although EME credit spreads (sovereign and corporate) widened noticeably in response to the Covid-19 outbreak, the increase was due almost entirely to a decline in comparable-maturity US benchmark yields. This pattern had characterised fluctuations in EME spreads throughout 2019 and suggests that recent swings in investors' sentiment have had a larger impact on the US benchmarks - possibly through movements in the term premia - than on the corresponding EME yields.
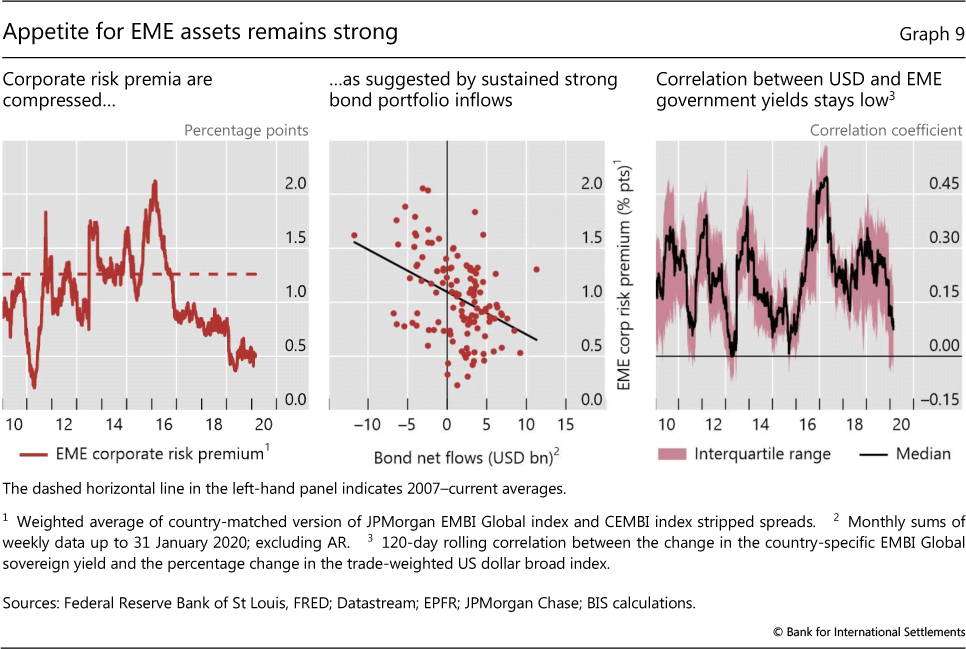
Despite some repricing, the compensation for bearing EME corporate credit risk has hovered at low levels by historical standards. As noted, the spread between EME dollar-denominated corporate and sovereign debt, as measured by the difference between the CEMBI (corporate) and the EMBI Global (sovereign), turned positive during the risk-on phase. This move re-established the expected relationship between spreads demanded by investors in these two asset classes. The spread inversion that had persisted for some time is wholly accounted for by the difference in the set of EMEs included in the two indices. In fact, such an anomaly disappears when corporate and sovereign spread indices are constructed using a matched sample of underlying EMEs (Graph 9, left-hand panel). According to this metric, EME corporate risk premia are quite compressed, sitting well within the lowest decile of their historical distribution. Moreover, they were largely unaffected by factors that shaped developments in financial markets over the past year.
Investors' sanguine outlook for the EME corporate bond market is consistent with the steady investment flows into EME bond funds, which surged in January and continued through mid-February. Historically, such inflows are strongly associated with low levels of risk compensation in this market (Graph 9, centre panel). Investors' robust appetite for EME fixed income assets is also evident in a significant decline in the correlations between yields on dollar-denominated sovereign bonds and the trade-weighted US dollar across a range of EMEs (right-hand panel). Against this backdrop, EME corporates issued a record amount of foreign currency-denominated bonds in the first few weeks of the year.
Box A
Private credit: recent developments and long-term trends
Sirio Aramonte
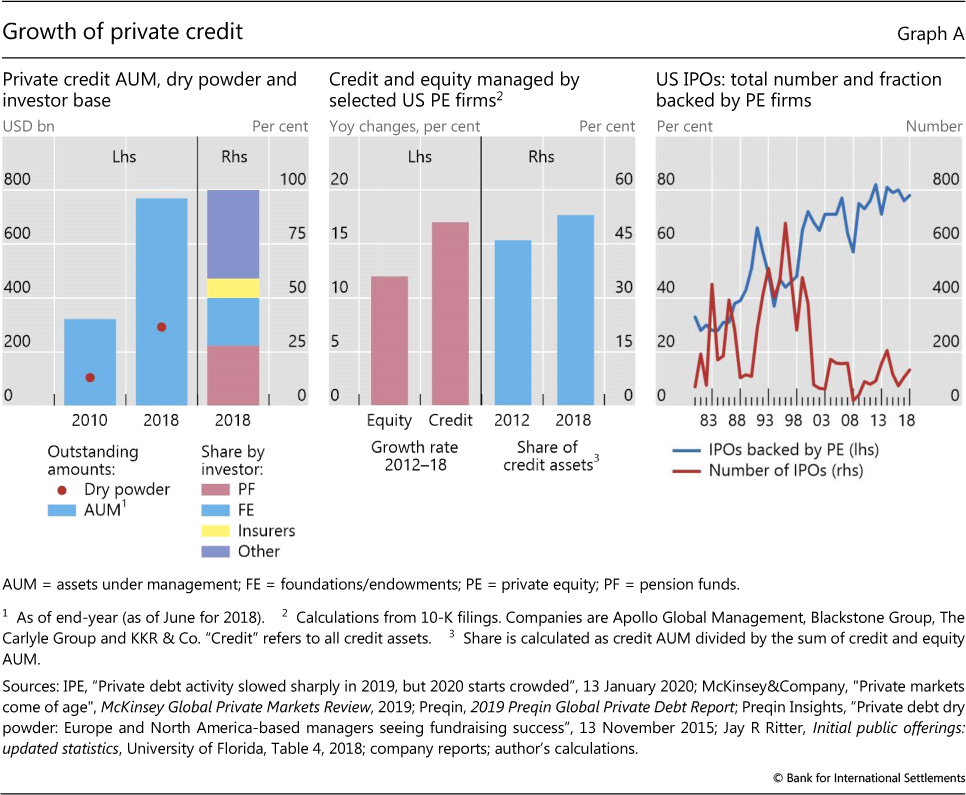
Non-bank investors are increasingly extending loans directly to firms, with limited involvement on the part of banks. Such lending is frequently referred to as private credit, to distinguish it from bank-intermediated credit. Private credit is typically offered to firms that are smaller, with earnings well below $100 million, than those borrowing through leveraged loans, which are originated mostly by banks. The outstanding amount of private credit grew from little more than $300 billion in 2010 to nearly $800 billion in 2018 (Graph A, left-hand panel, first two bars). The leveraged loan market is larger, yet the nearly $500 billion increase in private credit between 2010 and 2018 mirrored the approximately $600 billion rise in leveraged lending. The growth of private credit represented about 8% of the expansion in credit to non-financial corporates (NFCs) in advanced economies (AEs) over the 2010-18 period. Surveys indicate that roughly half of private credit asset managers invest predominantly in the United States, one fourth focus on the United Kingdom, and the remainder are spread around the world.
There are structural similarities between the private credit and leveraged loan markets. First, the respective investor bases overlap substantially. As of end-2018, insurance companies and pension funds together backed about one third of private credit (Graph A, left-hand panel, third bar) and one fourth of leveraged loans (either directly or through collateralised loan obligations (CLOs)). The combined exposure of these intermediaries to high-yield corporate loans totalled nearly $600 billion. Second, asset managers that oversee funds investing in private credit also manage CLOs and other leveraged loan funds. Third, lack of transparency in post-origination loan trading, together with the opacity of the leverage some investors take on, complicates the mapping of credit risk exposures.
While the growth in private credit is a decades-long trend, it accelerated after the Great Financial Crisis (GFC) of 2007-09. Banks had started retrenching from credit provision to the US corporate sector as early as the mid-1980s, and the current size of private credit and leveraged lending combined amounts to no less than about 90% of US banks' commercial and industrial loans. Post-GFC, the expansion of private credit was fuelled by the combination of stagnating bank asset growth and attractive private debt yields relative to syndicated loans. The 2% higher yield has been key in attracting investors such as pension funds and insurance companies, which added private credit to their portfolios of leveraged loans and CLOs. These investors have stronger incentives to reach for yield because they often need to meet absolute return targets.
Even though banks are not involved in the origination of private credit, they are still exposed to developments in this market through the provision of leverage to private credit funds. Slightly less than 50% of portfolio managers reported borrowing against fund assets. Typically, the ratio of debt to equity is less than two. About 40% of portfolio managers borrowed using subscription credit lines, whose collateral is a fund's "dry powder", or undrawn capital commitments made by investors. Subscription credit lines are meant to reduce the frequency of capital calls, and are typically provided by banks. Private credit funds have nearly $300 billion of dry powder ready to be invested should suitable opportunities arise (Graph A, left-hand panel). As a result, subscription credit lines are a potentially significant channel of indirect bank exposure to private credit, echoing the indirect exposure of banks to CLOs that arises from prime brokerage financing to hedge funds.
Private equity (PE) firms have taken on an increasingly central role in private credit. In addition to financing mergers and acquisitions, PE firms traditionally provided equity to small or distressed firms for early development or restructuring, in the form of venture capital or buyouts. Besides gaining expertise in financing high-risk businesses, PE firms also built relationships with a broad set of potential borrowers. Indeed, private credit lenders expected that one third of future lending opportunities would arise from collaboration with PE firms. Building on their expertise and relationships, several PE firms expanded the number of credit funds they set up and manage, including those specialising in private credit. Among the main US PE firms, the assets under management (AUM) of their credit funds rose by 17% per year between 2012 and 2018, compared with 12% for their equity funds. In 2018, credit AUM stood at $430 billion and represented 53% of equity and credit AUM combined, up from 46% in 2012 (Graph A, centre panel).
PE firms took on a more prominent role in private credit at the same time as they grew their influence on early-stage equity financing. While the overall number of initial public offerings (IPOs) in the United States declined substantially between 1995 and 2018, from 461 to 134, a larger fraction of IPOs, from 47% to 78%, were by companies backed by PE firms in the form of venture capital or buyouts (Graph A, right-hand panel).
The emerging ecosystem of credit provision to small and medium-sized firms raises issues concerning financial stability and investor protection. Four stand out: first, the interaction between unexpectedly large losses and lender vulnerabilities; second, potentially heightened procyclicality in loan supply; third, possible conflicts of interest linked to the more prominent and multifaceted role of PE firms; and fourth, the relative opacity of certain strategies that raise effective leverage above reported values.
Unexpectedly large losses could have significant adverse effects on certain lenders. Much as in the market for leveraged loans, higher yields on private credit loans have attracted investors, and strong demand has been accompanied by deteriorating covenant protection. Roughly 30% of portfolio managers indicated that loan covenants had become less stringent in 2018, compounding the loosening observed during the previous three years. While much of private credit takes the form of secured loans, which have relatively high recovery rates, any repricing would be sharper if weaker covenants had lowered recovery rates. Sizeable losses could be particularly detrimental to some lenders, especially at times of limited access to wholesale credit. For instance, insurance companies could have difficulties meeting unusually large cash flow shortfalls with asset sales, even if these shortfalls were relatively small compared with their portfolios, due to asset-liability matching.
Private credit might prove strongly procyclical, as fund managers have incentives to time the (illiquid) market. Unlike mutual funds, private credit funds are typically closed-end and investors cannot withdraw capital in the event of persistently poor fund returns. However, AUM growth depends on past performance. To avoid losing future AUM to competitors, fund managers might scale back loan origination and dispose of existing loans at the first signs of a downturn, before already low market liquidity declines further. Funding costs for smaller firms would increase rapidly, unless appropriate hedges are in place, since most private credit loans have floating interest rates.
Conflicts of interest could arise if equity and credit funds managed by a PE firm invested in the equity and debt of the same company. In principle, private credit investors could, for instance, face the risk of unexpected losses in the event of debt restructurings unduly favourable to equity holders. To be sure, investors already benefit from the oversight of securities regulators on PE firms in both Europe and the United States. Even so, the intrinsic opaqueness of private credit borrowers, on top of market illiquidity, poor loan-price transparency and increasing deal leverage, could lead lenders to further minimise risks by consolidating assets at incumbent PE firms with an established reputation. As a result, smaller companies could have fewer funding options.
Private credit funds can employ certain strategies that increase effective leverage above reported leverage. For instance, business development companies (BDCs) are US funds that typically invest in loans to small companies. While subject to strict leverage limits, certain BDCs purchase loans through vehicles in which BDCs hold a subordinated interest, thus increasing the sensitivity of their returns to loan values, just as leverage would. Overall, these strategies can make it harder for investors in private credit funds to gauge risk accurately.
The views expressed are those of the author and do not necessarily reflect the views of the Bank for International Settlements. This box focuses on corporate loans, but the term "private credit" is sometimes interpreted as also including other types of non-bank credit (for instance, infrastructure and real estate debt). The defining characteristic of the various types of private credit is the limited involvement of banks at origination. Survey statistics on regional concentration are from Alternative Credit Council, "Financing the economy 2017", 2017. Trends in bank lending are from Federal Deposit Insurance Corporation, "Leveraged lending and corporate borrowing: increased reliance on capital markets, with important bank links", FDIC Quarterly, December 2019. Figures on fund leverage are from Alternative Credit Council, Financing the economy 2018, 2018. See S Aramonte and F Avalos, "Structured finance then and now: a comparison of CDOs and CLOs", BIS Quarterly Review, September 2019, pp 11-14. See N Foley-Fisher and B Narajabad and S Verani, "Assessing the size of the risks posed by life insurers' non-traditional liabilities", FEDS Notes, 21 May 2019.
Box B
Covid-19 and SARS: what do stock markets tell us?
Fernando Avalos and Egon Zakrajšek
The rapid spread of Covid-19 since mid-January invariably brings up a comparison with the early 2003 outbreak of severe acute respiratory syndrome (SARS). In this box, we provide a preliminary assessment of the relative impact of the Covid-19 and SARS epidemics on various economies through the lens of equity investors. An advantage of looking at the stock markets of different countries is that equity valuations should encompass both the local and global risk factors that the investors view as important. Fluctuations in the global risk factor - gauged, for instance, through the returns on the MSCI Global index - may be driven by investors' concerns about the global economic fallout of a virus outbreak. Such fluctuations are likely to have a differential effect on each country's stock market performance; moreover, the magnitude of these effects is likely to have changed in the nearly two decades between the two epidemics. Nevertheless, we can calculate "idiosyncratic" stock returns, the portion of a country-specific stock return that is not explained by fluctuations in the global risk factor, as the residual from a regression of the country's returns on the returns on the MSCI Global index. The comparison of the idiosyncratic country-specific returns during periods in which the Covid-19 and SARS epidemics unfolded can thus provide a cleaner assessment of the relative fallouts from the two outbreaks across countries and time, at least as perceived by equity investors.
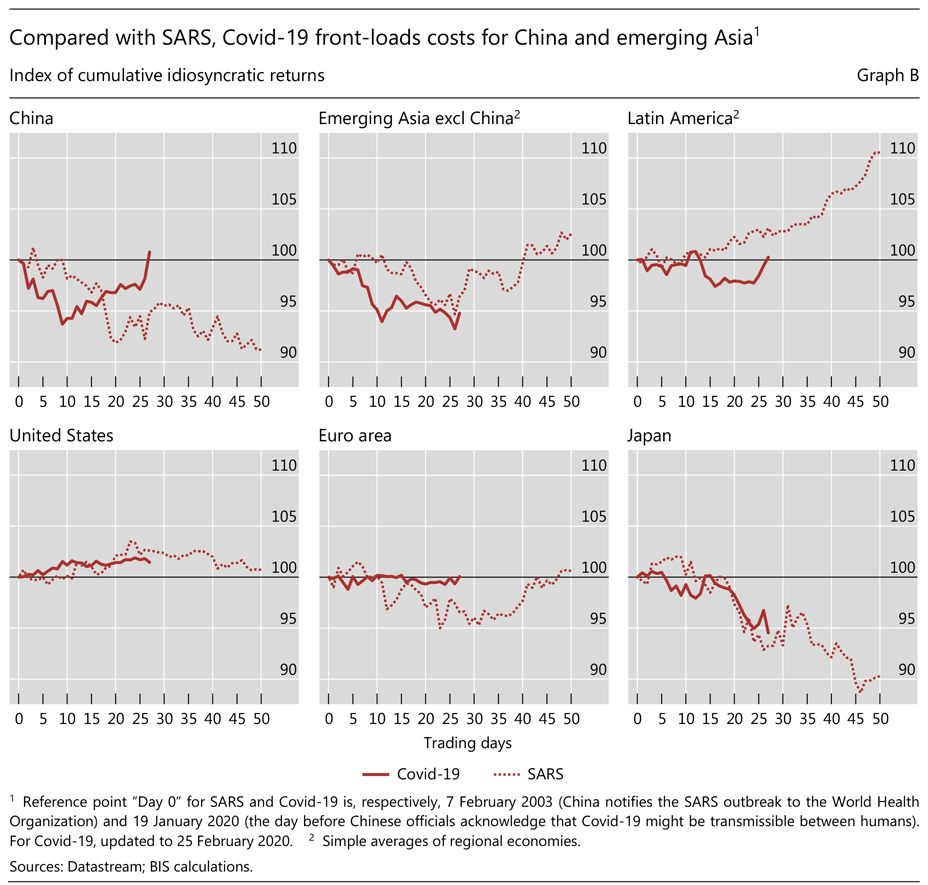
According to this metric, the Covid-19 outbreak appears to have had an appreciably more front-loaded adverse effect on the Chinese stock market than the 2003 SARS epidemic (Graph B, first panel). Abstracting from the Chinese stock market's co-movement with the global market, Chinese equity valuations were down more than 5% after the 10th trading day following the news of the outbreak. In contrast, it took about 20 trading days for the Chinese market to incur such a loss during the SARS epidemic, as the very early phase of the outbreak saw a performance quite in line with the global MSCI. Part of this difference may be explained by the more forceful reaction of the Chinese authorities to the Covid-19 outbreak, which may have cued investors about the seriousness of the problem, whereas in the past this realisation took longer to be priced in. After the 10th trading day, Chinese stocks began to recoup their losses vis-à-vis the global market, while during the SARS epidemic losses continued to cumulate for a considerably longer period.
Emerging Asian stock markets outside China also suffered greater losses initially than during the SARS outbreak (second panel). This result is likely to reflect the increase in China's global economic imprint, and its greater integration in the world economy since the first epidemic, as well as the proximity of Asian economies to the epicentre of the Covid-19 outbreak. By the 20th trading day, however, the cumulative losses in those markets had roughly converged to those registered during the SARS epidemic. The average initial impact of the Covid-19 outbreak on the stock markets of emerging market economies in Latin America, again controlling for their co-movement with the global market, had been very muted and in line with that of the SARS epidemic (third panel). In early February, however, the performance of stock markets in Latin America deteriorated noticeably. This may be partly explained by investors' growing concerns that weak commodity prices are unlikely to recover soon, which would have a negative effect on those economies. Back in 2003, in contrast, commodity prices were in the early stages of a sustained rally that was interrupted only by the Great Financial Crisis of 2007-09.
Turning to advanced economies, the fallout on US and Japanese equities from the Covid-19 outbreak roughly paralleled that from SARS for the first 25 trading days following the news of the respective outbreaks (fourth and sixth panels). In contrast, the idiosyncratic performance of euro area stocks has thus far been slightly better than that registered during the comparable period of the SARS epidemic (fifth panel).
The views expressed are those of the authors and do not necessarily reflect the views of the Bank for International Settlements. The global risk factor should also reflect other features of the environment that were influencing stock market developments in different countries at different times. For example, the global economy during the SARS outbreak, which began in November 2002 and spread most rapidly between February and April 2003, was in a state of lingering weakness following the 2001 dotcom bust and the ensuing recession. The Covid-19 outbreak, by contrast, occurred during one of the longest economic expansions on record, with robust labour markets and solid consumer spending worldwide. The SARS epidemic also coincided with escalating political tensions that culminated in the Iraq war in mid-March 2003, a sequence of events that had its own effect on financial markets and the global economy. The Covid-19 outbreak, in contrast, is unfolding amid swings in trade-related tensions that have had a significant effect on stock markets throughout the world. The regression is based on the capital asset pricing model (CAPM).
1 The period under review extends from 28 November 2019 to 25 February 2020.
2 On 20 January, news about the spread of the Covid-19 outbreak rattled markets, as Chinese health authorities acknowledged that there have been cases of human-to-human transmission. That same day, the Chinese leadership issued a directive instructing all levels of government to take actions to curb the spread of Covid-19.