Markets swing on trade and monetary policy
Starting in May, prices of risky assets seesawed in response to unexpected turns in trade policy and adjustments to monetary policy.1 The rally in equity and credit markets seen in early 2019 reversed course in May on the prospect of higher tariffs on US-China trade and US imports from Mexico. Facing weakening growth and subdued inflation, central banks in advanced economies (AEs) as well as emerging market economies (EMEs) eased policy to pre-empt a further deterioration.
The shift to a more stimulative monetary outlook reassured investors. In June, stocks surged and corporate bond spreads narrowed. In light of the broadly synchronous monetary easings, exchange rates for the US dollar against other AE currencies remained stable.
Trade tensions escalated again in August, which renewed downward pressure on equity and credit prices. The sell-off was accompanied by large outflows from EME funds. The renminbi dropped to multi-year lows against the US dollar, and its correlation with other EME currencies rose substantially, underscoring spillovers from China. Risky assets in AEs other than the United States were particularly sensitive to trade tensions, with equities losing more than the S&P 500. The macroeconomic backdrop remained especially vulnerable for export-oriented economies.
The confluence of trade tensions, deteriorating growth prospects and decisive monetary accommodation drove sovereign bond yields to new lows in August. The amount of fixed income securities with negative yields, mainly euro- and yen-denominated government bonds, reached record highs. Yield curves inverted in a number of countries. At times, markets interpreted this inversion as a signal of rising recession risk. However, other indicators painted a more mixed picture. As term premia fell to new troughs, equity prices stabilised. Financial conditions in most AEs remained fairly loose by historical standards.
Trade and monetary policy drove markets in a weakening economy
Significant trade and monetary policy news drove the largest price movements during the period under review. When trade tensions eased, prices of US and Chinese equities posted outsize gains and US Treasury bond prices fell sharply. Similarly, risky asset prices rose when the Federal Reserve indicated a more accommodative stance than anticipated, although moves in those instances were not as pronounced (Graph 1, left-hand panel).
Starting in May, asset prices reflected increasing anxiety about trade. Global stock prices dropped 2% in early May after the United States announced higher tariffs on imports from China, and slid further in mid-May when China countered with its own tariffs. Equities sold off again in late May after the United States threatened to impose tariffs on imports from Mexico unless Mexico stemmed migration to the United States. These drops meant that global stocks closed the month down about 5% (Graph 1, centre panel).
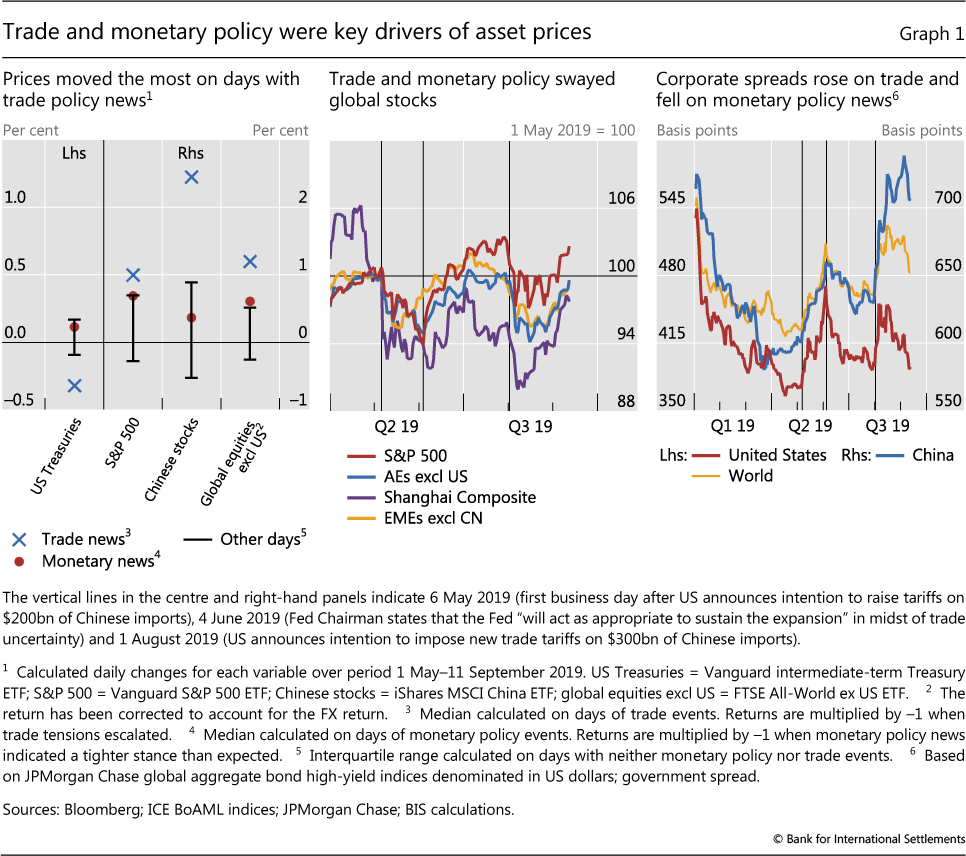
Mirroring disquiet in equity markets, corporate bond spreads rose swiftly. The rise was particularly pronounced in the United States, with high-yield spreads up by about 100 basis points in May, exceeding the increase in global high-yield spreads. Nevertheless, spreads remained below the highs reached in late 2018 (Graph 1, right-hand panel).
In June, anxiety turned to reassurance on prospects of more accommodative monetary policy and an easing of trade tensions. On 4 June, the Fed indicated that it would act as appropriate to sustain the expansion in the face of economic challenges, including those originating from trade disputes. Later in June, the United States cancelled plans to impose tariffs on imports from Mexico, and the United States and China agreed to restart trade talks. These developments triggered a rapid rise in equity prices, with the S&P 500 reaching a new historical peak in late July, and corporate spreads declined (Graph 1, centre and right-hand panels).
Anxiety returned in August on rekindled trade tensions. With new threats on 1 August of US tariffs on Chinese goods, equities dropped and corporate bond spreads widened across the board in a flight to safety (Graph 1, right-hand panel). Although the sell-off was over by mid-August, the prices of risky assets stayed volatile. The relative strength of the US economy helped US high-yield corporate spreads to recover more quickly in the second half of the month than spreads elsewhere.
Trade concerns eased again in early September, when China and the United States agreed to resume trade negotiations. This propelled equities higher and corporate spreads lower. By mid-September, US high-yield spreads were only slightly higher than in April, while their Chinese and global counterparts remained somewhat elevated. Chinese stocks rallied from mid-August, and by mid-September had recouped all of their post-June losses (Graph 1, centre panel).
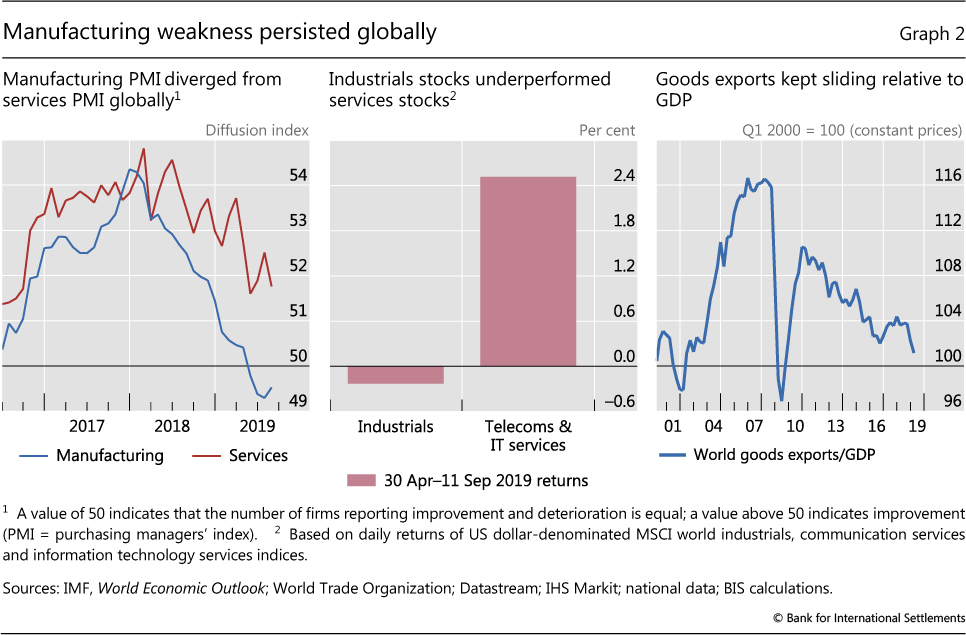
Trade and monetary policy events unfolded in the context of a weakening global economy. Surveys of purchasing managers indicated a slowing of activity in the services sector, although activity continued to expand faster than in manufacturing (Graph 2, left-hand panel; see also the special feature on purchasing managers' indices in this issue). The divergence between services and manufacturing was evident in equity returns, which were lower for industrial firms (centre panel). Furthermore, as a percentage of GDP, goods exports remained on the downward trend that had started soon after the Great Financial Crisis (GFC) of 2007-09 (right-hand panel).
In China, conjunctural indicators were generally weak, with GDP growing in the second quarter by 6.2%, the lowest rate since 1992. However, total social financing expanded at a faster pace than expected in August on the back of fiscal stimulus.
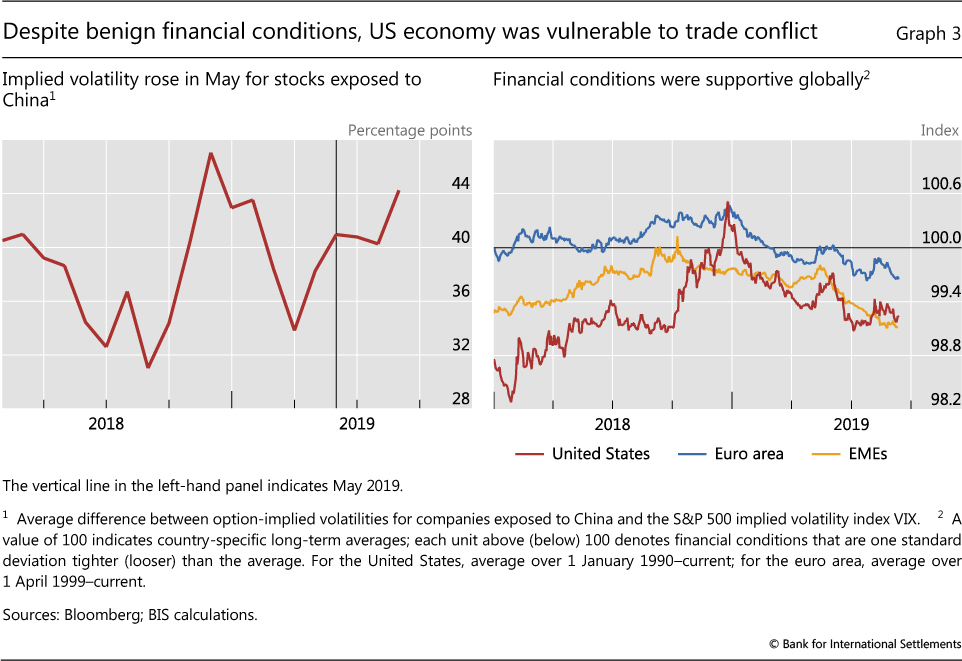
The US economy was not immune to trade tensions. Certain pockets showed signs of weakness, with slowing fixed investment growth and downward revisions to corporate profits forecasts. As a sign of how weaknesses in China could spill over to the United States, expected stock volatilities, calculated from option prices, were significantly higher for companies exposed to China than for the overall S&P 500 index. Indeed, in August this gap approached the heights reached in late 2018 (Graph 3, left-hand panel).
Despite the potential impact of trade tensions on the economic outlook, financial conditions were remarkably stable. In fact, in the United States they remained looser than during the late-2018 market turbulence and noticeably so relative to the long-term average. Financial conditions were also supportive in EMEs and in the euro area (Graph 3, right-hand panel).
Monetary easing gained momentum
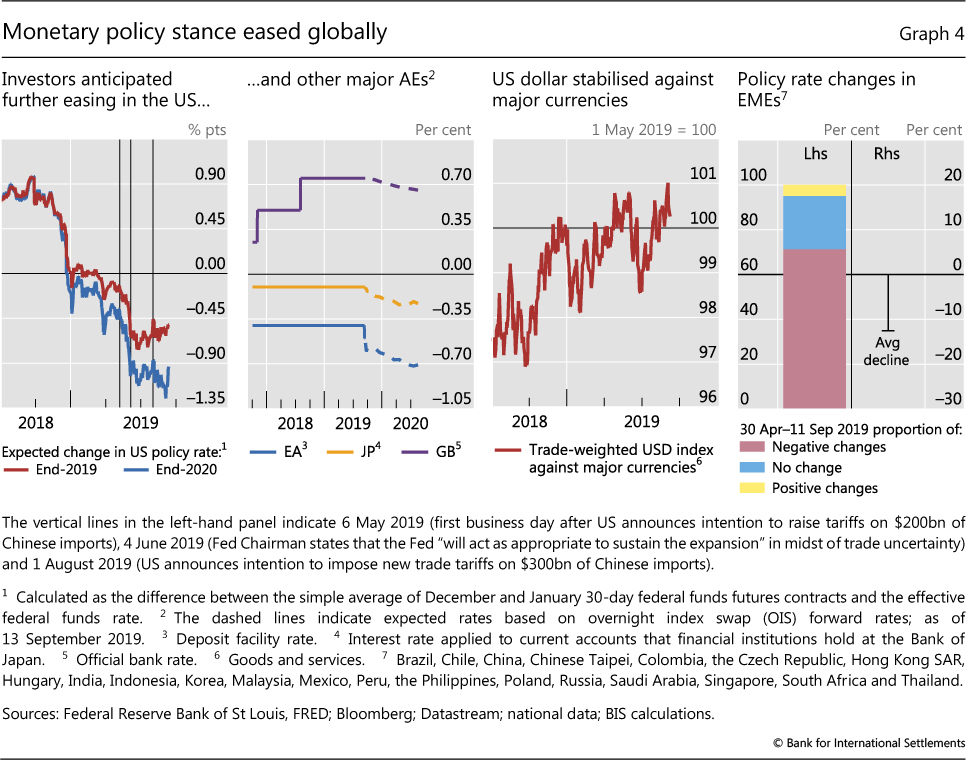
On the back of weakening economic activity, subdued inflation and volatile financial markets, monetary policy turned accommodative across the globe. The Federal Reserve cut its policy rate by 25 basis points in late July, and as of mid-September market participants expected further cuts of roughly 50 basis points by the end of 2019 and 90 basis points by the end of 2020 (Graph 4, first panel). On 12 September, the ECB cut the deposit rate by 10 basis points to -0.5% and restarted its asset purchase programme. Investors expected that policy rates would drop, by the end of 2020, by roughly another 20 basis points in the euro area and about 15 basis points in Japan (second panel).
The broad nature of monetary easing left the US dollar stable against most other AE currencies (Graph 4, third panel). An exception was sterling, where an increase in the prospect of the United Kingdom leaving the European Union without a withdrawal agreement led to a significant depreciation against the US dollar and the euro.
Central banks in many EMEs also eased their policy stance. Among others, Brazil, India, Korea and Mexico lowered their policy rate, with an average decline over the review period of more than 10% of the initial rate (Graph 4, fourth panel). China cut the reserve requirement ratio by 50 basis points for all financial institutions and by another 100 basis points for some smaller city commercial banks. In comparison, only about 25% of EMEs kept policy rates unchanged.
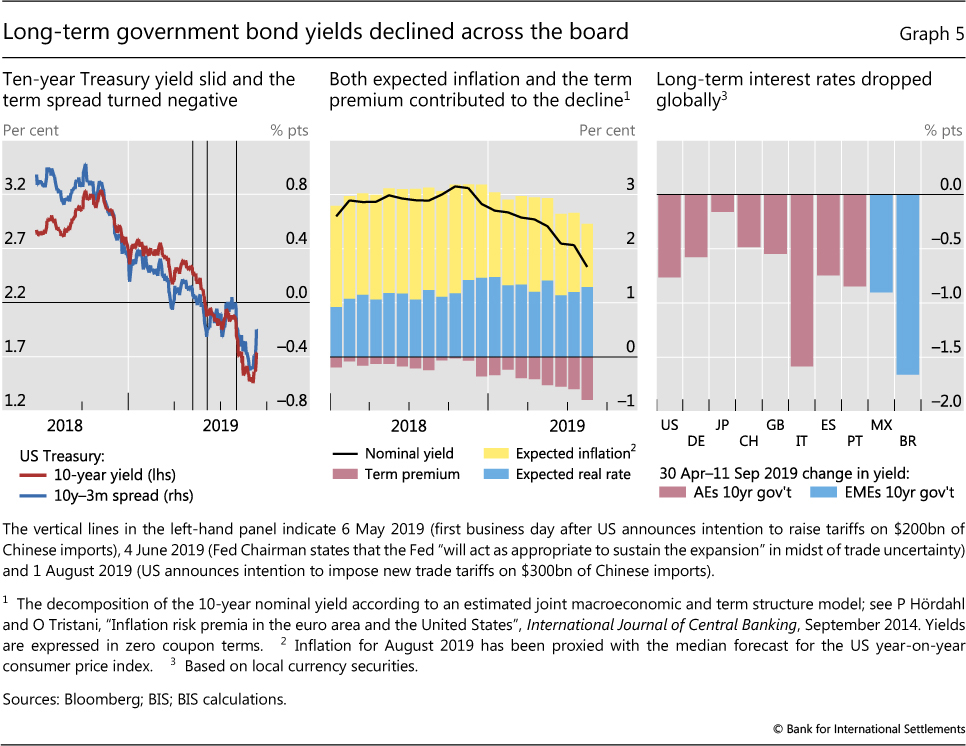
As the global easing gathered pace and trade tensions induced flight-to-safety flows, long-term yields fell across the board and in most AEs the yield curve inverted. The 10-year US Treasury yield dropped by about 80 basis points in the period under review (Graph 5, left-hand panel). The spread between 10-year and three-month Treasury yields dropped into negative territory in May and declined further as trade tensions escalated again in August before retracing part of its decline in early September. The expected real rate remained roughly unchanged, while expected inflation and, in particular, the term premium compressed noticeably (centre panel).
For Japan, 10-year yields declined about 10 basis points during the period under review and, for a number of other large AEs, yields fell by 50-100 basis points (Graph 5, right-hand panel). As a result, most AE sovereign yield curves were inverted, at least partially. Yields compressed in selected EMEs by somewhat larger amounts, although from higher levels. While US equity markets remained close to all-time highs, investor concerns mounted because yield curves typically invert ahead of recessions. As discussed in Box A, the inversion reflected an unusually compressed term premium, which complicates the evaluation of yield curve signals for future economic activity.
As interest rates declined, the amount of negative-yielding debt soared. While sovereign bond markets in the United States and the United Kingdom still offered positive yields, most tenors in Japan and the euro area dived into negative territory. In Switzerland, yields were below zero for maturities up to 30 years; and in Germany and the Netherlands, for up to 25 years. Even in countries with lingering growth and debt concerns, such as Italy, yield curves were negative at the shorter end (Graph 6, left-hand panel). Moreover, some corporate yields, and even some Danish mortgage lending rates, dipped below zero.
Box A
Yield curve inversion and recession risk
Sirio Aramonte and Dora Xia
In mid-2019, long-term interest rates fell below short-term rates in a number of countries. In the United States, the spread between 10-year and three- month Treasury rates (henceforth, 10y-3m term spread) had already turned negative in late May and fell below -50 basis points in late August. In France, Germany and the United Kingdom, parts of the yield curve also inverted. While some market participants interpreted these developments as portending an imminent slowdown, exceptionally low term premia currently confound signals from the yield curve.
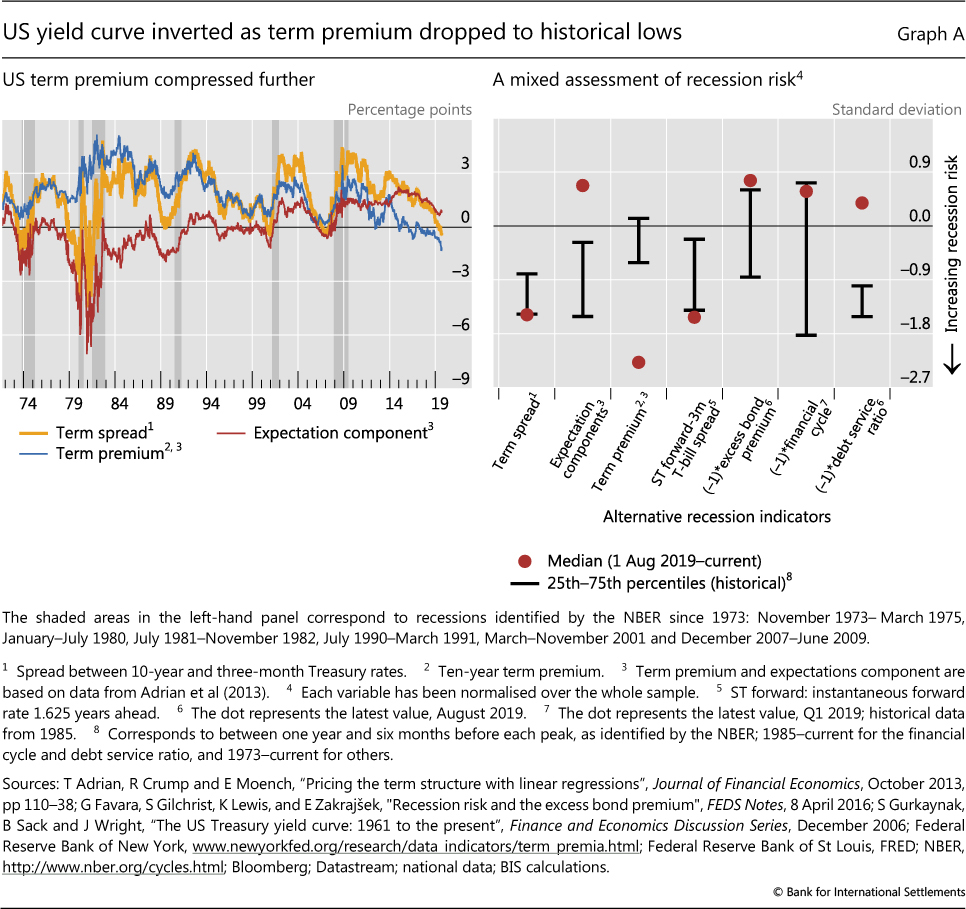
In the United States, an inverted Treasury yield curve has preceded all recessions since 1973. Each time the 10y-3m term spread turned negative during economic expansions, a recession ensued within the next two years (Graph A, left-hand panel).
A commonly cited reason for the predictive power of the 10y-3m term spread is that, when investors forecast weaker economic activity, they also anticipate more stimulative monetary policy and, in turn, lower future short-term rates. If concerns are strong enough, expected rates can be sufficiently low to push current long-term rates below current short-term rates, resulting in an inverted yield curve.
However, in addition to expectations of future short-term rates, long-term rates also reflect term premia, which can thus influence the curve's dynamics. Term premia are extra returns demanded by investors to compensate for risks associated with long-term bonds. These returns can be affected by imbalances in the supply of and demand for particular maturities, in which case they have little information about future economic prospects as such.
In fact, the recent inversion of the US Treasury curve has coincided with exceptionally subdued term premia. Term premia in the US Treasury market have been declining since the Great Financial Crisis, likely because of demand pressure from price-inelastic buyers such as central banks, pension funds and life insurers (Graph A, left-hand panel). Also, the current combination of a negative term premium and an easing monetary policy stance is unusual. During past episodes when the yield curve inverted, the monetary policy stance was tightening.
Considering such complications, it is useful to examine other indicators of recession risk. In addition to the 10y-3m term spread, the literature has identified several other measures that can signal an impending economic slowdown. For example, a low near-term forward spread, a stretched excess bond premium and elevated financial cycle measures can signal high downside risk. The right-hand panel of Graph A compares current readings for these variables with their historical distributions before past downturns (in some cases, the variables have been multiplied by -1 so that low values point to high recession risk).
The indicators we consider provide a mixed assessment of imminent downside risks to the economy. While the term premium is clearly well below typical pre-recession levels, rate expectations are currently well above. The other indicators also do not yield a clear consensus on recession risk.
A Estrella and F Mishkin, "Predicting US recessions: financial variables as leading indicators", Review of Economics and Statistics, vol 80, no 1, February 1998, pp 45-61, formally establish the relationship between the term spread and recession risk. See B Cohen, P Hördahl and D Xia, "Term premia: models and some stylised facts", BIS Quarterly Review, September 2018, pp 79-91. See G Favara, S Gilchrist, K Lewis and E Zakrajšek, "Recession risk and the excess bond premium", FEDS Notes, 8 April 2016; E Engstrom and S Sharpe, "The near-term forward yield spread as a leading indicator: a less distorted mirror", Finance and Economics Discussion Series, 2018-055; and C Borio, M Drehmann and D Xia, "The financial cycle and recession risk", BIS Quarterly Review, December 2018, pp 59-71.
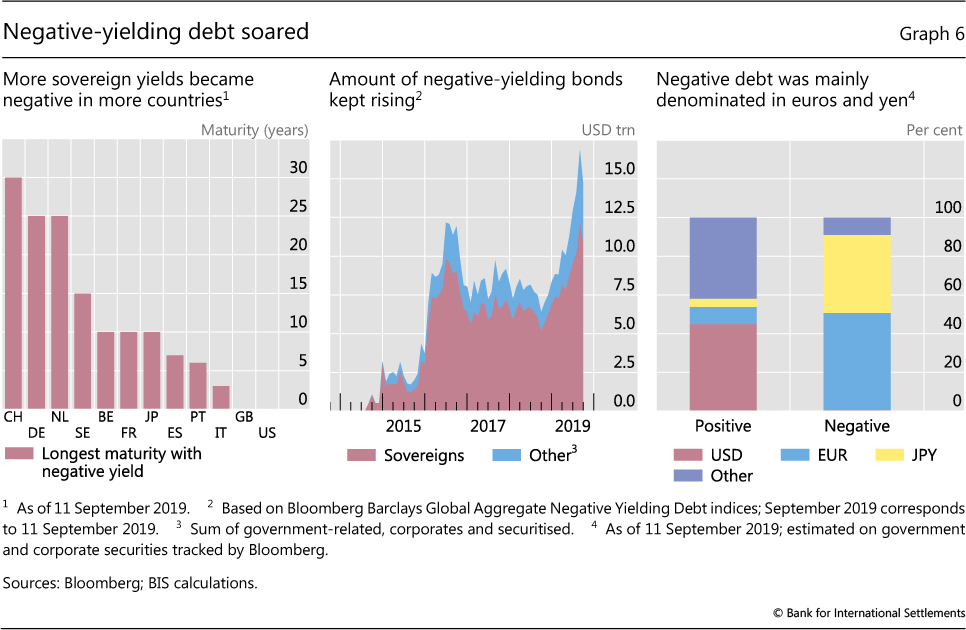
The pervasiveness and amount of negative-yielding debt this time around greatly exceeded that in 2016, when negative yields were mainly limited to sovereign bonds with shorter maturities. From almost nothing in 2014, the amount of bonds with negative yields rose to $12 trillion in 2016 and then slowly trended down. In 2019, it rose rapidly, reaching a new high of $17 trillion in late August (Graph 6, centre panel). In mid-september, about 50% of negative-yielding bonds were denominated in euros, 40% in yen and a negligible fraction in US dollars. In contrast, more than 40% of bonds with a positive yield were denominated in US dollars (right-hand panel).
Attracted by low interest rates, borrowers continued to tap debt markets, but at a slower pace. Corporate bond issuance in the United States remained relatively steady - in particular, of investment grade debt. The widening of spreads discouraged high-yield issuance. The issuance of leveraged loan and collateralised loan obligations (CLOs) slowed relative to the previous year. One reason is that, being floating rate, leveraged loans became less attractive in the face of a more accommodative monetary outlook. Nevertheless, questions persisted about the potential financial stability risks posed by CLOs, which shared some similarities with the collateralised debt obligations that were at the centre of the GFC (Box B).
EMEs remained under pressure
Whereas for AE equities trade tensions had a larger impact in May than in August, EME equities were equally sensitive to trade news during the two sell-offs (Graph 7, left-hand panel). Corporate bond spreads behaved similarly in AEs and EMEs, widening in both May and August.
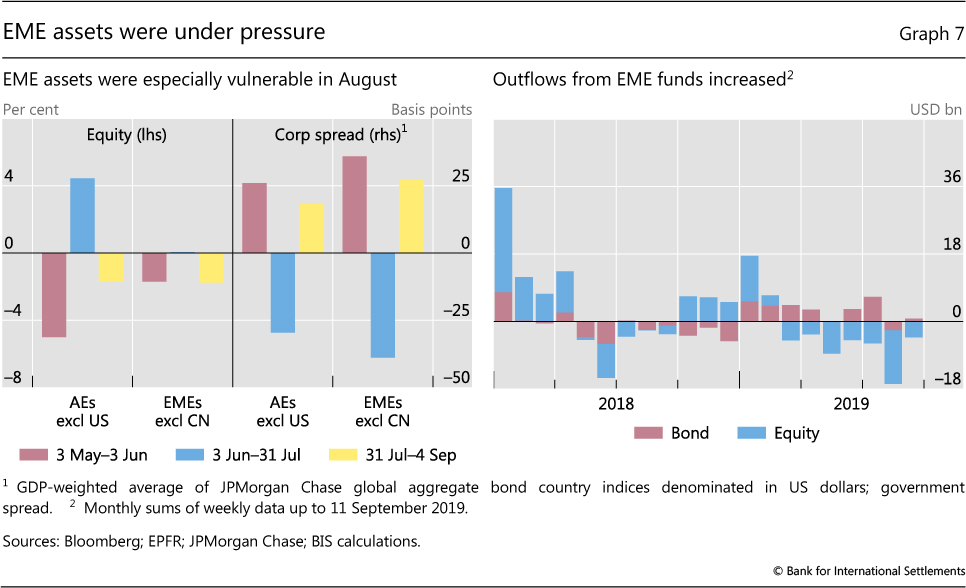
Consistent with the price dynamics of the underlying assets, outflows from EME funds gathered pace during the period under review. Equity funds had suffered sizeable and persistent outflows since the end of the first quarter, and investors withdrew assets more quickly in the third quarter (Graph 7, right-hand panel). Bond funds had seen volatile but still positive flows throughout 2019, but in August recorded small outflows. A turn in investor sentiment prompted correlated outflows in August, in conjunction with equity losses and corporate spread increases.
As sentiment towards EME assets soured, EME currencies depreciated sharply against the US dollar. The trade-weighted US dollar index was relatively stable between May and July, and then gained 4% against major EME currencies in August. The renminbi breached the symbolic threshold of 7 against the US dollar and dropped to its lowest level since the GFC (Graph 8, first panel). The renminbi was highly correlated with other Asian and Latin American currencies, more so than in previous episodes of stress (second panel). This highlighted the potential for contagion from slower growth in China and recurring bouts of trade tensions. Idiosyncratic developments worsened currency depreciation for some countries, in particular increased political uncertainty in Argentina.
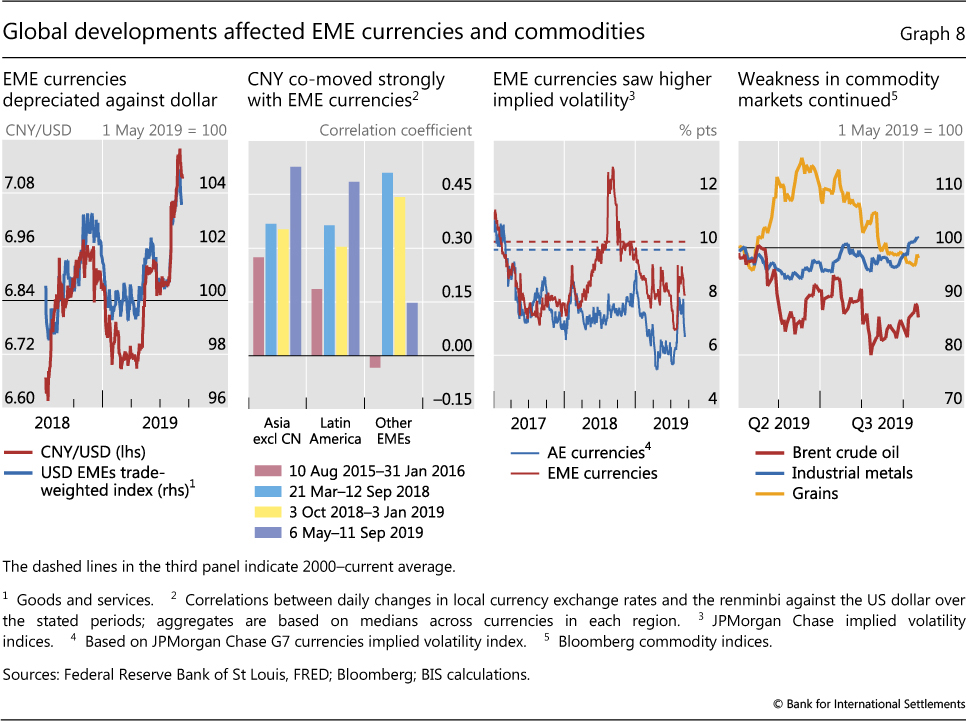
On the back of hefty depreciation of EME currencies, implied volatility in foreign exchange markets rose, albeit to levels still below their long-term average (Graph 8, third panel). The implied volatilities of EME currencies had moved in virtual lockstep with those of AE currencies until early 2018, when trade tensions between China and the United States surfaced in full force. The gap between the implied volatility of AE and EME currencies narrowed in mid-2019 but remained fairly notable relative to 2017, before trade tensions took centre stage.
Against an unsettled outlook for economic growth and trade, prices for selected commodities slid. Oil prices declined through early August, despite simmering geopolitical risk linked to developments in Iran. Grain prices also fell during the period under review, while industrial metal prices were roughly stable (Graph 8, fourth panel).
Box B
Structured finance then and now: a comparison of CDOs and CLOs
Sirio Aramonte and Fernando Avalos
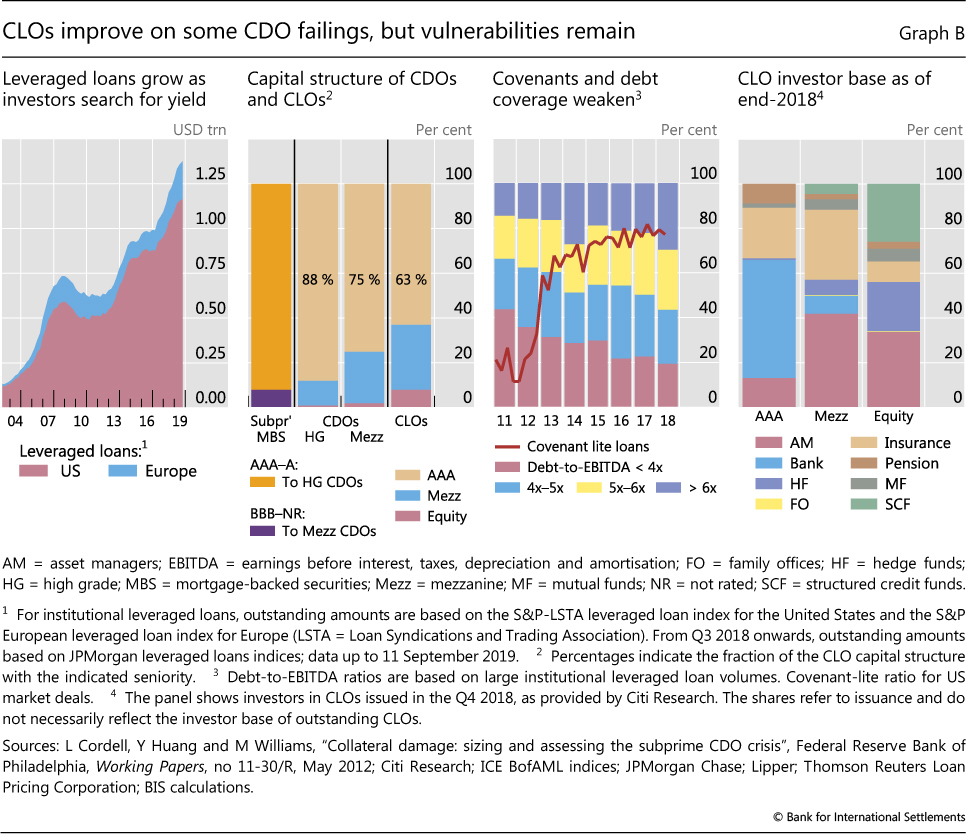
Collateralised debt obligations (CDOs) that invested in subprime mortgage-backed securities (MBS) were at the centre of the Great Financial Crisis (GFC). The issuance of subprime CDOs ceased after the GFC, but other forms of securitisation have grown substantially - in particular, collateralised loan obligations (CLOs). CLOs invest mainly in leveraged loans, ie bank loans to firms that are highly indebted, have high debt service costs relative to earnings and are typically rated below investment grade. The leveraged loan market has surged in recent years to roughly $1.4 trillion outstanding, of which about $200 billion is denominated in euros and the rest in US dollars (Graph B, first panel). This rapid expansion has been accompanied by the securitisation of leveraged loans into CLOs. As of June 2019, over 50% of outstanding leveraged loans in US dollars and about 60% of those in euros had been securitised through CLOs.
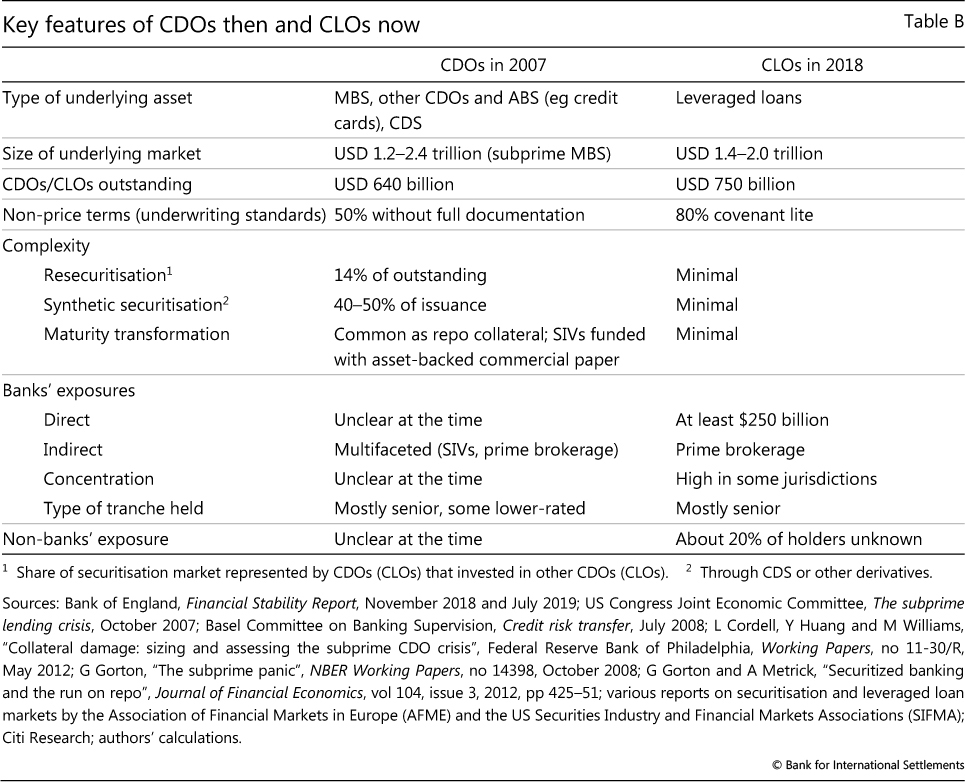
The rapid growth of leveraged finance and CLOs has parallels with developments in the US subprime mortgage market and CDOs during the run-up to the GFC. We examine the CLO market in light of that earlier experience. There are significant differences between the CLO market today and the CDO market prior to the GFC: CLOs are less complex, avoiding the use of credit default swaps (CDS) and resecuritisations; they are little used as collateral in repo transactions; and they are less commonly funded by short-term borrowing than was the case for CDOs. In addition, there is better information about the direct exposures of banks. That said, there are also similarities between the CLO market today and the CDO market then, including some that could give rise to financial distress. These include the deteriorating credit quality of CLOs' underlying assets; the opacity of indirect exposures; the high concentration of banks' direct holdings; and the uncertain resilience of senior tranches, which depend crucially on the correlation of losses among underlying loans. Table B contrasts the key features of the CDO and CLO markets, which are further elaborated below.
Complexity
CDOs and CLOs are asset-backed securities (ABS) that invest in pools of illiquid assets and convert them into marketable securities. They are structured in tranches, which have different priorities in terms of the cash flows from the underlying assets. The most junior or so-called equity tranche is often unrated and earns the highest yields, but is the first to absorb credit losses. The most senior tranche, which is often rated AAA, receives the lowest yields but is the last to absorb losses. In between are mezzanine tranches, usually rated from BB to AA, which start to absorb credit losses once the equity tranche is wiped out. The larger the share of junior tranches in the capital structure of the pool, the more protected the senior tranche (for a given level of portfolio credit risk).
CLOs are backed by simpler, more diversified pools of collateral than CDOs. CDOs issued in the run-up to the GFC consisted mainly of subprime MBS, and CDOs backed by other CDOs (so called CDO squared) were common. In 2006, almost 70% of the collateral of newly issued CDOs corresponded to subprime MBS, and a further 15% was backed by other CDOs. Furthermore, more than 40% of the collateral gathered by the CDOs issued that year was not cash MBS, but CDS written on such securities. When conditions in the housing market turned, the complexity and opacity of CDOs amplified financial stress. In contrast, CLOs are much less complex. Their collateral is diversified across firms and sectors, and the known incidence of synthetic collateral or resecuritisations is minimal.
Default risk and loss correlation risk
Senior CLO tranches currently appear to benefit from larger loss-absorbing cushions than existed for CDOs. Equity and, in particular, mezzanine tranches make up larger shares of the capital structure of CLOs than they did for pre-crisis subprime CDOs (Graph B, second panel). However, the actual protection afforded to senior tranches depends crucially on their sensitivity to default risk and, importantly, loss correlation risk.
Default risk and losses-given-default depend on the quality of the underlying assets. For both CDOs and CLOs, strong investor demand led to a deterioration in underwriting standards. For example, US subprime mortgages without full documentation of borrowers' income increased from about 28% in 2001 to more than 50% in 2006. Likewise, leveraged loans without maintenance covenants increased from 20% in 2012 to 80% in 2018 (Graph B, third panel). In recent years, the share of low-rated (B-) leveraged loans in CLOs has nearly doubled to 18%, and the debt- to-earnings ratio of leveraged borrowers has risen steadily. Weak underwriting standards reduce the likelihood of defaults in the short run but increase the potential credit losses when a default eventually occurs.
For CDOs, losses were exacerbated by the sensitivity of the structures to correlation risk. The underlying collateral was poorly diversified, disproportionally consisting of low-rated tranches of subprime MBS (BBB and lower). Such strong demand for low-rated MBS led to a growing reliance on synthetic exposures through CDS and resecuritisation through CDO-squared vehicles, as discussed above. As a result, a large share of CDO payoffs were driven by a relatively small outstanding supply of low-quality securities. When housing prices fell and defaults on subprime mortgages mounted, returns on CDO mezzanine and senior tranches proved to be more highly correlated with the losses on equity tranches than many investors had expected.
Uncertainty about loss correlations is less acute for CLOs, yet remains a risk. Given the relative simplicity of these vehicles and the long history of defaults on high-yield corporate debt, loss correlations for leveraged loans (and thus CLOs) can in principle be estimated with more confidence than for subprime mortgages. However, the unusually high share of deals with low investor protection could materially affect the timing and clustering of defaults, compromising the reliability of these estimations.
Banks' exposure
When CDOs experienced losses, the eventual distress was worsened by opacity about banks' total exposures. Pre-crisis, banks retained mostly senior exposures, either directly or through structured investment vehicles (SIVs), off-balance sheet entities where banks collected exposure to CDOs, and other securitised products. Sometimes, as investor demand for CDO mezzanine tranches swelled, banks ended up holding the senior tranches for which there was less demand. In other cases, banks became exposed to subprime BBB risk, as they "warehoused" the securities while the portfolio of MBS tranches was gathered by CDO managers. The SIVs, purportedly separate from their sponsoring banks, engaged in maturity transformation by funding themselves mainly in the short-term wholesale markets, making themselves susceptible to liquidity runs. Banks' indirect exposure through SIVs was underestimated by investors at the time, and banks' total exposure to CDOs before the GFC was hard to gauge accurately.
Currently, banks' exposure to CLOs is less opaque. Banks still hold mostly AAA tranches (Graph B, fourth panel), but these are recognised on their balance sheets and there is no indirect exposure through SIVs. That said, banks may have other indirect exposures (see below). Moreover, among banks the concentration of CLO holdings is high. US and Japanese banks are among the largest investors. Relatively few institutions account for the majority of banks' holdings, and in some cases holdings are large relative to capital.
Spillover risks
Non-bank investors, such as hedge funds and insurance companies, are also major investors in CLOs, as they were in CDOs before the GFC. Ownership is more difficult to trace for non-bank investors than for banks. If non-bank investors were to experience losses on their CLO holdings, banks might be indirectly exposed. In particular, banks might be connected to those investors through legal and reputational ties, credit facilities or prime brokerage services. "Synthetic" prime brokerage, where hedge funds obtain leverage through derivatives with banks as counterparties, has grown rapidly in recent years. It also entails lower regulatory capital charges. Like banks' off-balance sheet exposure to CDOs, which was a source of instability in 2007, banks' prime brokerage exposure to CLO holders could result in larger losses than implied by direct exposures, creating heightened financial stress.
Additional spillovers could arise from disruptions in market liquidity. Since the GFC, assets managed by fixed income mutual funds, including bank loan funds, have increased substantially. Investment funds offering daily redemption of shares hold as much as 3% of their assets in CLOs. At times of market distress, investors may rush to redeem their shares, quickly depleting the liquidity buffers held by such funds. This rush could result in fire sales and large price volatility, imposing mark-to-market losses on other intermediaries. Price volatility could also disrupt short-term funding collateralised by CLOs, similarly to the "run on repo" in 2007. However, the use of CLOs as repo collateral appears minimal today, in contrast to the more widespread use of CDOs or MBS in the past.
See L Cordell, Y Huang and M Williams, "Collateral damage: sizing and assessing the subprime CDO crisis", Federal Reserve Bank of Philadelphia, Working Papers, no 11-30/R, May 2012. CDOs sold CDS to investors in exchange for a payment replicating the return on the insured MBS. Fitch Ratings, "Leveraged loans & CLOs in financial institutions", August 2019. Essentially, prime brokers swap with a hedge fund the return on some reference financial asset in exchange for a financing rate.
1 This overview focuses on developments between 1 May and 11 September 2019.