The growing footprint of EME banks in the international banking system
This special feature explores the role of banks from emerging market economies (EMEs) in global banking. Over the past decade, the cross-border activity of EME banks has been growing at a faster pace than that of banks from advanced economies. This has been largely driven by increasing EME-to-EME interlinkages, which often make up more than half of EMEs' cross-border borrowing. EME banks make use of their global networks of affiliates abroad for the majority of their cross-border lending to other EMEs. In the cross-border interbank market, EMEs with more developed banking systems tend to be net recipients of funds, whereas EMEs with less developed ones tend to be net providers.1
JEL classification: F34, F36, G21.
Emerging market economies (EMEs) have substantially increased their footprint in the global economy over recent decades. They now produce about 40% of global GDP at market exchange rates, and contributed about two thirds of 2017 global GDP growth.
In this special feature, we document how the growing economic importance of EMEs has gone hand in hand with a rapidly increasing presence of EME banks in global banking. We use the locational data of the BIS international banking statistics (IBS) and focus on banks' nationality, while distinguishing between the business of banks' headquarter offices and that of their affiliates abroad. As of mid-2018, the IBS data set comprises data from 47 reporting countries and covers about 95% of total cross-border claims.2 Recent increases in the number of EMEs that report to the IBS (eg China and Russia starting in 2016, and the Philippines in 2017) and recent statistical enhancements offer unique insights into EME banks' global activity.3
Key takeaways
- EME banks extend more cross-border lending through their foreign affiliates than from their headquarters. They have created global networks of affiliates that play a crucial role in lending to other EMEs.
- In many EMEs, non-banks obtain more than half of their cross-border borrowing from foreign EME banks. For several EMEs, this cross-border borrowing from EME banks exceeds 25% of their GDP. These EME interlinkages have grown rapidly in recent years and have given rise to extensive interdependencies.
- EME banks' cross-border interbank positions are substantial. Larger EMEs with more developed domestic banking systems tend to act as net borrowers, whereas smaller EMEs with less developed banking systems tend to provide cross-border funds to other banks.
Even though EME banks4 account for a relatively small fraction of aggregate global banking, the cross-border interlinkages among EME lenders and EME borrowers are substantial and growing rapidly (CGFS (2014)). The offshore networks of EME banks play a key role in their EME business. They channel about two thirds of EME-to-EME cross-border credit through affiliates located in advanced economies (AEs) and offshore financial centres (OFCs).5 Moreover, this intermediation pattern differs markedly from that of AE banks, which book most of their cross-border EME lending at their head offices.
EME banks provide substantial cross-border credit to EME borrowers, the non-bank sector in particular. For many EMEs, cross-border credit from EME banks to the non-bank sector accounts for the majority of credit from all lenders, and for more than a quarter of GDP.6 These growing interdependencies are particularly prominent in emerging Asia, Africa and the Middle East.
EME banks' cross-border interbank positions are also substantial. Major EMEs with established banking systems tend to take cross-border credit from banks on net. By contrast, smaller, less developed EMEs tend to provide substantial positive net credit to other banks.
The rest of this special feature is organised as follows. The first section describes how EME banks conduct their cross-border lending business. The second section documents the growing importance of EME-to-EME lending. The third section examines the role of EME banks as recipients or providers of funds in the cross-border interbank market. The last section concludes.
EME banks as cross-border lenders
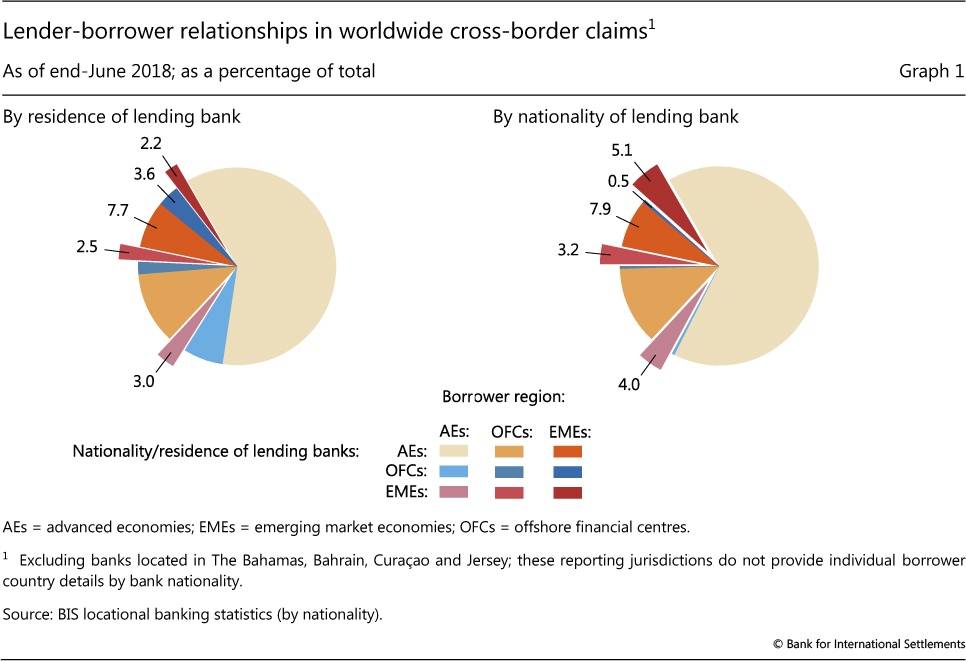
Banks headquartered in EMEs have become more prominent in global banking over the last decade. To sketch the role of EME banks in the international banking system, it is important to distinguish between the lending banks' locations and their nationalities. On a residence basis, banks in EMEs accounted for almost 8% of all global cross-border lending in mid-2018 (Graph 1, left-hand panel), up from about 1.5% in mid-2008. However, these numbers neglect the role of EME banks' network of affiliates located outside their home countries. When lending is broken down by bank nationality (the jurisdiction in which a bank's headquarters is located), EME banks accounted for more than 12% of global cross-border lending in mid-2018 (Graph 1, right-hand panel), up from about 3% in mid-2008.7
The affiliates of EME banks drive a large wedge between the two sets of figures, especially owing to the role of branches and subsidiaries in OFCs (Graph 1, blue slices in both panels). While lending to EMEs by banks headquartered in the OFCs accounts for only about 0.5% of all cross-border claims, lending to EMEs by banks (of all nationalities) located in the OFCs is equivalent to 3.6%. This reflects, at least in part, the activities of EME bank branches and subsidiaries located in those centres.
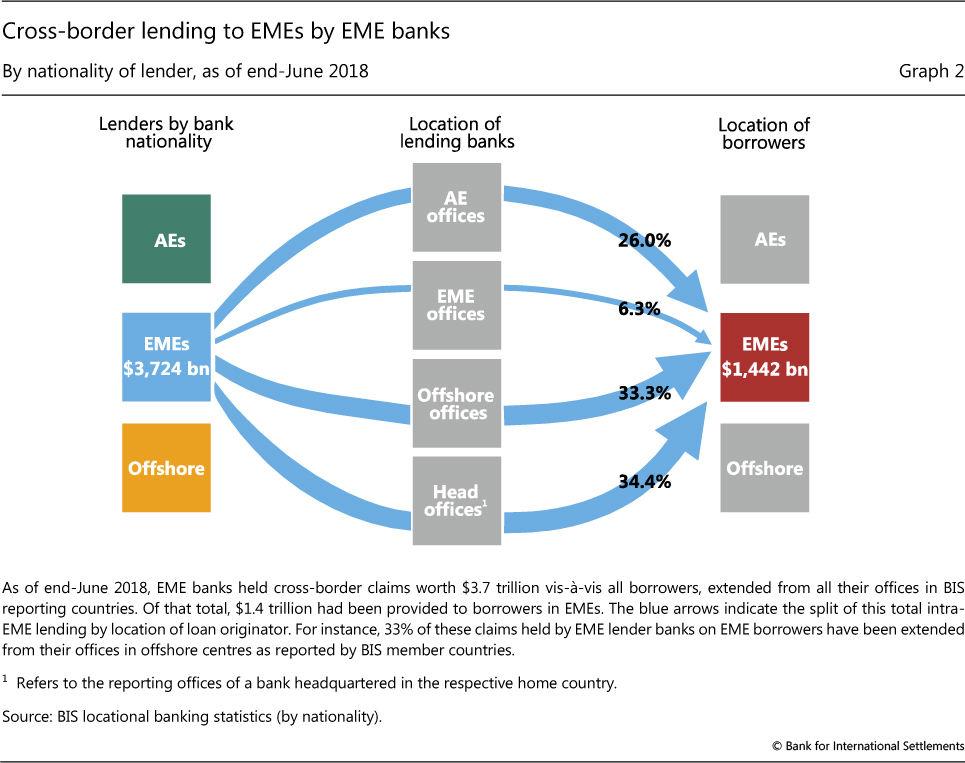
EME banks book the majority of their cross-border lending to EMEs at their foreign affiliates (Graph 2). The blue-highlighted cells in Table 1 reflect the shares of EME banks in different locations in total lending to EMEs, and correspond to the arrows in Graph 2. At end-June 2018, almost 40% (or $1,442 billion) of EME banks' total cross-border claims were loans to EMEs. Of this, two thirds (or $946 billion) was booked at foreign affiliates. They booked the remainder (or $496 billion) at their headquarters.
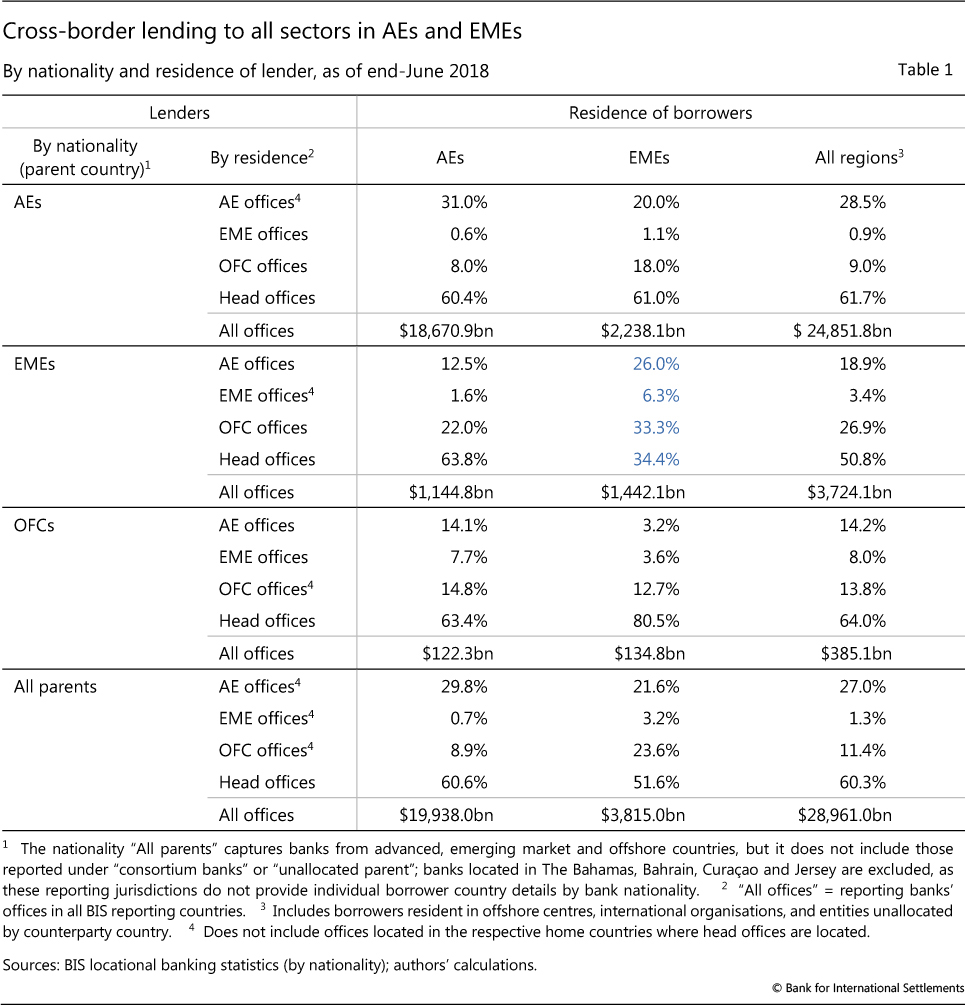
EME banks' reliance on affiliates to lend cross-border to EMEs sets them apart from their AE peers. The latter extend about 60% of their total cross-border credit to EMEs directly from their head offices, almost twice the share for EME banks. By contrast, there is no such difference with respect to cross-border claims on borrowers in AE countries: both AE banks and EME banks book about 60% of their cross-border claims on AE borrowers at their headquarters.8
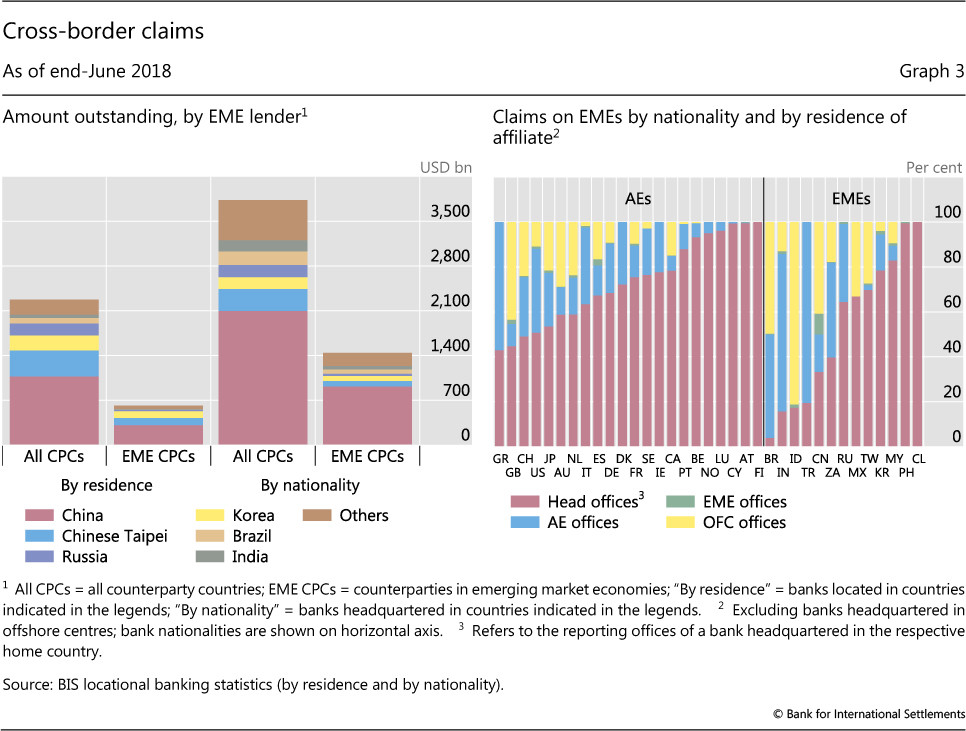
Chinese banks bulk large in EME-to-EME lending. As of end-June 2018, they reported cross-border claims worth $919 billion, or 64% of total EME-to-EME activity ($1,442 billion; Table 1 and left-hand panel of Graph 3).9, 10 The global activities of Chinese corporations and the large infrastructure projects that Chinese banks finance in the context of the Chinese government's "Belt and Road Initiative" (BRI) are likely to have contributed to the above lending volumes.11
Banks from other EMEs also make heavy use of their foreign affiliates. For seven out of 13 EME jurisdictions that report to the BIS IBS, the cross-border claims from affiliates dwarf those from head offices (Graph 3, right-hand panel).12 For example, as of end-June 2018, credit extended by Brazilian banks to other EMEs totalled $67 billion, of which only about 4%, or $3 billion, was booked in Brazil. The corresponding figure for India was $52 billion, of which just 16% was booked in India. Although smaller in overall lending volumes, Indonesian, Mexican, South African and Turkish banks exhibit similar patterns.13
The importance of EME banks for EME borrowers
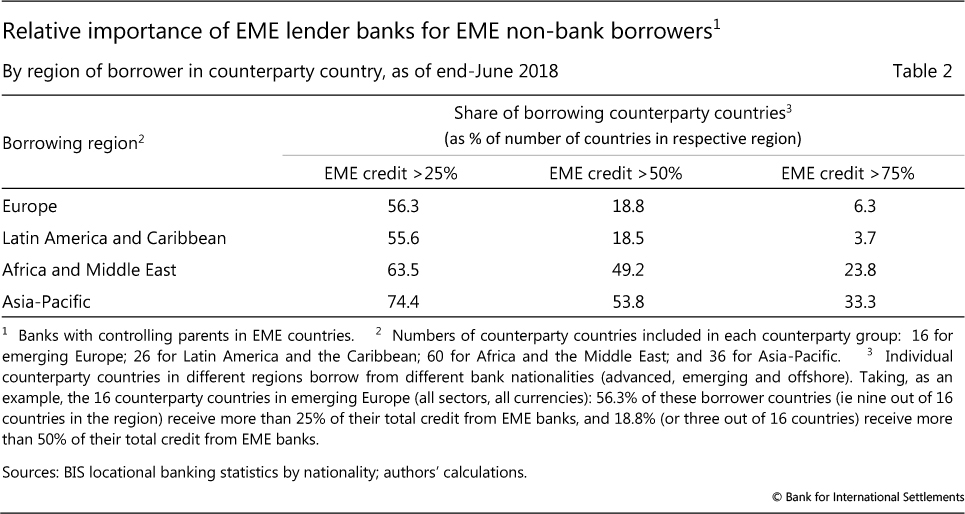
Many EME countries receive more cross-border loans from EME banks than from AE banks. The non-bank sector drives this heavy dependence of EME borrowers on EME banks. Table 2 shows the shares of countries in each EME region whose non-bank borrowers receive more than 25%, 50% and 75%, respectively, of their cross-border borrowing from foreign EME banks.
EME banks are the major providers of cross-border credit to non-bank borrowers in developing Asia and Africa. As of end-June 2018, about half of the countries in each region obtain more than 50% of their cross-border credit from foreign EME banks. EME lender banks play lesser roles in emerging Europe and Latin America, with the corresponding shares of countries that receive more than half of their borrowing from EME banks at 13% and 15%, respectively.
EME banks take on an even larger role in dollar-denominated lending. In about 60% of African and Asian EMEs, non-banks obtain more than half of their cross-border dollar credit from foreign EME banks. And this is also the case in half of emerging European countries.
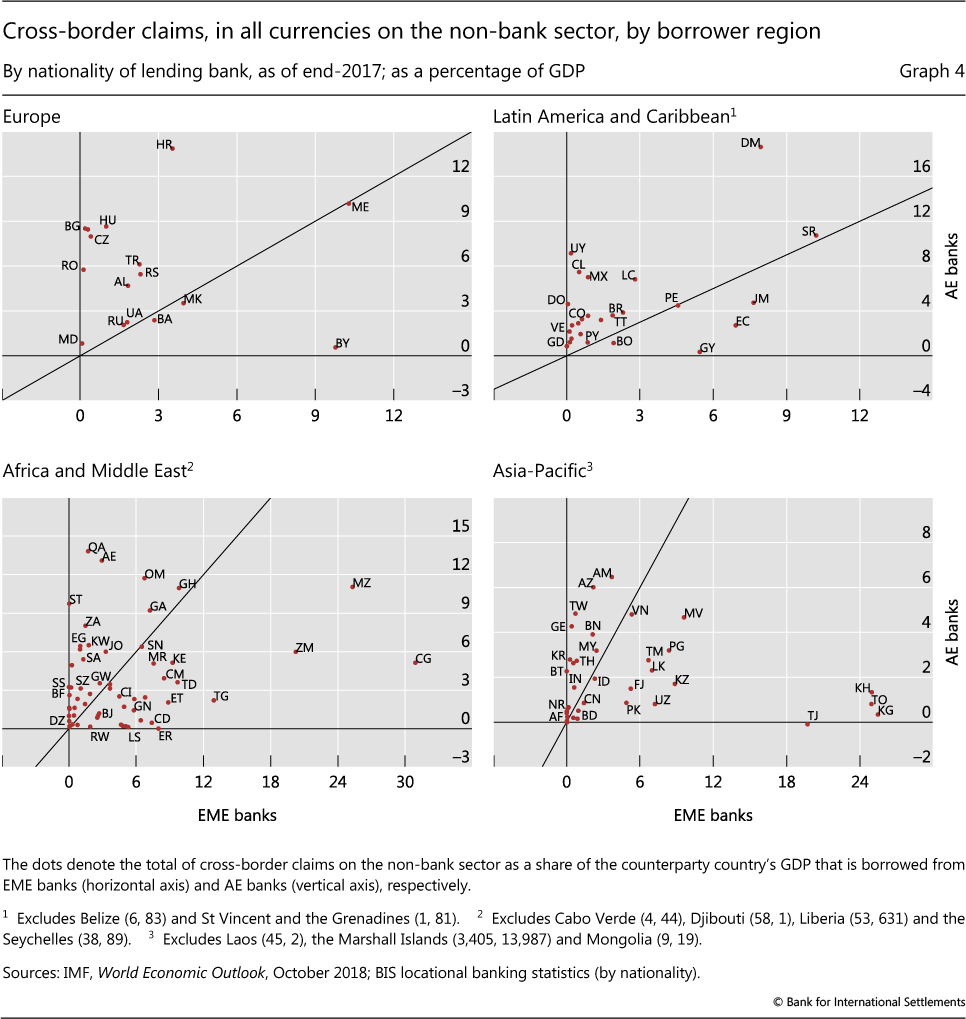
Direct cross-border borrowing from EME banks by non-banks also accounts for substantial shares of GDP. For several EMEs, the share is high, exceeding 25% of GDP in some cases. Graph 4 compares the cross-border claims of AE and EME banks on non-bank borrowers in selected EMEs. A large number of borrower countries appear below the 45° line, indicating that cross-border lending to the non-bank sector by EME banks is greater than that by AE banks. Further, EME banks tend to lend more than AE banks to non-banks in countries that already have high levels of cross-border bank debt, especially in emerging Asia.14
EME banks' cross-border interbank positions on EMEs
Next, we use data on cross-border interbank positions in order to examine the role of EMEs as net recipients or providers of funds. Net interbank positions capture the difference between cross-border claims and liabilities vis-à-vis the banking sector (excluding central banks) of a particular counterparty country. If net interbank positions are positive, more money flows into the local banking sector than out of it. Conversely, negative net interbank positions indicate that banks resident in the country place more money in banks abroad than they borrow from foreign banks.15
There are significant differences among EMEs when it comes to their cross-border interbank positions. Larger EMEs with more developed domestic banking systems tend to take funds on net. By contrast, smaller EMEs with less developed banking systems tend to provide cross-border interbank funds on net. This is the case for many countries in Africa and the Middle East (Graph 5, bottom left-hand panel).
For countries in emerging Europe, net cross-border interbank positions tend to be markedly positive. Banks in the Czech Republic obtain cross-border interbank funding worth almost 30% of the country's GDP. Banks in Serbia (7.4% of GDP), Hungary (7%) and Poland (6.3%) also act as net debtors in the cross-border interbank market.
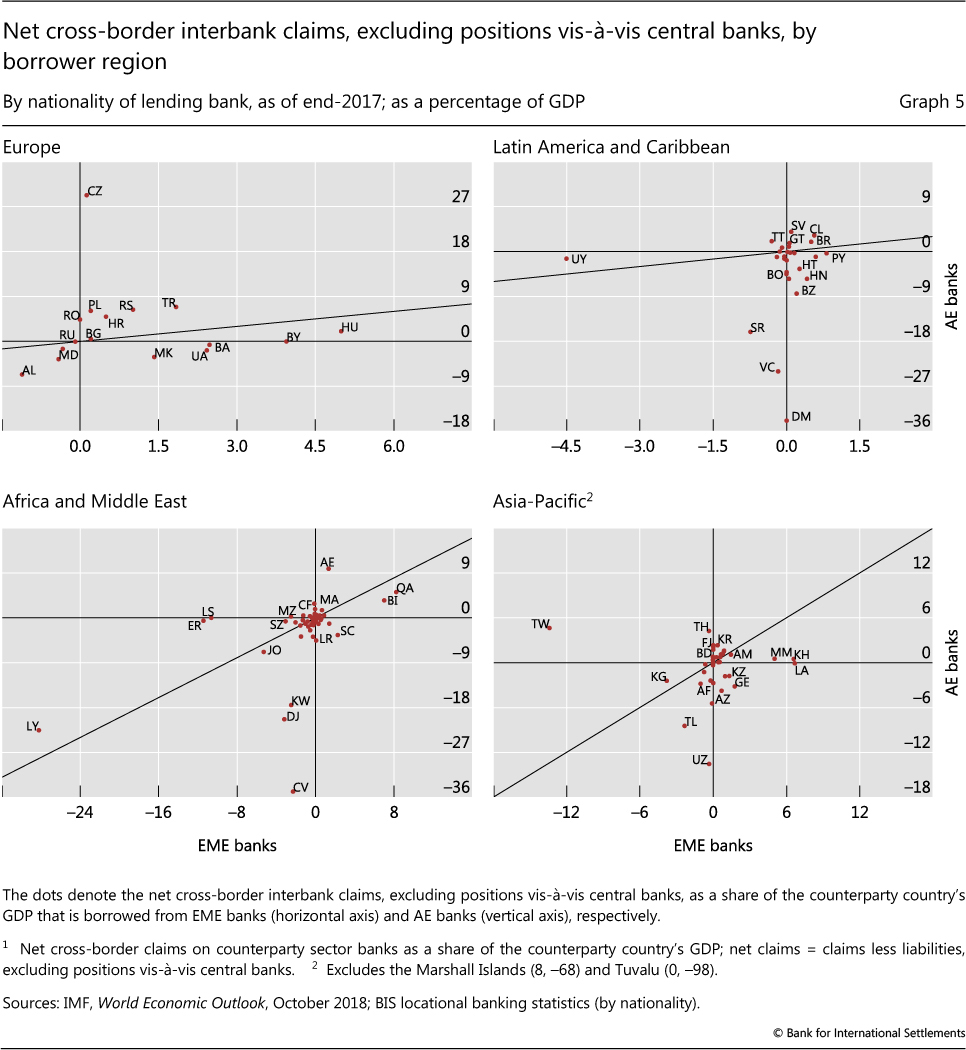
Latin America exhibits a more nuanced picture and considerably lower net interbank positions in terms of GDP, on average. Banks in Chile (3.8%), Brazil (2.5%) and Colombia (1.1%) are all net recipients of cross-border interbank funds. By contrast, banks in Uruguay (-6%), Mexico (-1.5%) and Peru (-1%) are net providers of cross-border interbank funds.
EMEs in the Asia-Pacific region exhibit similar patterns to those in Latin America. The largest economies (China, India, Indonesia, Korea, Pakistan) are net borrowers on the cross-border interbank market. Chinese Taipei and Thailand have positive net cross-border interbank balances with AE banks, and negative balances against EME banks. Interestingly, several smaller economies (Georgia, Kazakhstan, Laos, Turkmenistan and Vietnam) exhibit the exact opposite pattern: they are net recipients of cross-border funds from EME banks and net providers to AE banks.
Conclusions
This special feature has explored the role of EME banks in global banking. We have exploited the multiple breakdowns and dimensions available in the BIS IBS, including recent enhancements. Three main findings with important policy implications stand out.
First, EME-headquartered banks have created networks of foreign affiliates that play a crucial role in their cross-border lending to other EMEs. In fact, EME banks extend more cross-border lending through their affiliates abroad than from their headquarters. These intermediation patterns not only characterise the activities of Chinese banks - the largest cross-border players among EME banks - but are also shared by banks from other countries, including Brazil, India, Indonesia and Mexico. These patterns and the growing interlinkages suggest that the assessment of potential spillovers from EME banks to EME borrowers needs to consider affiliate networks and not just the positions of home offices.
Second, in terms of credit to non-bank EME borrowers, interlinkages among EMEs have grown rapidly in recent years and have given rise to extensive interdependencies. In many EME countries, non-bank borrowers obtain more than half of their cross-border loans from EME banks. This pattern is especially pronounced in emerging Asia, Africa and the Middle East. Even though the growing footprint of EME banks' cross-border lending has lessened the traditional dependence of EME borrowers on AE banks, EME interlinkages can also pose significant risks - for example, by EME banks serving as new sources of contagion and propagators of stress.
Third, EMEs display heterogeneity in their net interbank positions. In aggregate, banks in larger, more developed EMEs tend to take cross-border interbank funding on net. By contrast, banks in smaller, less developed EMEs tend to provide cross-border interbank funding on net. These differences should also be taken into consideration when mapping channels of potential spillovers from shocks in both EMEs and AEs.
References
Cerutti, E and H Zhou (2017): "The global banking network in the aftermath of the crisis: is there evidence of de-globalization?", IMF Working Papers, no 17/232.
--- (2018a): "The Chinese banking system: much more than a domestic giant", VoxEU, 9 February.
--- (2018b): "The global banking network: what is behind the increasing regionalization trend?", IMF Working Papers, no 18/46, March.
Committee on the Global Financial System (2014): "EME banking systems and regional financial integration", CGFS Papers, no 51, March.
The Economist (2018): "One belt, one road: an economic roadmap", Intelligence Unit.
Fitch (2017): "China's one belt, one road initiative brings risks".
Gopinath, G and J Stein (2018): "Trade invoicing, bank funding, and central bank reserve holdings", AEA Papers and Proceedings, vol 108.
McCauley, R, A Bénétrix, P McGuire and G von Peter (2017): "Financial deglobalisation in banking?", BIS Working Papers, no 650, June.
McGuire, P and A Van Rixtel (2012): "Shifting credit patterns in emerging Asia", BIS Quarterly Review, December, pp 17-18.
Shim, I and K Shin (2018): "Financial stress in lender countries and capital outflows from emerging market economies", BIS Working Papers, no 745, September.
1 Eugenio Cerutti is the Assistant to the Research Department Director at the International Monetary Fund (IMF). We thank Stefan Avdjiev, Claudio Borio, Stijn Claessens, Benjamin Cohen, Ingo Fender, Bryan Hardy, Robert McCauley, Benoît Mojon, Hyun Song Shin, Nikola Tarashev and Philip Wooldridge for their comments. The views expressed in this article are those of the authors and do not necessarily reflect those of the BIS or the IMF.
2 More information on the coverage of locational banking statistics is available on the BIS website at https://www.bis.org/statistics/lbs_globalcoverage.pdf.
3 The first quarter of data availability for individual reporting country can be found at https://www.bis.org/statistics/rep_countries.htm.
4 Unless stated otherwise, we refer to EME-headquartered banks as EME banks and to AE-headquartered as AE banks.
5 The BIS website (https://www.bis.org/statistics/dsd_lbs.pdf) provides more information on the locational banking statistics and it lists the set of countries defined as AEs, EMEs and OFCs. For this special feature, we excluded The Bahamas, Bahrain, Curaçao and Jersey in relevant tables/graphs from the list of OFCs, as these jurisdictions do not provide individual borrower country details by bank nationality.
6 Previous research has found that having a diversified set of both EME and AE lender banks can reduce spillover effects originating from lender countries (Shim and Shin (2018)).
7 See CGFS (2014) for further discussion.
8 When a different classification is applied to the countries included in Table 1, our findings do not change. For example, if we follow the IMF classification and count banks headquartered in Chinese Taipei, Hong Kong SAR, Korea, Macao SAR and Singapore as AE banks, the average shares of lending from home offices are still very similar.
9 Chinese cross-border claims fall to $312 billion when lending is measured on a residence basis (Graph 3, left-hand panel, second bar). This points to the significant role that Chinese banks' offshore affiliates play in their overall lending activity, relative to the very small amount of cross-border lending undertaken by non-Chinese banks located in China. McGuire and Van Rixtel's (2012) analysis of cross-border lending in emerging Asia, which combined BIS data with other sources (eg Bankscope), highlighted the hub function of Hong Kong SAR for Chinese banks. The BIS data's new breakdowns help us to shed further light on this intermediation structure.
10 These figures confirm and shed further light on the findings of other studies, based on more limited data, that have pointed to the growing footprint of Chinese banks (eg McGuire and Van Rixtel (2012), Cerutti and Zhou (2018a)).
11 See Fitch (2017) or The Economist (2018) for an analysis of the link between BRI projects and Chinese banks.
12 Our findings hold, not only if we drop Chinese banks and banks in China as lenders, but also if we exclude China from the set of EME borrowing countries.
13 Non-Chinese EME banks' operations are also drivers of regional financial integration among EMEs; see CGFS (2014), McCauley et al (2017) and Cerutti and Zhou (2017, 2018b).
14 When the total cross-border borrowing of a country is regressed on the share of lending that comes from EME banks, the coefficient on the EME share is positive and statistically significant. (Results are available on request.)
15 Gopinath and Stein (2018) link the role of dollar deposits to the dollar as the predominant invoicing currency of EMEs' imports, thereby influencing the funding structure of banking systems and the currency compositions of central banks' reserve holdings.