A paradigm shift in markets?
Global bond yields have continued to rise markedly in recent months. After core fixed income markets had plumbed new historical depths this summer, overall yields had jumped sharply by the end of November - in fact by a magnitude similar to that of the taper tantrum of May-September 2013. But despite record high duration risk, there were few signs of stress in credit markets as spreads remained tight and volatility was contained.
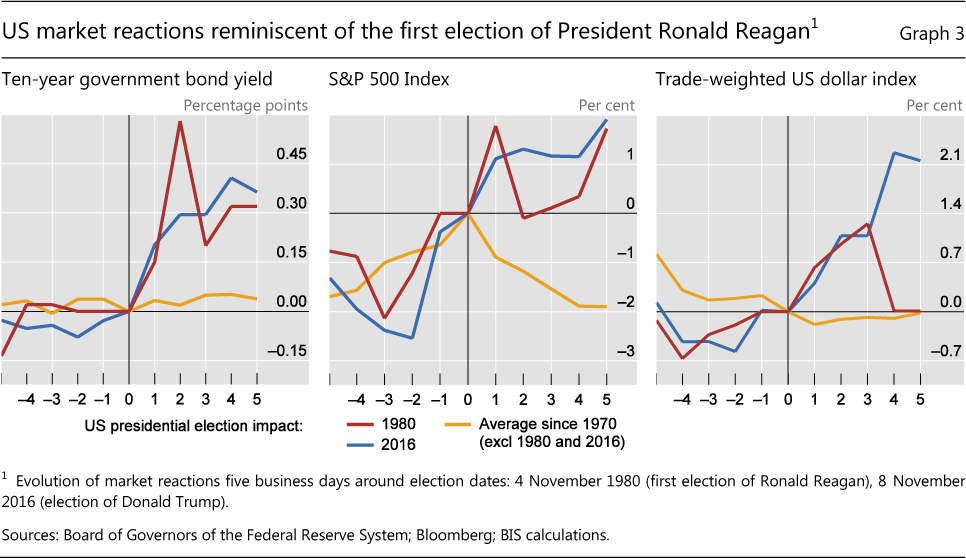
Initially supported by positive macroeconomic news globally, the rise in yields sharply accelerated after the US presidential election. Bond market reactions around election day resembled those surrounding the first election of Ronald Reagan in 1980. Buoyant US equity markets also echoed that distant event, suggesting that markets expected a boom in the United States and higher corporate profits on an anticipated shift towards more expansionary fiscal policy, lower taxes and laxer regulation. Accordingly, market odds of tighter monetary policy increased in the United States and the dollar strengthened.
The global rise in yields and the strengthening of the dollar weighed on the assets of emerging market economies (EMEs). Until early November, EMEs were unscathed by developments in advanced economies. Then, investor sentiment shifted markedly. Bond outflows and exchange rate depreciation in the post-election week were even larger than at the height of the taper tantrum.
However, credit and equity market reactions in EMEs were more muted than in 2013, possibly reflecting a different economic and financial backdrop. EME funds had already experienced large outflows instead of steady inflows in recent years, defusing pressures on asset valuations. A prospective boom in the United States may also have been seen to benefit EMEs. Yet risks remain, in particular given a high degree of political uncertainty in several key jurisdictions. In addition, 10% of EMEs' dollar-denominated corporate debt is scheduled to mature in 2017, which could put further pressure on EME financial markets.
Short-term dollar funding rates rose significantly, mainly in response to changes in regulations pertaining to prime money market funds that took effect in October. A 70% decline in assets under management by these funds since October 2015, combined with a shift in their portfolios towards shorter maturities, led to a substantial widening of Libor-OIS spreads. But this did not cause any major disruption, in contrast to earlier periods of similar spread widening.
Markets resilient amid major change in outlook
In the weeks leading up to the US election, markets continued their recovery from the financial shock triggered by the UK Brexit vote on the back of a string of positive macroeconomic news. Volatility was at or below historical averages (Graph 1, left-hand panel). Equities held up well (Graph 1, centre panel), and credit spreads remained tight. Bond yields in advanced economies kept edging higher following their record lows in the summer. Market developments reflected better than expected third quarter GDP growth in advanced economies, and the release of manufacturing purchasing managers' indices - a leading indicator of growth - signalling an economic expansion in most countries.
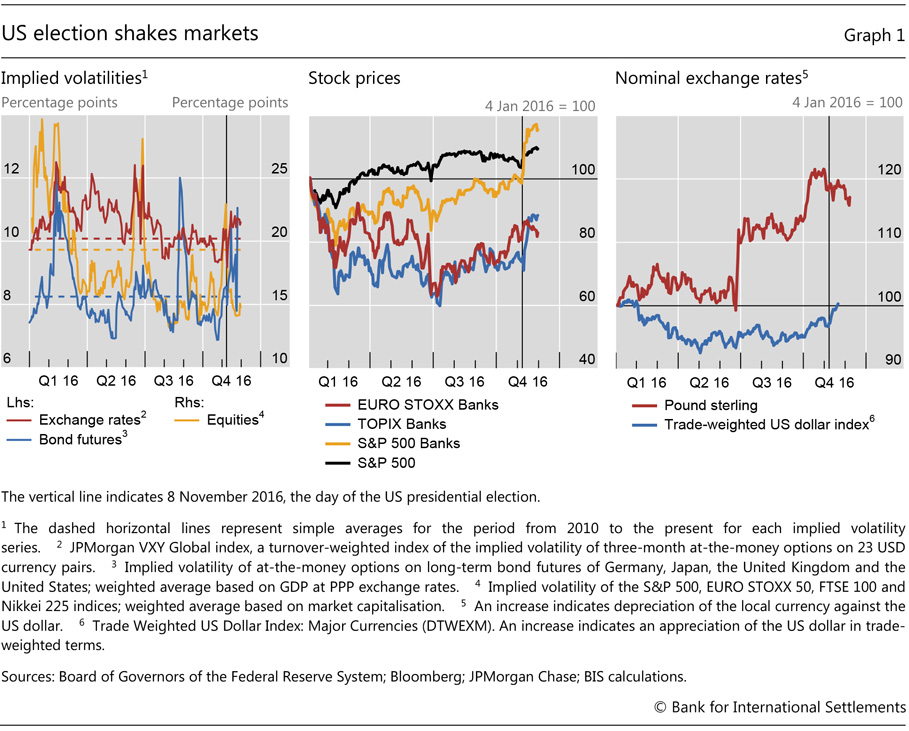
At the beginning of October, growing expectations of a "hard" Brexit exerted renewed depreciation pressure on the pound sterling (Graph 1, right-hand panel), although this did not reverberate much through financial markets globally. Even a "flash crash" on 7 October, when, within a few seconds, 9% vis-à-vis the US dollar before quickly recovering, propagated few ripples in the wider marketplace.
On 8 November, markets swung wildly as they were caught off guard by a political outcome for the second time this year. As the surprise result of the US election crystallised during election night, S&P 500 futures plunged as much as 6%, 10-year Treasury yields declined by almost 20 basis points, and the dollar weakened by 2% against a basket of currencies (Graph 2, left-hand panel). These initial moves amounted to approximately five standard deviations of daily price changes. However, they were more than reversed within a few hours as market participants revised their views on the impact of the likely shift in US economic policy and as the president-elect gave a conciliatory acceptance speech.
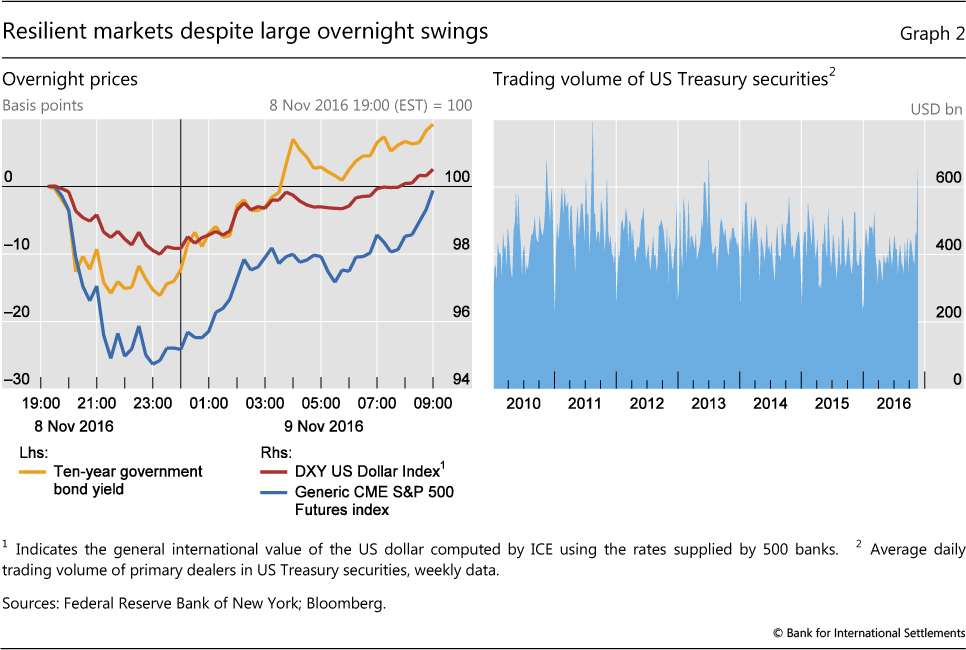
Market functioning proved resilient despite large price moves overnight and over the following days. Market liquidity remained adequate. The trading volume of US Treasuries increased and was above its long-run average (Graph 2, right-hand panel). Similarly to what happened post-Brexit, volatilities in both equity and bond markets returned within a few days to levels that had prevailed before the event.
In the first few days after the election, markets turned abruptly. Both US equity and bond yields climbed higher, mirroring dynamics observed around the election of Ronald Reagan in 1980 (Graph 3). This suggested that markets priced in faster growth and higher corporate profits in the United States on an anticipated shift towards more expansionary fiscal policy, lower taxes and laxer regulation. In particular, campaign pledges to launch a $1 trillion fiscal stimulus package - equivalent to around 5% of US GDP - and to cut personal and corporate taxes were reaffirmed, although the details of those plans remained unclear. As a result of the positive mood, US stock indices scaled record highs by late November (Graph 1, centre panel).
In anticipation of a relaxation of banking regulation and of higher interest rates, US bank stocks outperformed the buoyant market (Graph 1, centre panel). Those stocks were boosted across the board by the prospect of a cyclical upswing and higher net interest margins. The rally was strongly supported by expectations that the Dodd-Frank Act - the cornerstone of enhanced US financial regulation after the Great Financial Crisis (GFC) - would be weakened. Japanese bank stocks benefited from the uplifted mood, while stocks of their European counterparts remained broadly flat.
Bond markets sell off
The sharp pickup in yields after the US election accentuated a trend that had been under way since the middle of the year (Graph 4, first panel). Before 8 November, 10-year Treasury yields had already gained nearly 50 basis points from their historical lows of the beginning of July. Yields jumped by a further 20 basis points in response to the election outcome. This was the largest one-day yield change since the taper tantrum, and was greater than all but 1% of one-day movements in this yield over the last 25 years. And yields rose further to gain in total nearly 100 basis points since the summer - a similar change to that seen during the taper tantrum.
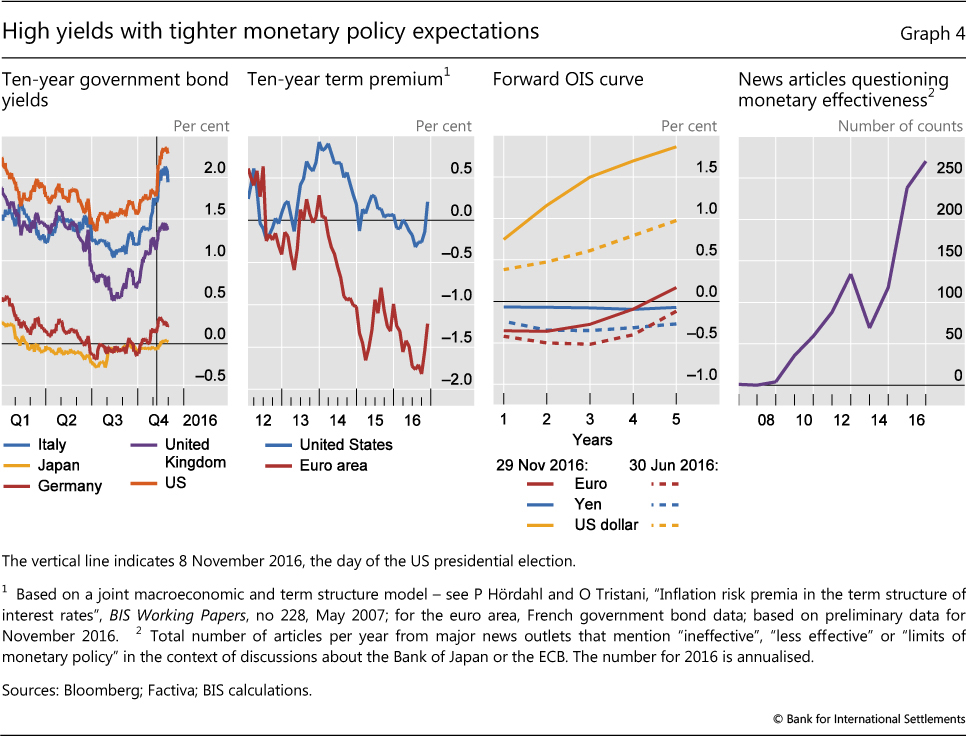
Both expectations of tighter monetary policy and higher term premia contributed to the increase in yields (Graph 4, second panel). The market- implied probability that the Federal Reserve would raise rates in December rose from just above 50% at the beginning of the quarter to nearly 100% by the end of November. The market also saw a slightly less gradual pace of tightening, even though it remained below the path implied by forecasts of the members of the Federal Open Market Committee and would continue to be slow by historical standards (Graph 4, third panel). In addition, a marked repricing of term premia played a significant role. The shift in sentiment in November brought term premia into positive territory, albeit at still very depressed levels.
With the exception of Japan, government bond yields in major advanced economies mirrored the dynamics of US Treasury yields (Graph 4, first panel). Recovering from their historical lows in the summer, they saw similar increases to those of the taper tantrum. By mid-November, 10-year UK gilts had made up all the ground lost after the Brexit vote. Similarly, euro area 10-year government bond yields increased on average by around 50 basis points. As in the United States, both monetary policy expectations and term premia rose. Japan's 10-year bond yields, on the other hand, fell somewhat after 21 September, when the Bank of Japan announced its new "yield curve control" policy, before returning to positive territory in November.
Apart from the direct spillovers from the US Treasury market, another factor behind the rise of government bond yields in Japan and the euro area was waning expectations of further monetary easing (Graph 4, third panel). This reflected the improved macroeconomic backdrop as well as political and economic headwinds to further easing. In recent years, market commentators have increasingly raised questions about the effectiveness of monetary policy (Graph 4, fourth panel). Concerns have also arisen about the potentially harmful consequences of low or negative rates for the financial sector. In addition, some analysts have questioned whether a scarcity of eligible securities may at some point reduce the ability of central banks to maintain their bond purchase programmes.
Yield spreads among euro area government bonds also widened. The markets of France, Italy, Portugal and Spain were the most affected, with spreads vis-à-vis the German 10-year bund rising by 30-60 basis points from the summer until end- November (Graph 5, left-hand panel). Increased political uncertainty seems to have been one driver, as both Italy and France will go to the polls in the coming months. The outcome of the Italian referendum on 4 December added further political and economic uncertainty to the outlook.
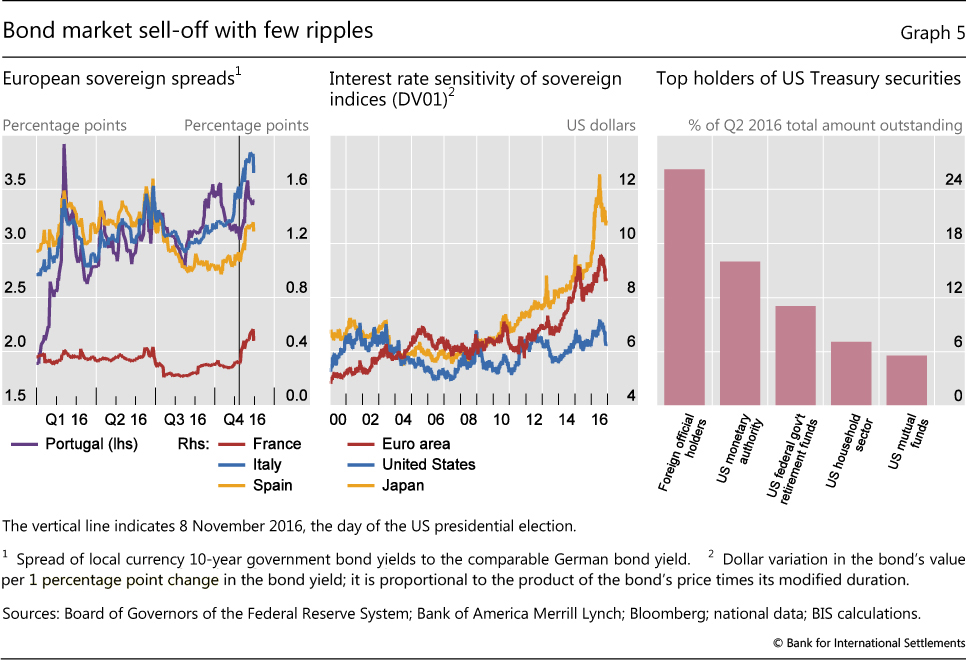
Markets in advanced economies adjusted in an orderly fashion to the rapid increase in yields despite record high duration risk. While bond portfolios stayed very vulnerable to interest rate changes as measured by duration (Graph 5, centre panel), corporate credit spreads remained tight in contrast to the taper tantrum. From July to November, spreads in the United States actually narrowed, with end-November levels almost at their year low. Corporate spreads in the euro area widened slightly. However, they were still 20% lower than after the Brexit vote. In addition, the volatility of bond markets remained well contained (Graph 1, left-hand panel).
The limited market impact of higher yields may in part have reflected the capacity of major holders of government bonds to bear mark-to-market losses (Graph 5, right-hand panel) as well as limited evidence of negative feedback loops through hedging activities. For instance, around 40% of US Treasuries are owned by the Federal Reserve and the foreign official sector. Pension funds (the third largest holders of Treasuries) and insurance companies may even benefit from rising rates in the medium term, as a normalised yield environment would allow them to more easily meet promised returns. However, valuation losses in the short run may affect profits and capital depending on accounting standards. In addition, the hedging activities of the US government-sponsored enterprises (GSEs), which contributed to the bond market turbulence of 1994, are much lower now. This is because, as part of quantitative easing policies, GSEs sold a large share of their portfolios to the Federal Reserve, which does not hedge its securities.1
Emerging market economies under pressure
Emerging market economies experienced a substantial swing in investor sentiment in the aftermath of the US election. Until the end of October, EMEs had been largely unaffected by rising yields in advanced economies. EME equity markets had remained flat and exchange rates stable, while credit spreads had fallen by around 80 basis points since mid-year. At the same time, EME bond and equity funds had increased assets under management by more than $50 billion after inflows had sharply picked up at the beginning of July. Debt securities issuance by EME borrowers had also continued at a steady pace in the second and third quarters.2 After the US election, EME currencies fell, credit spreads widened and stock markets declined.
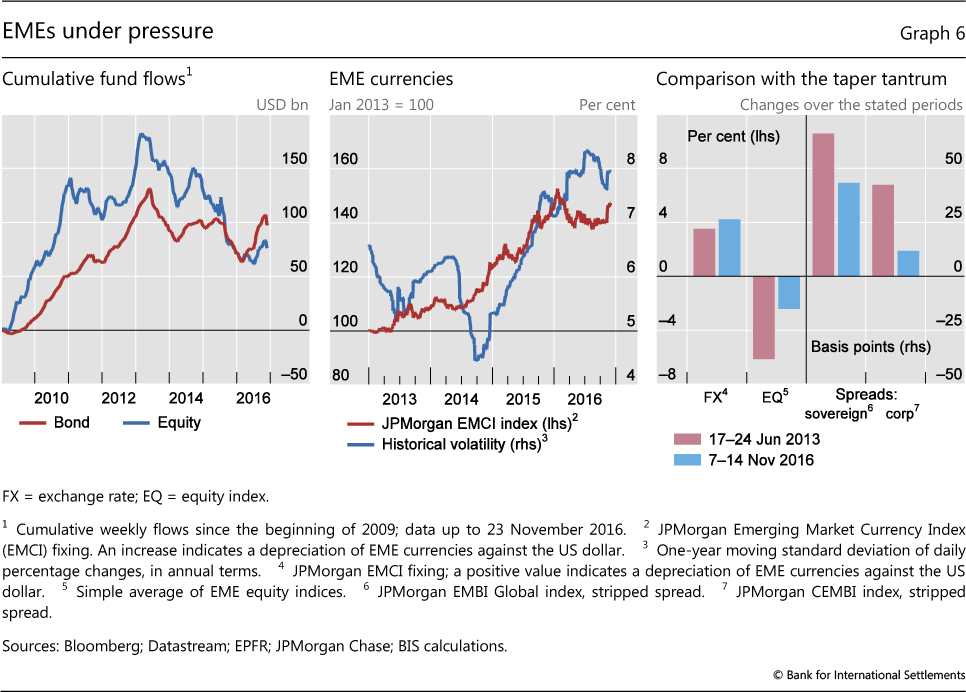
EME exchange rate depreciations and bond outflows in mid-November were even larger than at the height of the taper tantrum. EMEs experienced the largest recorded weekly outflows from bond funds in the week after the US election (Graph 6, left-hand panel). Equity market investors also withdrew large amounts from funds (same panel). In line with the large outflows, EME exchange rates reacted more sharply than in the worst week of the taper tantrum (right-hand panel).
The exchange rate fluctuations occurred on the back of much higher FX volatility and a stronger dollar than in 2013. Compared with the post-financial crisis low at the onset of the taper tantrum, EME currency volatility was already 40% higher at the end of the third quarter of this year (Graph 6, centre panel). Over the last two years, volatility had increased steadily alongside a stronger dollar. From May 2014 to its peak in January 2016, the dollar had appreciated by more than 40% against a basket of EME currencies.
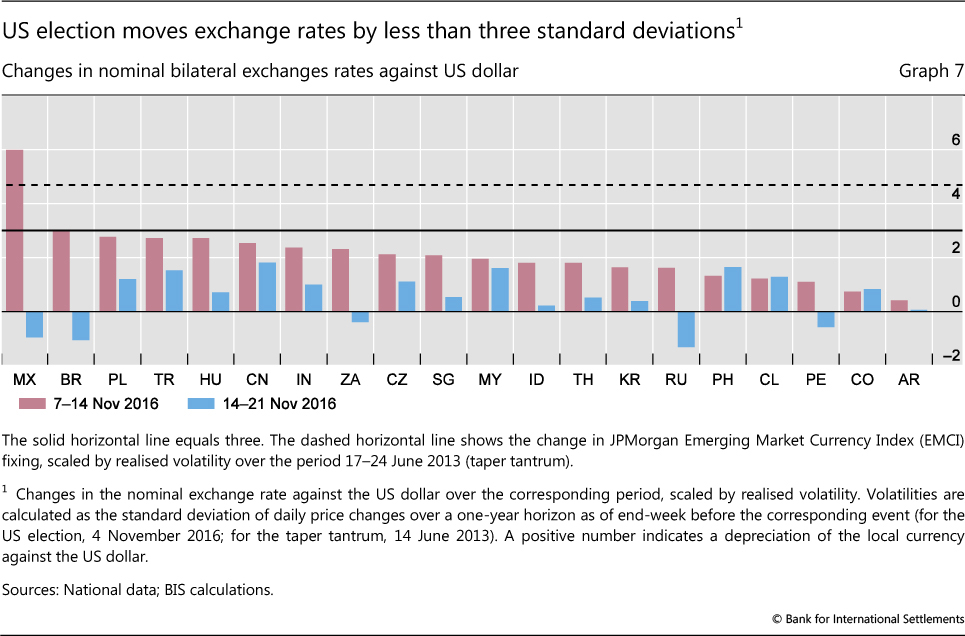
The post-election exchange rate movements were large but not extreme once this increase in overall market volatility is taken into account. For all EMEs except Mexico, the one-week change around the US election was less than three standard deviations of weekly changes (Graph 7), substantially lower than the more than 4.5 standard deviation move of June 2013 - the height of the taper tantrum. Furthermore, after the severe initial shock, currency markets stabilised in the second post-election week. And despite the continued general upward pressure on the dollar, several EME currencies recouped some of the lost ground during that week, particularly in Latin America. By end-November, despite these swings, the January 2016 levels had still not been breached by either the dollar basket or by most bilateral rates.
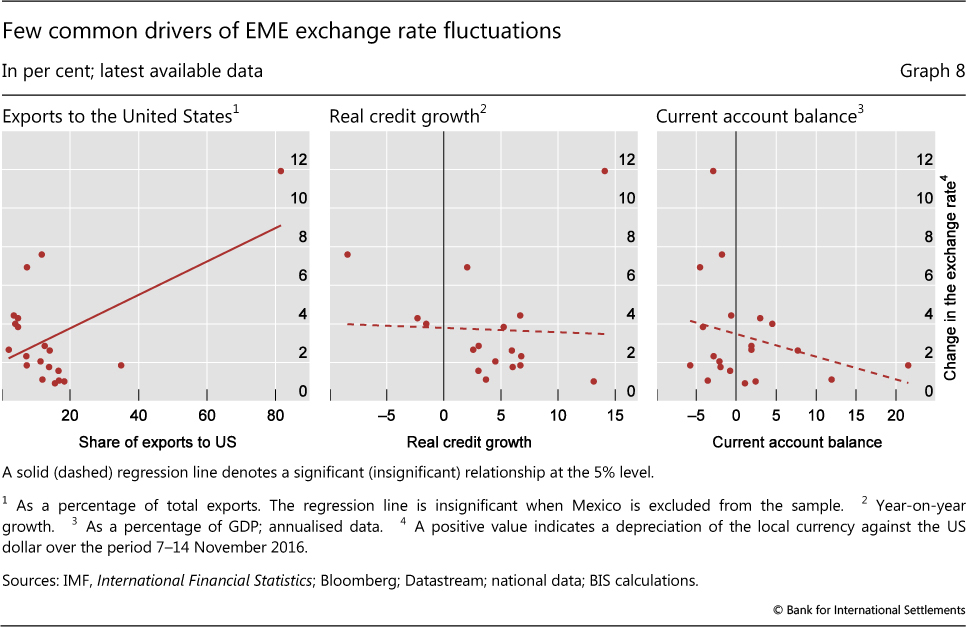
In contrast to the taper tantrum, measures of domestic imbalances were not at the forefront of EME market reactions this autumn. For instance, from May to September 2013 investors had appeared to discriminate most forcefully against countries that had experienced rapid credit growth and large current account deficits.3 These factors did not play a role in the recent episode (Graph 8, centre and right-hand panels). Equally, trade links with the United States appeared not to drive fluctuations in general despite concerns about the increasing mood of protectionism there (Graph 8, left-hand panel). The statistical relationship between trade exposure to the United States and the currency depreciation is only significant because of the Mexican peso,4 which was hardest hit, falling 12% in one week, reflecting concern over potential changes to not only the trade but also the immigration policies of the United States.
Also different from the 2013 episode was that EME credit and equity market reactions were more muted, possibly reflecting a different economic and financial backdrop (Graph 6, right-hand panel). The taper tantrum prompted a sudden capital outflow from EMEs after a long period of strong inflows dating back to 2009 (Graph 6, left-hand panel). In contrast, EME funds had suffered massive outflows between 2013 and 2015 - equal to approximately 60% of inflows before the taper tantrum - in the wake of depreciating and more volatile exchange rates, and a weaker outlook for EMEs. Credit had also been extended at fixed rates at relatively long maturities in recent years, reducing the risk of immediate negative feedback spirals. More sanguine credit and equity market reactions may also have reflected the fact that, going forward, EMEs may benefit from any expected boost to US growth.
Despite relatively limited asset market reactions in November, uncertainties facing EMEs loom large. Vulnerabilities are both external and domestic in nature. On the external side, in the aftermath of the US election, EME assets repriced the changing prospects of a boom in the United States, higher global yields, a rising dollar and the potential for a backlash against free trade. The trade-offs between these different channels may change quickly, in particular given high political uncertainty. Market dynamics could also be influenced by continued large historical exposures of EME funds. Moreover, nearly 10% of EME dollar-denominated corporate debt is scheduled to mature in 2017. Thus, close to $120 billion will need to be either rolled over or paid back, which could put further pressure on EMEs. Domestically, a number of EMEs still face imbalances related to recent periods of rapid credit growth.5
Dollar funding costs rise in the wake of reform
In October, global financial markets concluded a year-long adjustment to an important shift in the intermediation of wholesale bank funding. A set of US regulatory reforms focusing on prime money market funds (MMFs) - a major source of short-term dollar funding for banks globally - was fully implemented on 14 October 2016. Runs on MMFs in September 2008 were at the centre of the most acute phase of the GFC. The US Securities and Exchange Commission's rules now require institutional prime MMFs - those that invest in a mix of public and private sector obligations - to adopt a floating net asset value structure. Funds are now also allowed to impose liquidity fees and redemption gates in the event of a large increase in outflows.
The anticipation of the new rules had reduced the size of prime funds by almost 75% since October 2015. In absolute terms, the total assets of these funds declined by more than $1 trillion (Graph 9, first panel). At the same time, assets managed by MMFs that invest solely in government securities or repos, and are not subject to the new regulations, increased by a similar amount.
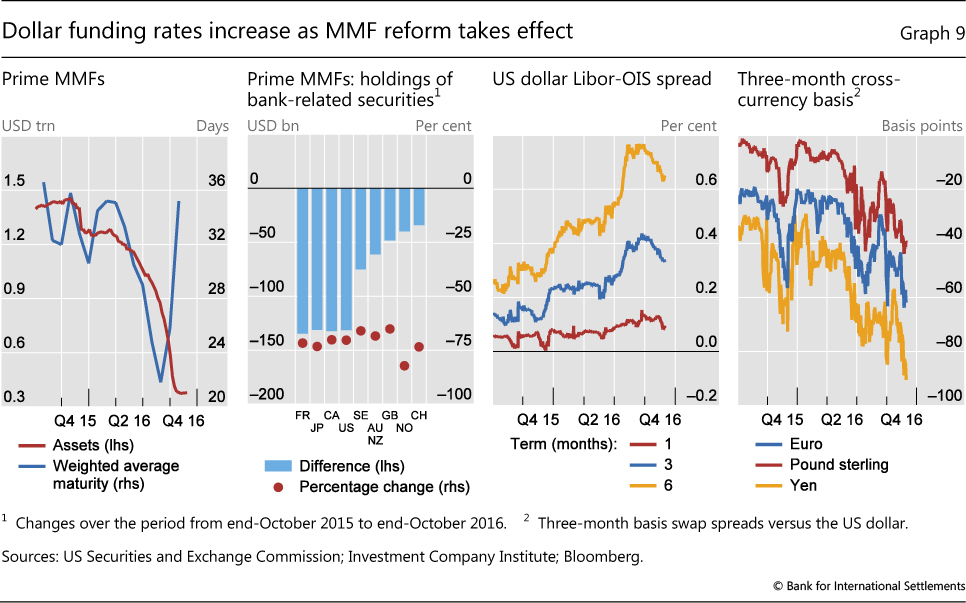
With rapidly shrinking assets under management, prime MMFs cut their funding to banks worldwide. The reduction was particularly evident for banks in Canada, France and Japan. Since last October, the amount of credit provided by these funds to financial institutions in each of these three countries fell by around $130 billion. This amounted to no less than a 70% contraction in short-term dollar funding obtained from prime MMFs (Graph 9, second panel).
To have sufficient flexibility in the event of rapid withdrawals, prime MMFs also shortened the maturity of their assets. They lowered the weighted average maturity of their investments from almost 36 days in October 2015 to close to 20 days in August 2016 (Graph 9, first panel). From the trough, however, average maturities had recovered fully by the end of October 2016.
These portfolio shifts have driven short-term dollar funding costs notably higher, in particular for relatively longer-term liabilities (Graph 9, third panel). On average, the one-month US dollar Libor-OIS spread was 5 basis points wider in November of this year than in October 2015, while the average three-month and six-month US dollar Libor-OIS spreads widened by 20 and 36 basis points, respectively. The costs of alternative dollar funding sources, such as cross-currency basis swap spreads (which add to the costs of issuing in a non-dollar currency and swapping the proceeds into dollars), have also turned higher, pointing to ongoing anomalies in this market (Graph 9, fourth panel).6
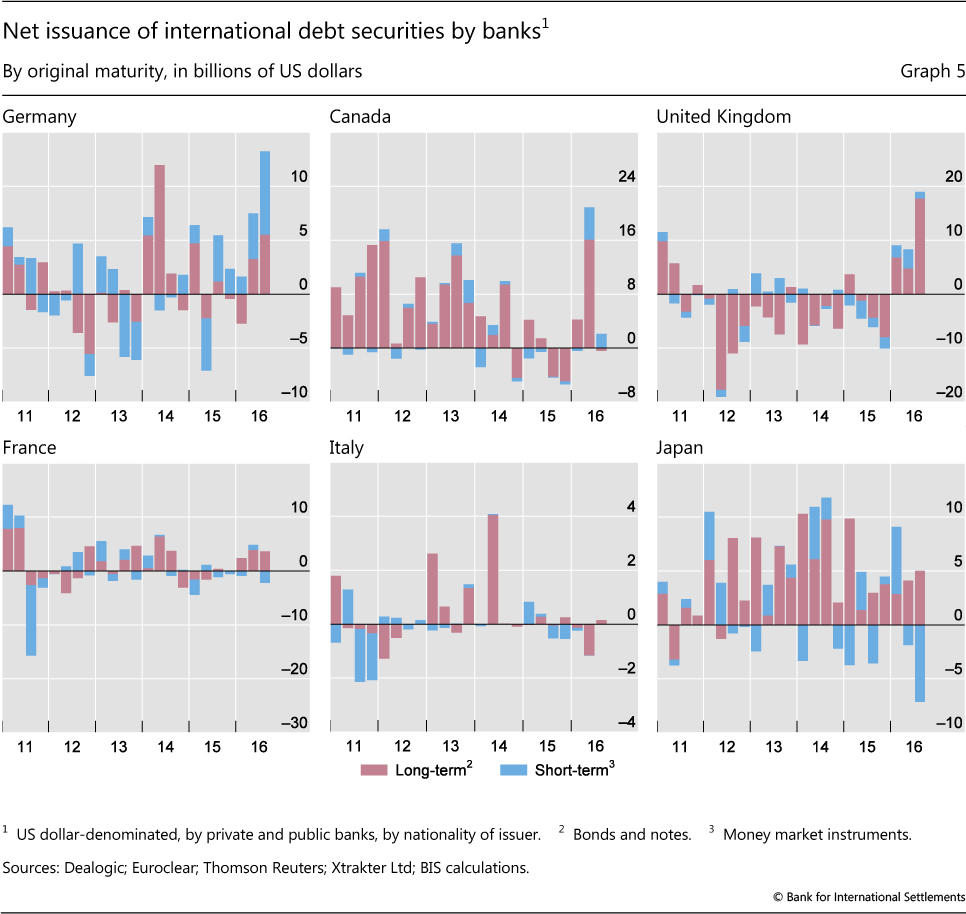
These significantly wider Libor-OIS spreads had limited spillover effects on broader financial markets. Earlier episodes of wide spreads during the GFC and the European sovereign debt crisis were driven by a deterioration of bank creditworthiness and had led to tighter financial conditions more generally. In contrast, the current widening of spreads is largely due to changes in regulation. Borrowers that have been funded through the MMF sector have sought funding through other vehicles and markets. For instance, Canadian banks have increased their net issuance of long-term international debt securities by more than US$20 billion since the beginning of the year (see Graph 5 in "Highlights of global financial flows", BIS Quarterly Review, December 2016). That said, the wider spreads have nevertheless had an impact on borrowing costs for firms and households that have borrowed at rates tied to Libor.
1 For a detailed discussion, see T Ehlers and E Eren, "The changing shape of interest rate derivatives markets", BIS Quarterly Review, December 2016.
2 See "Highlights of global financial flows", BIS Quarterly Review, December 2016.
3 See Bank for International Settlements, 84th Annual Report, Box II.A, June 2014.
4 The statistical results are robust to using different measures of trade exposures to the United States, such as the US-specific weight in the trade-weighted exchange rate or a measure capturing direct and indirect trade linkages based on R Auer, A Levchenko and P Sauré, "International inflation spillovers through input linkages", BIS, mimeo, 2016.
5 See "Highlights of global financial flows", BIS Quarterly Review, September 2016.
6 For further discussion, see C Borio, V Sushko, R McCauley and P McGuire, "The failure of covered interest parity: FX hedging demand and costly balance sheets", BIS Working Papers, no 590, October 2016; and S Avdjiev, W Du, C Koch and H S Shin, "The dollar, bank leverage and the deviation from covered interest parity", BIS Working Papers, no 592, November 2016.