Global financial markets under the spell of monetary policy
Abstract
Financial markets have been acutely sensitive to monetary policy, both actual and anticipated. Throughout the year, accommodative monetary conditions kept volatility low and fostered a search for yield. High valuations on equities, narrow credit spreads, low volatility and abundant corporate bond issuance all signalled a strong appetite for risk on the part of investors. At times during the past year, emerging market economies proved vulnerable to shifting global conditions; those economies with stronger fundamentals fared better, but they were not completely insulated from bouts of market turbulence. By mid-2014, investors again exhibited strong risk-taking in their search for yield: most emerging market economies stabilised, global equity markets reached new highs and credit spreads continued to narrow. Overall, it is hard to avoid the sense of a puzzling disconnect between the markets' buoyancy and underlying economic developments globally.
Full text
The acute sensitivity of financial markets to monetary policy was a hallmark of the period under review. Asset prices responded to shifts in the policy outlook of major advanced economies to an even greater extent than in previous years. Expectations regarding US monetary policy were central: the Federal Reserve's first steps towards normalising monetary policy ushered in a bond market sell-off in May-June 2013 that reverberated around the globe. Yet the bout of turbulence did little to undermine the longer-term trend of investors searching for yield in an environment of low volatility and low funding costs.
Highly accommodative monetary policies in the advanced economies played a key role in lifting the valuations of risk assets throughout 2013 and the first half of 2014. Low interest rates and subdued volatility encouraged market participants to take positions in the riskier part of the investment spectrum. Corporate and sovereign spreads in advanced economies drifted to post-crisis lows, even in countries mired in recession. Buoyant issuance of lower-rated debt met with strong demand, and equity markets reached new highs. Some asset valuations showed signs of decoupling from fundamentals, and volatility in many asset classes approached historical lows.
Emerging market economies (EMEs), however, proved more vulnerable to shifting global conditions. EME assets shouldered heavier losses than did those in advanced economies in the wake of the 2013 sell-off, with persistent declines in bond, equity and currency markets. The broad-based retrenchment came at a time of adverse domestic conditions for a number of EMEs. Those with stronger fundamentals fared better but were not completely insulated. Advanced economies could see glimmers of economic recovery, but the overall growth outlook for EMEs weakened relative to earlier expectations embodied in asset prices; that outlook recovered somewhat in the first half of 2014.
The next section describes the main developments in global financial markets since April 2013. The focus then shifts to EMEs and the extent to which investors differentiated between them during two distinct episodes of market pressure. The final section explores how central bank policy affected financial market activity and asset prices and examines the ways investors navigated the low interest rate environment in their search for yield.
The year in review: a bumpy ride in the search for yield
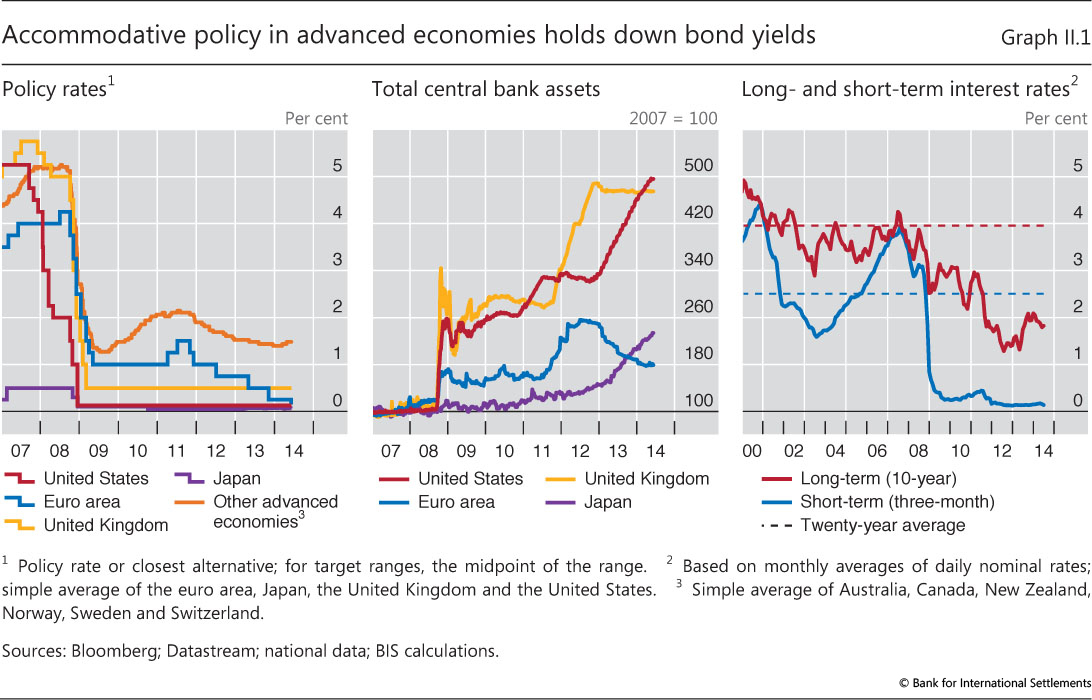
The central banks of the major advanced economies were still very much in easing mode in the early months of 2013 (Graph II.1). Policy rates remained at the effective lower bound (Graph II.1, left-hand panel), while central bank balance sheets continued to expand (Graph II.1, centre panel, and Chapter V). In early 2013, nominal benchmark yields were still near the record lows they had reached in 2012 after several years of monetary policy accommodation (Graph II.1, right-hand panel). Although long-term bond yields rose in mid-2013, the prospect of continued low rates in core - ie major sovereign - bond markets contributed to a persistent search for yield.
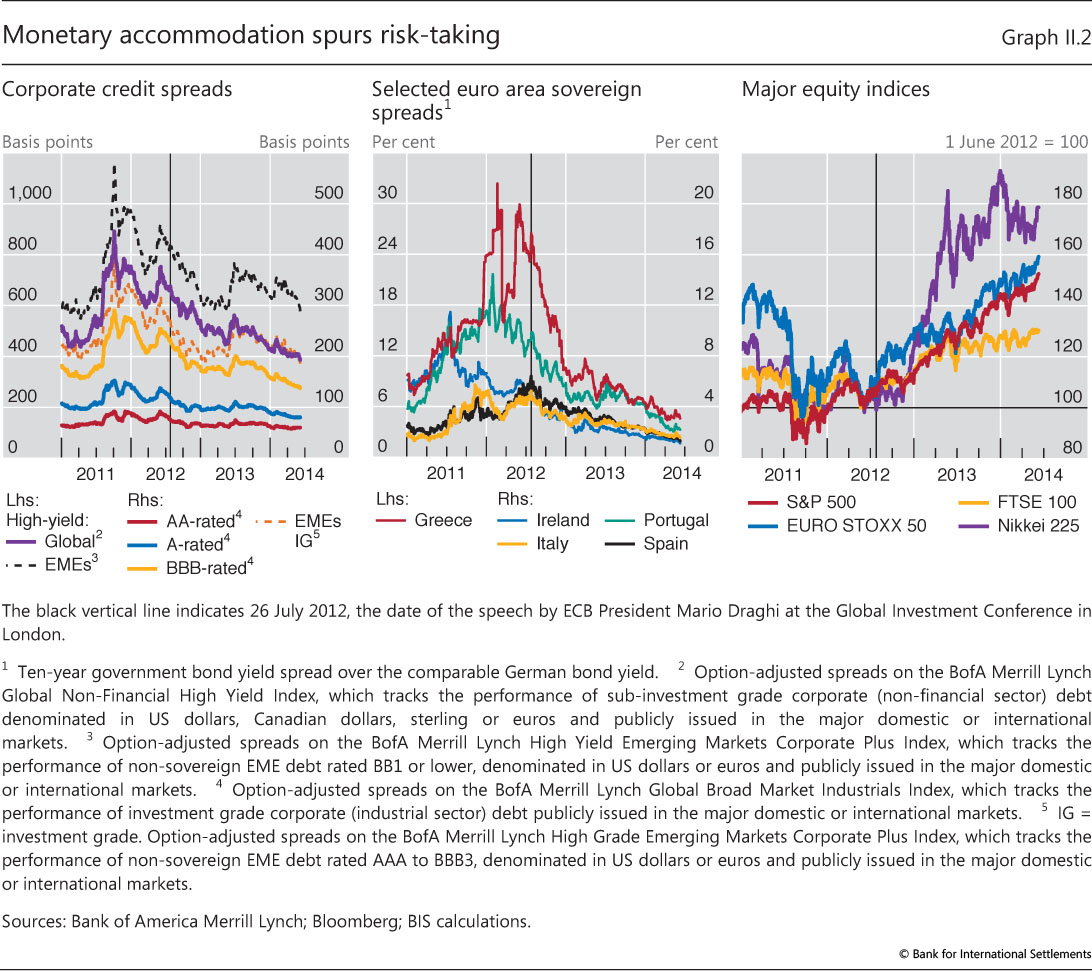
The search for yield moved into riskier European sovereign bonds, lower-rated corporate debt and emerging market paper (Graph II.2). Bond spreads of lower-rated European sovereigns continued to narrow, easing their funding conditions and continuing a rally that had followed the announcement of the ECB's programme of Outright Monetary Transactions (OMT) in 2012 (Graph II.2, centre panel). The low interest rate environment also boosted advanced economy equity markets, which extended their rally in 2013 as the economic outlook in those economies gradually improved and investors expected monetary accommodation to continue to support asset prices (Graph II.2, right-hand panel).
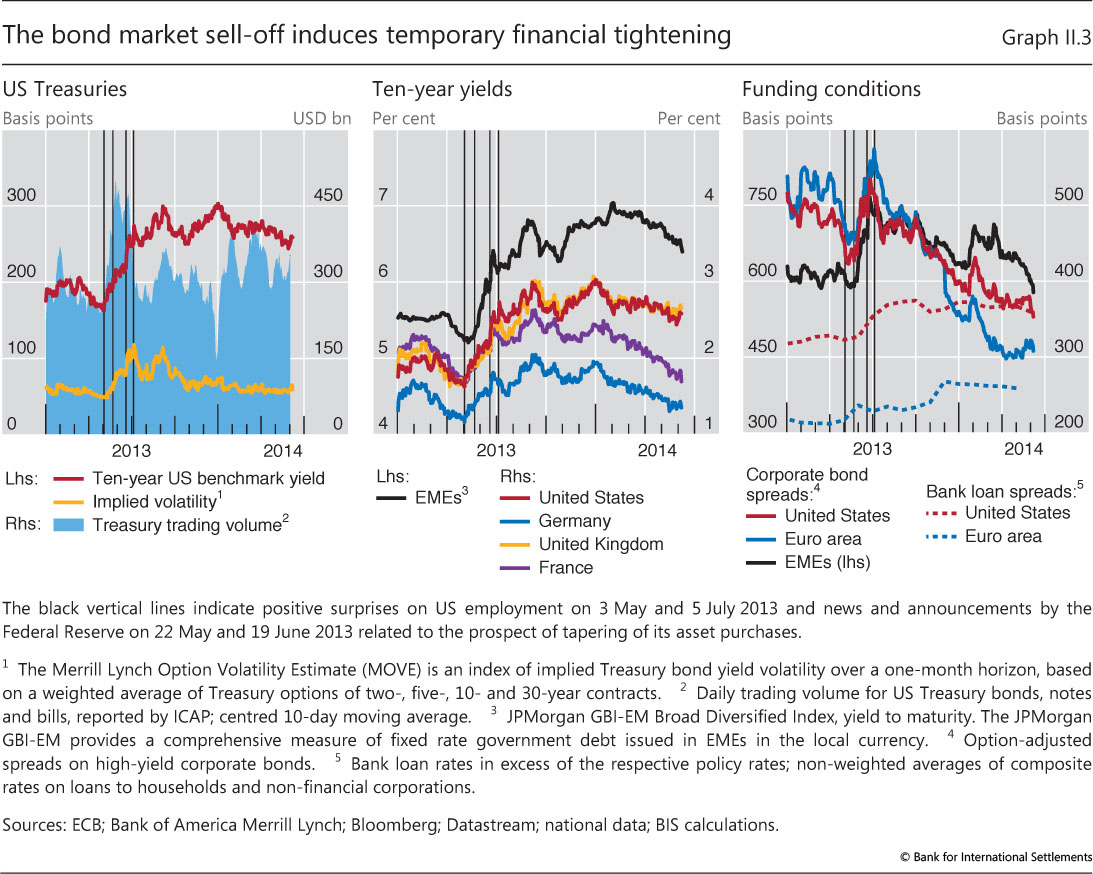
Markets entered a more turbulent phase in early May 2013. After the release of strong US labour market data, comments by Federal Reserve officials were interpreted by investors as signals that the central bank would soon slow the pace of asset purchases and end its quantitative easing policy. After a prolonged period of exceptional monetary accommodation, the discussion of tapering caught many market participants by surprise. The expectation of a significant policy shift triggered a bond market sell-off. The short end of the US yield curve (up to two-year maturities) remained anchored by current rates and forward guidance. But with new uncertainty about the nature and timing of policy normalisation, long-term bond yields rose by 100 basis points by early July, with a corresponding surge in trading volume and volatility (Graph II.3, left-hand panel).
The sell-off in US Treasury bonds had global repercussions, battering a broad range of asset classes in both advanced and emerging market economies. Yields on core European sovereign bonds increased markedly, although neither inflation nor ECB rate hikes were on the horizon; EME bond yields rose even more than US yields (Graph II.3, centre panel). Prices of mortgage-backed securities fell, followed by equities a few weeks later. Spreads on corporate bonds and bank loans increased as well (Graph II.3, right-hand panel). Rising yields in advanced economies, in combination with other factors, triggered a first wave of selling pressure on EME assets. While investors in advanced economy investment funds shifted from bonds to equity, they pulled out of EME funds of all asset classes (see below).
Responding to mere perceptions of future changes in monetary policy, markets thus induced tighter funding conditions well before major central banks actually slowed their asset purchases or raised rates. To alleviate the market-induced tightening, central banks on both sides of the Atlantic felt compelled to reassure markets. The turbulence abated in early July when the Federal Reserve, the ECB and the Bank of England issued or reiterated their forward guidance regarding the path of monetary policy (Chapter V).
Markets in advanced economies quickly shrugged off the tapering scare, and the search for yield resumed (Graph II.2). The bout of volatility did little to undermine the relative appeal of higher-yielding asset classes, as benchmark yields remained low by historical standards (Graph II.1, right-hand panel). The combination of better growth prospects in the United States and the Federal Reserve's decision in September 2013 to postpone monetary tightening supported further gains in bond and equity markets in the final quarter of 2013. Markets even brushed aside the possibility of a technical default by the US government - which was resolved in mid-October with the end of the 16-day federal government shutdown. And when the Federal Reserve announced in December that it would steadily reduce asset purchases beginning in January 2014, the market reaction was muted. For 2013 as a whole, all the major stock exchanges gained 14-57% (Graph II.2, right-hand panel).
In the first half of 2014, investor optimism continued to fuel higher asset valuations in spite of macroeconomic and geopolitical uncertainties (Graph II.2). In late January 2014, concerns that weakness in US activity might be more than weather-related and a second wave of selling pressure on EME assets put a dent in investor confidence that lasted until mid-February. Market tensions rapidly subsided when the authorities in the advanced economies reaffirmed their support for policies designed to spur economic recovery (Chapter V). Financial conditions eased further as the macroeconomic outlook improved in the advanced economies (Chapter III). Markets remained resilient to stresses, including the geopolitical tensions surrounding Ukraine - the Russian stock market and the rouble initially declined by 15% and 10%, respectively, between January and mid-March, and then recovered much of their losses. Once more, communication from the Federal Reserve and the ECB, together with stronger economic data, helped support credit and equity markets, with the major stock exchanges reaching record highs in May and June 2014.
Sovereign borrowers in the euro area periphery benefited greatly from these developments, which were reinforced by the new easing measures unveiled by the ECB in early June 2014. Their spreads reached a post-crisis minimum relative to the German 10-year bund, whose yield itself dropped below 1.5% (Graph II.2, centre panel). Yields on Spanish and Italian 10-year debt thus fell below 3% in May and early June, respectively. Taking advantage of the benign funding environment, Greece issued an oversubscribed five-year bond in April, raising €3 billion at a yield below 5%, in its first offering since losing access to bond markets in 2010. Similarly, in its first regular debt auction since receiving official support in May 2011, Portugal sold 10-year bonds at 3.57% in April 2014; and Ireland, which had already issued a well received five-year bond in mid-2012, exited from official financing towards the end of 2013.
Emerging market economies suffered sharp reversals
EMEs fared less well than advanced economies in the wake of the 2013 bond market sell-off, suffering heavier losses for a longer period. The global financial tightening contributed to two rounds of broad-based retrenchment from EMEs. The two episodes differed in important respects, starting with the trigger. The first episode was set off by a global shock - the bond market sell-off after the tapering comments - and lasted from May to early September 2013; the second arose from developments in the EMEs themselves, gathered pace in November 2013 and peaked in January 2014.
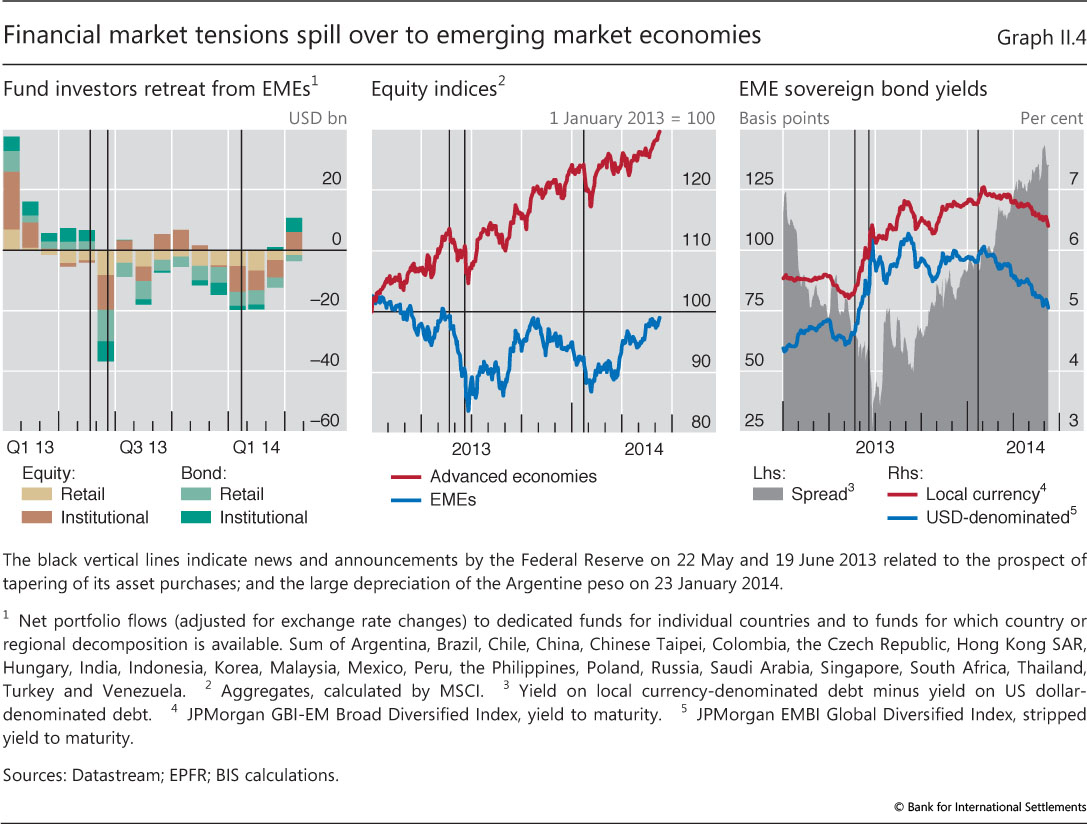
The first episode was abrupt and generalised in nature, with sharp asset price movements ending a period of fairly stable interest and exchange rates. As the sell-off spilled over from advanced economies, EMEs experienced a sharp reversal of portfolio flows, especially in June 2013 (Graph II.4, left-hand panel). EME equities fell by 16% before stabilising in July, and sovereign bond yields jumped more than 100 basis points, driven by rising concerns over sovereign risk (Graph II.4, centre and right-hand panels). At first, the indiscriminate retrenchment from EMEs affected many currencies simultaneously, leading to correlated depreciations amid high volatility (Graph II.5, left-hand panel). From July onwards, markets increasingly differentiated between EMEs on the basis of fundamentals. The currencies of Brazil, India, Indonesia, South Africa and Turkey depreciated by more than 10% against the US dollar during the first episode (Graph II.5, centre panel); Brazil, India, Indonesia and Russia each lost more than $10 billion in reserves. Countries with rapid credit growth, high inflation or large current account deficits were seen as more vulnerable and experienced sharper depreciations (Box II.A).
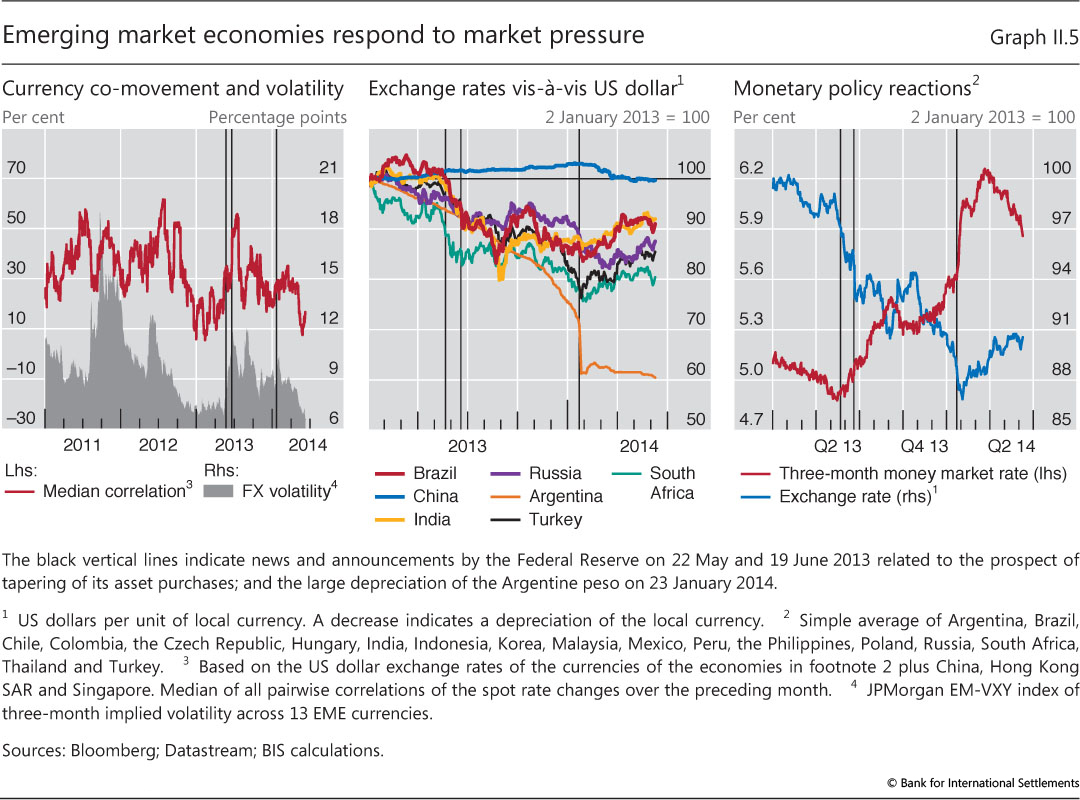
Compared with the first episode, the second round of retrenchment had a more sustained and discerning character. In the period of relative calm in September and October, EMEs recovered less than advanced economies did, and investors' concerns about EMEs built up in the final months of 2013. In this prelude to the second episode, market pricing increasingly reflected a deteriorating macroeconomic outlook in many EMEs and the gradual unwinding of financial imbalances in some (Chapters III and IV). Government bond yields and credit spreads remained elevated, and markets witnessed continuing losses amid persistent fund outflows (Graph II.4). When market tensions escalated in January 2014, further losses on equities and bonds were more contained than in the first episode; the focus had turned to EMEs with poor growth prospects or political tensions. The pressure on EME currencies reached a climax on 23 January 2014, when Argentina's central bank let the peso devalue by more than 10% against the US dollar. Although the depreciations were comparable in magnitude to those in the first episode, they reflected country-specific factors to a greater extent in the second episode (Box II.A).
Central banks in several EMEs stepped up their defence against renewed currency pressure by raising interest rates and intervening in foreign exchange markets. Led by Turkey, the policy response was more forceful in the second episode than in the first (Graph II.5, right-hand panel, and Chapter V). These actions helped to stabilise EME exchange rates and boosted the value of some currencies, providing breathing space to local firms that had tapped international markets by issuing foreign currency bonds (Chapter IV). Starting in February, EME currencies and equities recouped much of their January losses, while bond spreads narrowed again (Graphs II.4 and II.5). With the reversion to a low-volatility environment, selected EME assets and currency carry trades regained popularity among investors searching for yield.
Box II.A
Determinants of recent currency depreciations in EMEs
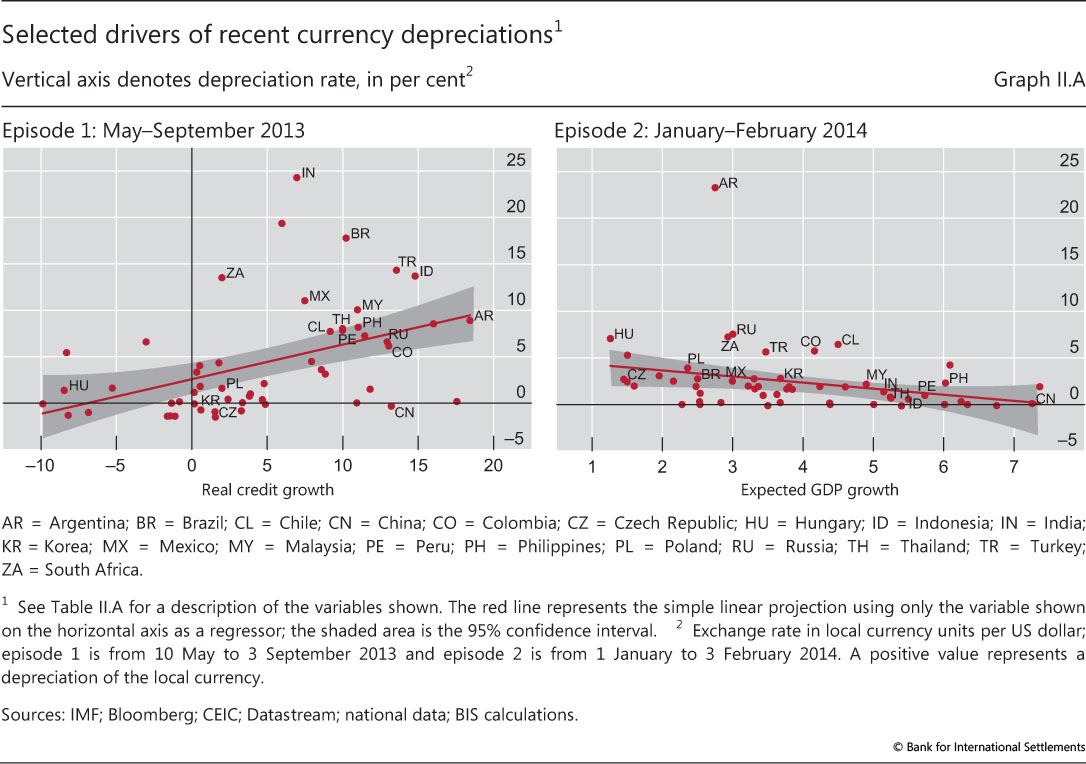
In the period under review, emerging market economies (EMEs) experienced two rounds of currency depreciation. In both episodes, investors differentiated between EMEs, but in the second round they did so to a greater extent and focused on a somewhat different set of factors. To explore investor discernment across the two episodes, this box considers various determinants of exchange rate movements against the US dollar in a sample of 54 EMEs.
In the first episode (early May to early September 2013), investors initially shed EME exposures indiscriminately in response to Federal Reserve signalling regarding future policy normalisation. However, as the first episode progressed, investors focused more on country-specific factors, which altered the pattern of depreciations across EMEs. Investors began to discriminate more against countries with large financial imbalances, including rapid credit growth and large current account deficits, which tend to rely on foreign capital inflows. A simple scatter plot illustrates the effect in the case of real growth in domestic credit to the private non-financial sector, showing that rapid growth accompanied greater depreciation (Graph II.A, left-hand panel). In the second round of depreciations (early January to early February 2014), investors also differentiated between economies, but expected GDP growth emerged as a strong factor. As shown again with a scatter plot, countries with better growth prospects for 2014 experienced less pressure on their exchange rates than other EMEs in that episode (Graph II.A, right-hand panel).
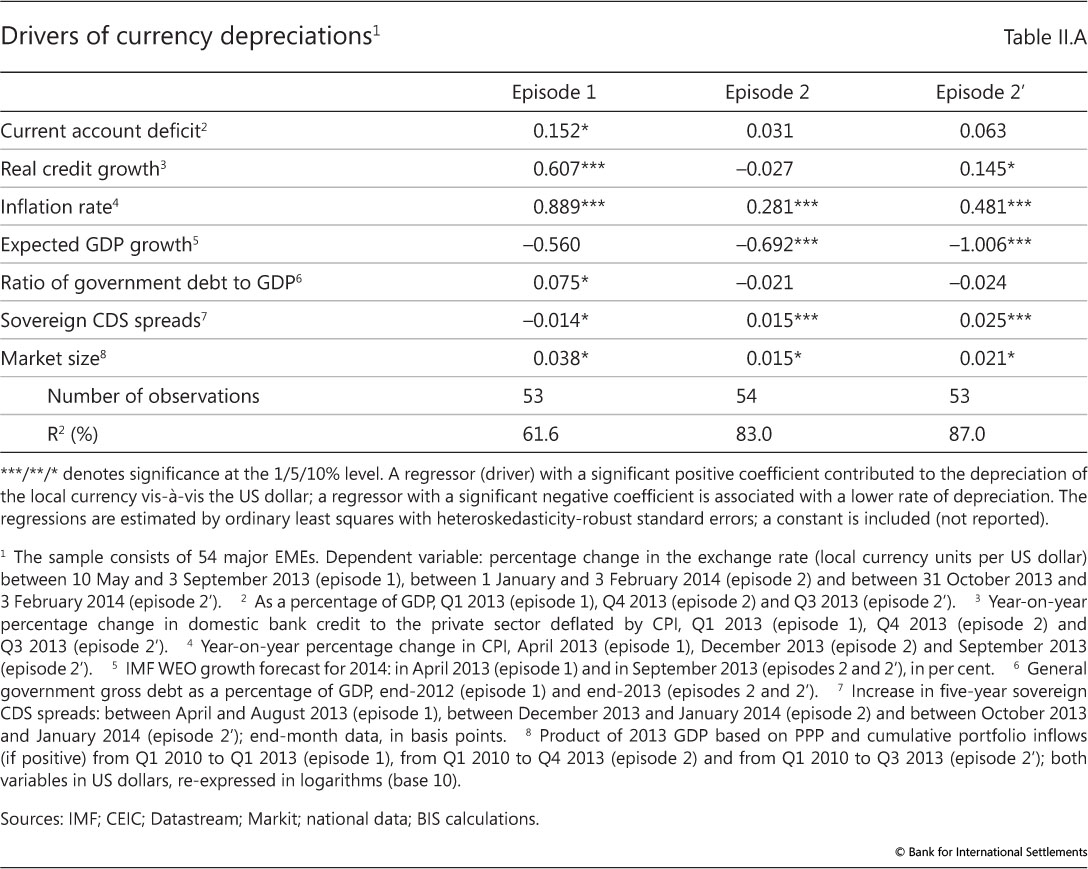
Multiple regression analysis supports these observations (Table II.A). Larger current account deficits, strong real credit growth and high inflation stand out as the main drivers of currency depreciations in the first episode (as indicated by the significant positive coefficients reported in the table). Depreciations also tend to be larger where the ratio of government debt to GDP is higher and for countries with a large "market size" (a variable incorporating GDP and portfolio inflows since 2010). These results still hold when increases to EME policy rates are taken into account. The analysis of the second episode indicates a stronger role for expected GDP growth relative to episode 1. As for factors that worsen depreciations in episode 2, inflation and market size remain important, and sovereign risk - as captured by credit default swap (CDS) spreads - becomes more important. The determinants in episode 2 appear to be even more significant when the beginning of the period is extended back from 1 January 2014 to include the build-up phase, starting on 31 October 2013 (episode 2').
Overall, the regression explains a larger share of the second episode's variation in depreciation rates across countries (more than 80% of the variation as measured by R2), suggesting that country-specific factors were more prominent in that episode.
Central banks left their mark on financial markets
The sensitivity of asset prices to monetary policy stands out as a key theme of the past year. Driven by low policy rates and quantitative easing, long-term yields in major bond markets had fallen to record lows by 2012. Since then, markets have become highly responsive to any signs of an eventual reversal of these exceptional conditions. Concerns about the course of US monetary policy played a central role - as demonstrated by the mid-2013 bond market turbulence and other key events during the period under review. But monetary policy also had an impact on asset prices and on the behaviour of investors more broadly.
The events of the year illustrated that - by influencing market participants' perceptions and attitudes towards risk - monetary policy can have a powerful effect on financial conditions, as reflected in risk premia and funding terms. Put another way, the effects of the risk-taking channel of monetary policy were highly visible throughout the period.1
Financial markets fixated on monetary policy
The extraordinary influence of central banks on global financial markets manifested itself most directly in core fixed income markets, where the shape of the yield curve was particularly sensitive to any news or change in expectations regarding policy. While the short end largely remained anchored by low policy rates, medium-term yields responded to forward guidance, and the longer end was governed by asset purchases, long-term expectations and perceived central bank credibility (Chapter V). When the Federal Reserve - as the first of the major central banks to act - hinted at a slowdown in asset purchases in mid-2013, long-term bonds incurred heavy losses. Although bond prices fell less sharply than in the sell-offs of 1994 and 2003, overall losses in market value were greater this time, because the stock of Treasury securities was much larger (Box II.B).
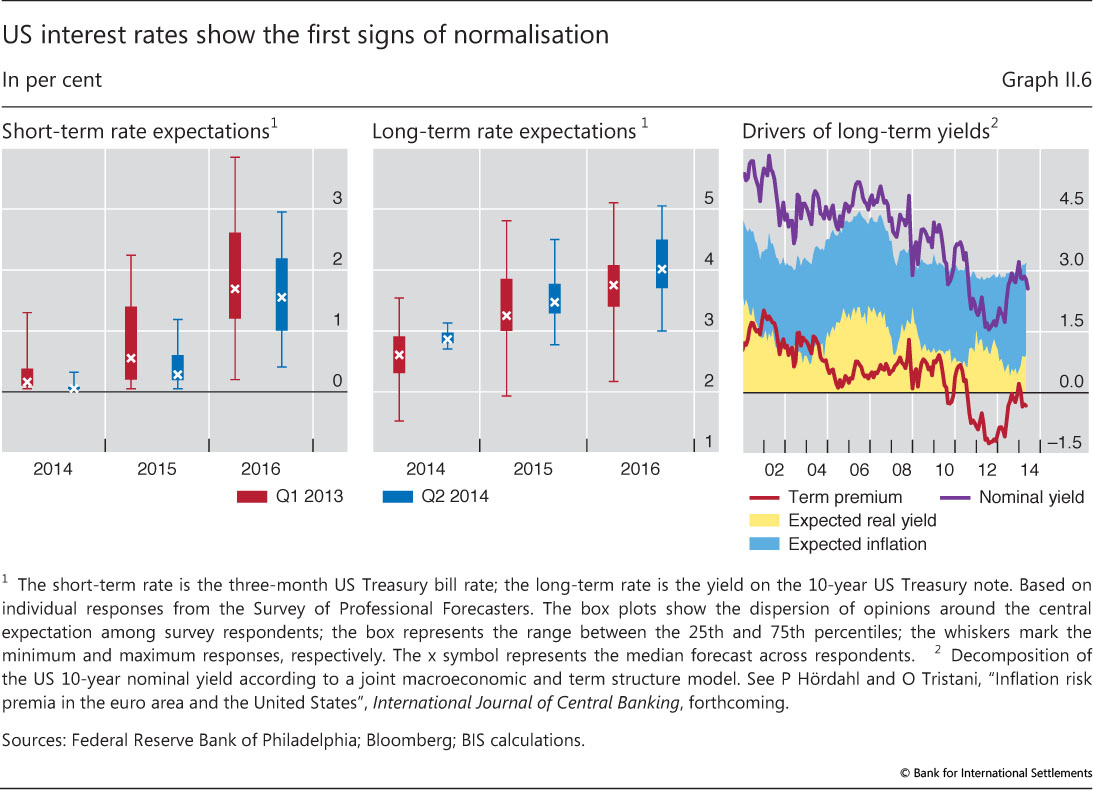
Unconventional monetary policy and forward guidance assumed a critical role in central bank communication (Box V.A). When the Federal Reserve signalled its intent to keep the federal funds rate low even after ending asset purchases, investors revised downwards their medium-term expectations of short-term rates, and the dispersion of opinions narrowed (Graph II.6, left-hand panel). At the same time, market participants were more in agreement that long-term rates would eventually rise in the medium run (Graph II.6, centre panel).
The Federal Reserve's actions also left their mark on the long end of the yield curve. A yield decomposition suggests that changes in expected inflation or real rates had little impact on the long end (Graph II.6, right-hand panel). Instead, the mid-2013 surge in the 10-year yield largely matched the increase in the term premium, ie the compensation for the risk of holding long-duration bonds exposed to future fluctuations in real rates and inflation. Driven by unconventional policies and periods of flight to safety, the estimated term premium on 10-year US Treasuries became negative in mid-2011 and declined to unprecedented lows by July 2012. The partial normalisation of this premium in 2013 was consistent with the prospect of a reduction in asset purchases by the Federal Reserve, a major source of demand in the Treasury market. That said, in early 2014 the estimated term premium was around zero and thus more than 100 basis points below its 1995-2010 average.
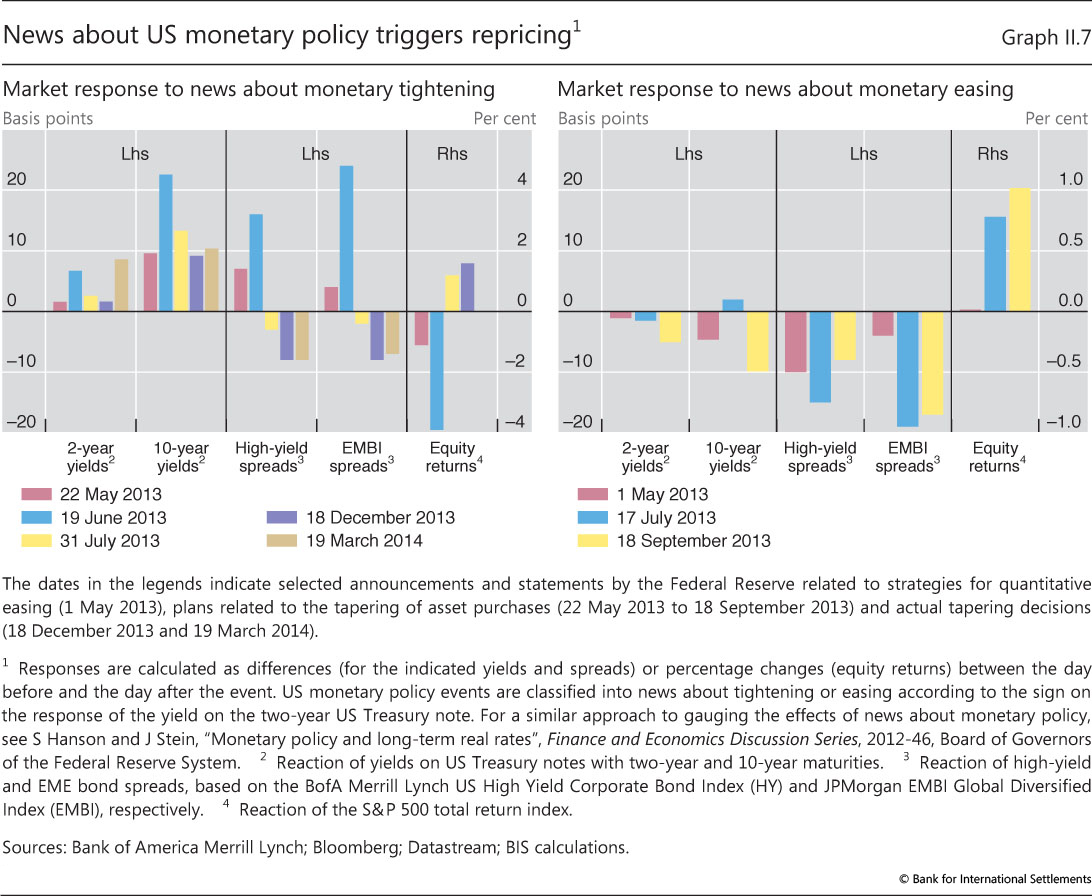
Throughout 2013 and 2014, news about the prospect of an eventual exit from easing triggered sharp price reactions across a range of asset classes (Graph II.7). The response to the Federal Reserve's tapering-related announcement on 19 June 2013 was particularly intense: long-term US yields spiked more than 20 basis points on the announcement, while spreads on high-yield bonds and dollar-denominated EME paper jumped 16 and 24 basis points, respectively (Graph II.7, left-hand panel). The S&P 500 equity index lost about 4%, while implied volatility in equity markets rose by 4 percentage points. However, subsequent Federal Reserve communications, on 17 July and 18 September 2013, reassured markets that eventual tightening lay further in the future than participants had anticipated. On that more accommodative news, two-year yields dropped, while high-yield and EME bond spreads narrowed (Graph II.7, right-hand panel). By the time the actual tapering was announced in December 2013, markets were more prepared. Although long-term yields picked up around 10 basis points, credit spreads declined, and US equity prices actually rose, by 1.6% (Graph II.7, left-hand panel).
Box II.B
The 2013 sell-off in US Treasuries from a historical perspective
How significant was the sell-off in the market for US Treasury securities in May-June 2013? It depends on how one measures losses. Valuation losses on individual securities were slightly less than those incurred during the sell-offs in 1994 and 2003, whereas the scale of aggregate losses on the stock of outstanding securities was greater in 2013, both in absolute terms and relative to GDP.
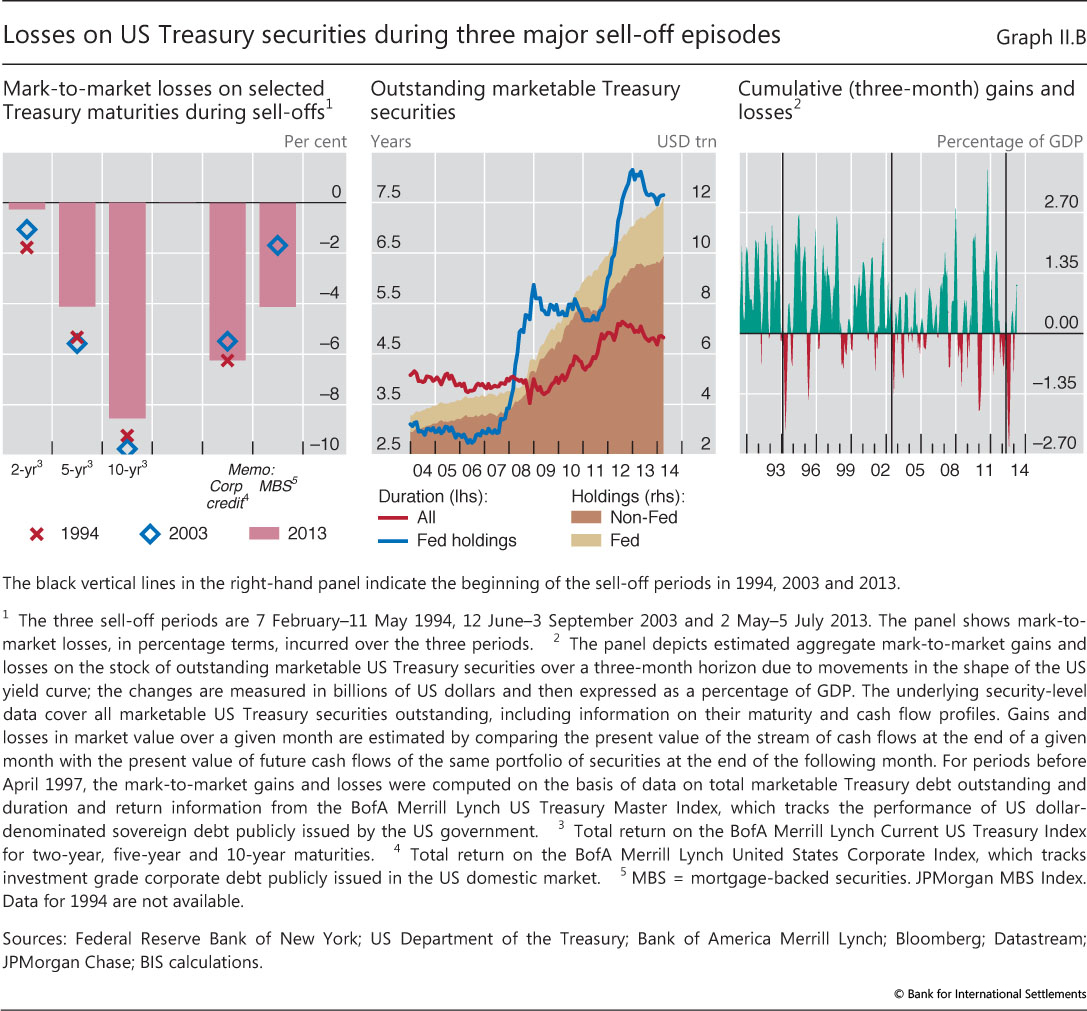
In comparing the mark-to-market losses in mid-2013 with those of 1994 and 2003, we first adopt a securitylevel perspective and quantify the percentage losses for marketable Treasuries at each maturity (the results for a selection of three Treasury maturities are shown in Graph II.B, left-hand panel, along with losses on certain private sector debt securities). Then we estimate the aggregate mark-to-market losses on the total stock of outstanding marketable Treasury securities, taking into account their specific maturity and cash flow profiles (Graph II.B, righthand panel).
The sell-off in 1994 was different from the 2003 and 2013 episodes in that, in 1994, not only did long-term rates surge, but short-term rates also picked up significantly. In early February 1994, after a long period of monetary accommodation, a modest but unexpected increase in the Federal Reserve's policy rate produced strong upward revisions in expected future inflation and short-term rates. Over the course of the following three months, the policy rate increased by 75 basis points, and 10-year yields rose more than 140 basis points. By contrast, in both 2003 and 2013, the bond market stress was confined mostly to longer maturities, although the drivers of the 2003 event were different from those in 2013. The 2003 surge in long-term yields was driven largely by a pickup in expected future real rates and inflation; in 2013, the rise was due almost entirely to a lift-off of term premia from unprecedented lows (see Graph II.6, right-hand panel, and discussion in the main text).
As illustrated in the left-hand panel of Graph II.B, mark-to-market losses of individual securities during the 2013 turmoil were not quite as great as those seen in 1994 and 2003. But the 2013 sell-off stands out because of the massive expansion in the stock of debt in the wake of the financial crisis (Graph II.B, centre panel). Between early 2007 and 2014, the stock of outstanding marketable US Treasury securities almost tripled, from $4.4 trillion to $12.1 trillion, with an increasing share of the securities held in the Federal Reserve System Open Market Account (SOMA).
Publicly available data on outstanding amounts, remaining maturities and coupon payments of marketable Treasury securities permit the calculation of the cash flow profile and duration of both the Federal Reserve holdings and those of the public for the 2003 and 2013 episodes. The duration of all outstanding securities - and thus their sensitivity to sudden changes in interest rates - has increased from around 3.8 years to 4.8 years since 2007 as a result of debt management policies and the drop in yields to record lows (with corresponding valuation gains). The duration of the Federal Reserve's holdings has increased even more under its maturity extension programme (MEP), introduced in late 2011, which in turn has helped keep the duration of debt held by the public largely constant.
Because of the great rise in the stock of Treasury securities since the financial crisis, the 2013 bond market selloff generated a larger aggregate loss in both dollar and GDP terms than did the 1994 and 2003 episodes. Between May and end-July 2013, all holders of marketable US Treasury debt incurred aggregate cumulative mark-to-market losses of about $425 billion, or about 2.5% of GDP (Graph II.B, right-hand panel). Aggregate losses during the 2003 sell-off amounted to an estimated $155 billion, or 1.3% of GDP; and in 1994 about $150 billion, or about 2% of GDP.
However, in 2013, public holders incurred only about two thirds of the aggregate losses - some $280 billion, or roughly 1.7% of GDP - and that GDP share of losses was probably no greater than the share in 1994. Hence, because of the high amount of duration risk which the Federal Reserve had taken onto its own balance sheet, the valuation losses for public holders of US Treasury securities in 2013 were relatively contained despite the much larger amount of outstanding marketable Treasury securities.
Treasury securities held within various US government accounts, including trust funds, are not marketable. In this box, we use the term "public holders" of marketable Treasury securities to mean any domestic or foreign investor except the Federal Reserve. SOMA holdings are reported by the Federal Reserve Bank of New York for the last Wednesday of each month; outstanding marketable Treasury securities from Treasury Direct's monthly statements of public debt are for the last day of each month. We abstract from the differences in outstanding amounts and duration that may result from this time difference. The information on outstanding Treasuries is available in electronic form only from April 1997 onwards. To estimate mark-to-market losses in 2013 and compare them with losses incurred in the two earlier episodes, we rely on security-level data on all marketable US Treasury securities outstanding as well as their maturity and cash flow profiles and then quantify the monthly fluctuations in the aggregate market value of outstanding securities that were due to changes in the shape of the US yield curve. For discount rates, we use linearly interpolated constant maturity yields from the Federal Reserve Board's H.15 tables. Estimates of the month-to-month losses in market value were obtained by comparing the present value of cash flows at the end of a given BIS 84th Annual Report 11 EME paper jumped 16 and 24 basis points, respectively (Graph II.7, left-hand panel). The S&P 500 equity index lost about 4%, while implied volatility in equity markets rose by 4 percentage points. However, subsequent Federal Reserve communications, on 17 July and 18 September 2013, reassured markets that eventual tightening lay further in the future than participants had anticipated. On that more accommodative news, two-year yields dropped, while high-yield and EME bond spreads narrowed (Graph II.7, right-hand panel). By the time the actual tapering was announced in December 2013, markets were more prepared. Although long-term yields picked up around 10 basis points, credit spreads declined, and US equity prices actually rose, by 1.6% (Graph II.7, left-hand panel). month with the present value of cash flows for the same portfolio of securities at the end of the following month. When the level of the yield curve increases or the slope steepens over the course of the month, the value of outstanding Treasuries declines because future cash flows are discounted more heavily. To calculate the difference in the present value, we abstract from all cash flows occurring between the end of a given month and the end of the following month. The analysis of estimated aggregate mark-to-market gains and losses prior to April 1997 is based on less granular information, assuming a maturity structure of outstanding Treasury securities in line with that of common US government bond market indices. Federal Reserve holdings in 1994 are not likely to have exceeded $350 billion and presumably had a duration no longer than that of the entire stock of outstanding Treasury securities. The conclusion for 1994 can be inferred from data provided by J Hamilton and C Wu, "The effectiveness of alternative monetary policy tools in a zero lower bound environment", Journal of Money, Credit and Banking, vol 44, February 2012, pp 3-46.
Low funding costs and volatility encouraged the search for yield
Through its impact on risk-taking behaviour, monetary accommodation had an impact on asset prices and quantities that went beyond its effects on major sovereign bond markets. Credit spreads tightened even in economies mired in recession and for borrowers with non-negligible default risk. Global investors absorbed exceptionally large volumes of newly issued corporate debt, especially that of lower-rated borrowers. And, as the search for yield expanded to equity markets, the link between fundamentals and prices weakened amid historically subdued volatility and low risk premia.
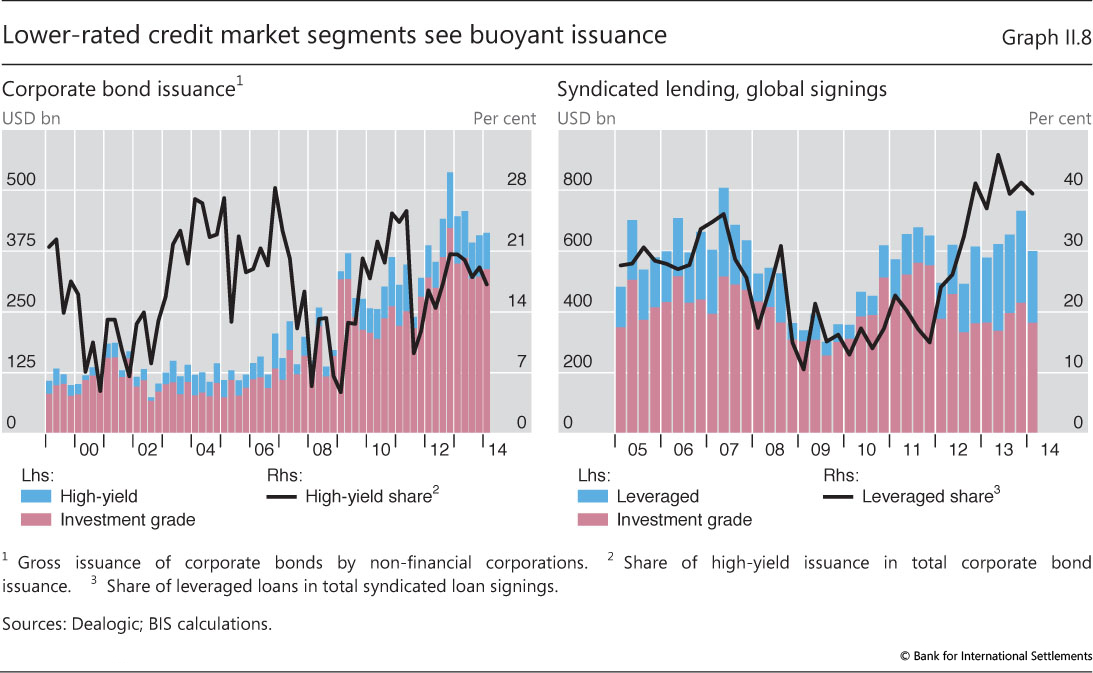
In an environment of elevated risk appetite, buoyant issuance of lower-rated debt met with strong investor demand. A considerable volume of debt has been issued over the past few years, in both the investment grade and high-yield segments (Graph II.8, left-hand panel). Firms have increasingly tapped capital markets to cover their financing needs at a time when many banks were restricting credit (Chapter VI). Gross issuance in the high-yield bond market alone soared to $90 billion per quarter in 2013 from a pre-crisis quarterly average of $30 billion. Investors absorbed the newly issued corporate debt at progressively narrower spreads (Graph II.2, left-hand panel). The response of institutional investors to accommodative conditions at the global level - taking greater risk, eg to meet return targets or pension obligations - was consistent with the risk-taking channel of monetary policy.2
Increased risk-taking also manifested itself in other credit market segments. In the syndicated loan market, for instance, credit granted to lower-rated leveraged borrowers (leveraged loans) exceeded 40% of new signings for much of 2013 (Graph II.8, right-hand panel). This share was higher than during the pre-crisis period from 2005 to mid-2007. Fewer and fewer of the new loans featured creditor protection in the form of covenants. Investors' attraction to riskier credit also spawned greater issuance in assets such as payment-in-kind notes and mortgage real estate investment trusts (mREITs).
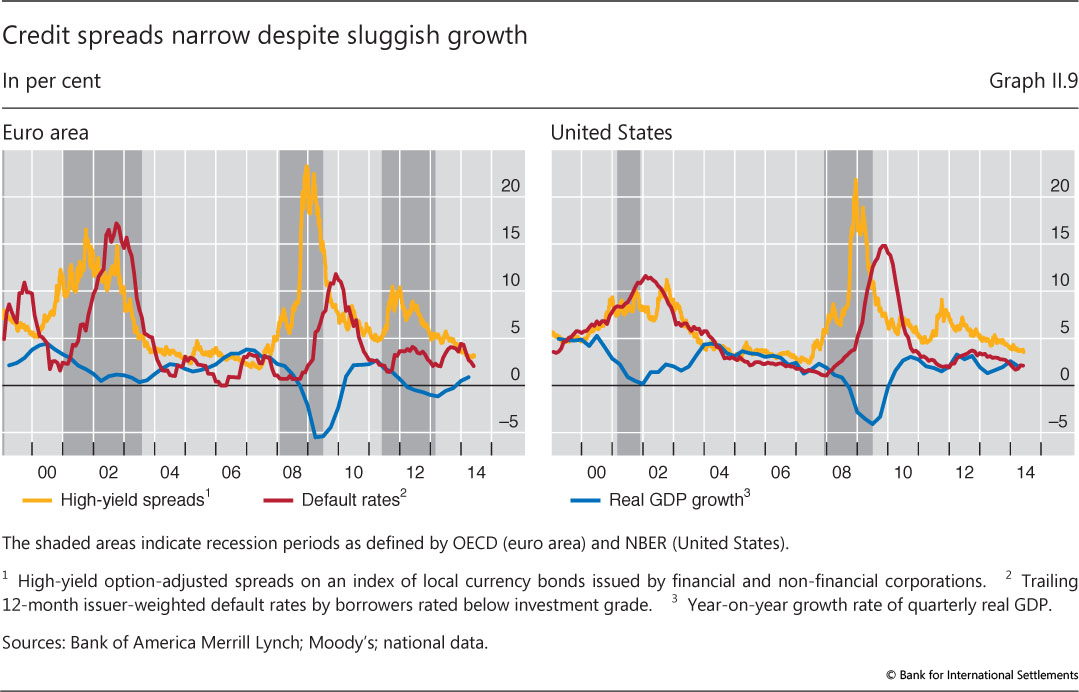
The ongoing search for yield may also have affected the relationship between credit spreads and fundamentals. Low GDP growth typically goes hand in hand with high default rates and wider credit spreads, and such was the case in the years before 2011 (Graph II.9). After the crisis-related surge in 2009-10, default rates declined and stayed low for three years, justifying tighter spreads, which have continued to track falling default rates in the United States. Beginning in 2011, however, default rates in the euro area edged up when the region entered a two-year recession, but spreads there have still continued to decline. Low corporate bond yields not only reflect expectations of a low likelihood of default and low levels of risk premia, but also contribute to the suppression of actual default rates, in that the availability of cheap credit makes it easier for troubled borrowers to refinance. The sustainability of this process will ultimately be put to the test when interest rates normalise.
Fuelled by the low-yield environment and supported by an improving economic outlook, equity prices on the major exchanges enjoyed a spectacular climb throughout 2013 (Graph II.2, right-hand panel). In many equity markets, the expected payoff from dividends alone exceeded the real yields on longer-dated high-quality bonds, encouraging market participants to extend their search for yield beyond fixed income markets. Stocks paying high and stable dividends were seen as particularly attractive and posted large gains.
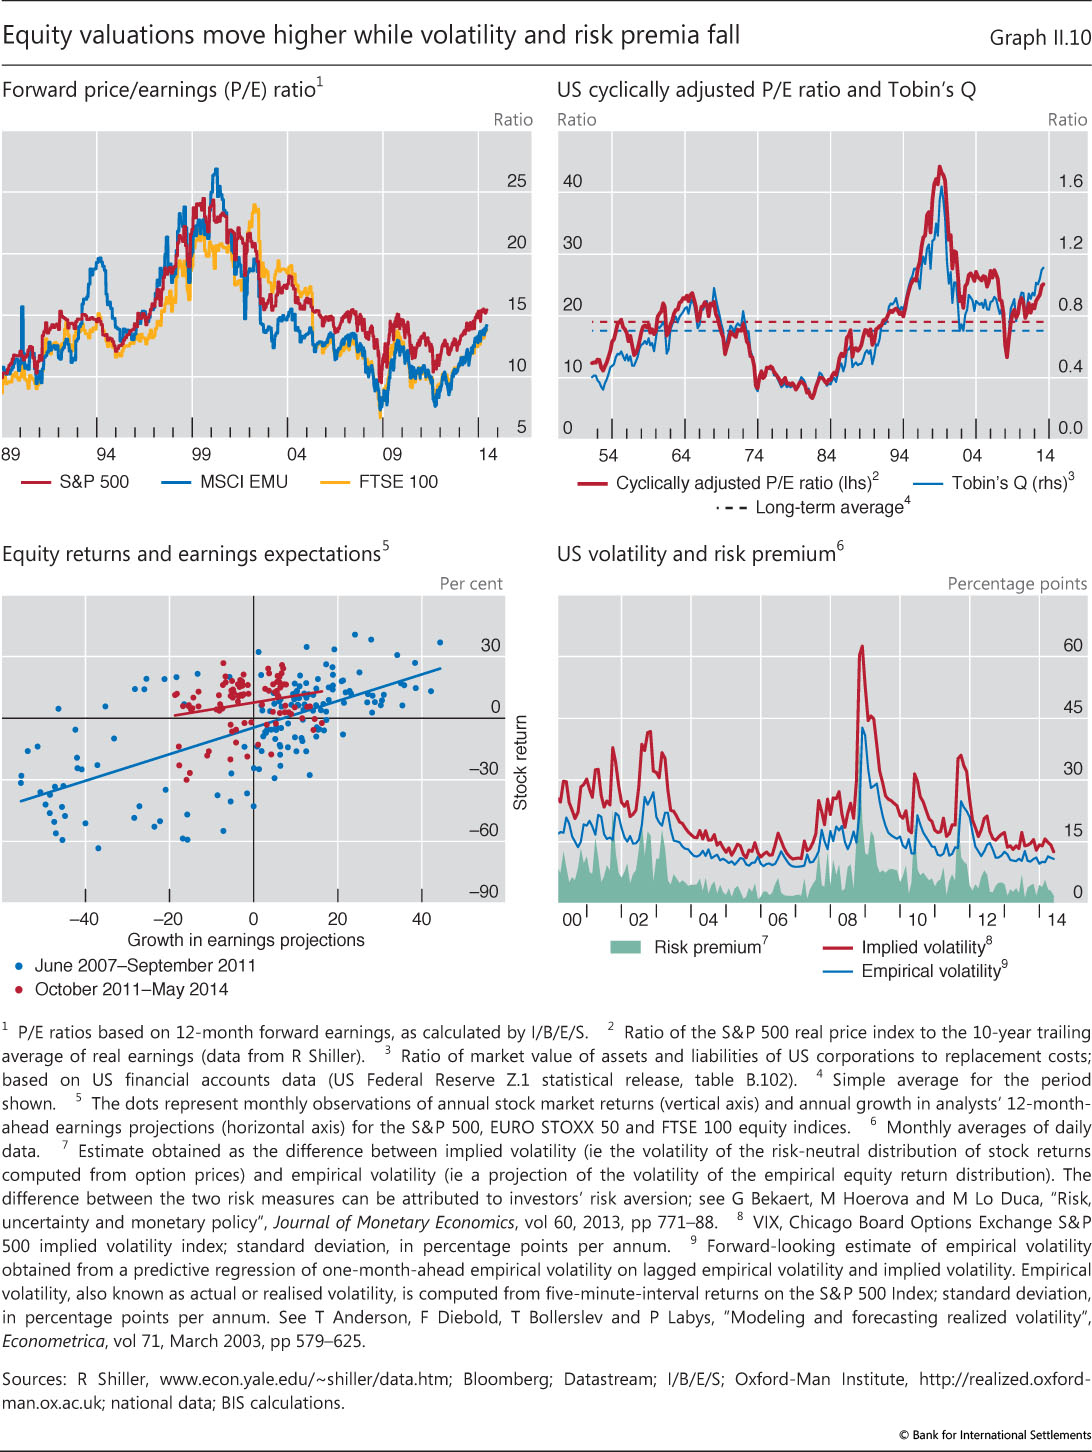
As major equity indices in the advanced economies reached record highs, prices rose by more than the expected growth in underlying fundamentals. Conventional valuation metrics such as the price/earnings ratio and Tobin's Q moved above their longer-term averages (Graph II.10, top panels). The S&P 500 Index, for instance, gained almost 20% in the 12 months to May 2014, whereas expected future earnings grew less than 8% over the same period. The cyclically adjusted price/earnings ratio of the S&P 500 stood at 25 in May 2014, six units higher than its average over the previous 50 years. Prices of European equities also rose over the past year, by more than 15%, despite low growth in the aftermath of the euro area debt crisis and a drop of 3% in expected earnings. Between June 2007 and September 2011, the crisis-related plunge in equity prices and the subsequent rebound were associated with shifts in investor expectations about growth in future corporate earnings (Graph II.10, bottom left-hand panel, data in blue). Since then, earnings expectations have been less influential in driving stock prices (as illustrated by the flatter slope of the red line relative to the blue line in Graph II.10, bottom left-hand panel).
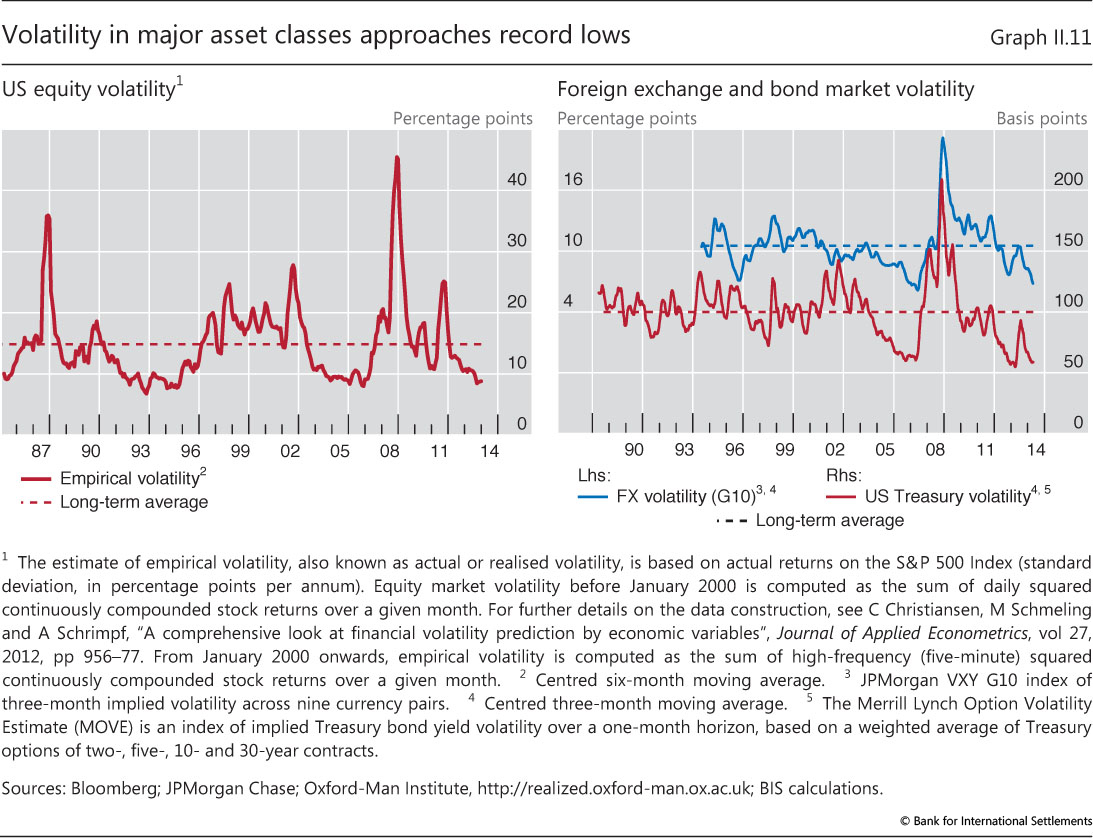
The recent rise in equity returns was accompanied by a growing appetite for risk and historically subdued levels of volatility (Graph II.10, bottom right-hand panel, and Graph II.11, left-hand panel). By early June 2014, the option-implied volatility index (VIX) dipped under 11% - below its 2004 to mid-2007 average of 13.6% and some 10 percentage points lower than in mid-2012. The volatility of actual stock market returns fell to levels last seen in 2004-07 and during the equity boom in the late 1990s (Graph II.11, left-hand panel).
The strength of investors' risk appetite is apparent from a comparison of two risk measures, implied volatility and actual ("empirical") volatility.3 Implied volatility, a forward-looking measure derived from option prices, declined more than investors would have expected when projecting actual volatility from past returns. A gauge of risk premia, computed as the difference between implied and empirical volatility, has recently fluctuated near post-crisis lows. This offers yet another sign of investors' elevated appetite for risk, as it suggests that investors were relatively less inclined to insure themselves against large price fluctuations via derivatives (Graph II.10, bottom right-hand panel).
In fact, low levels of implied and actual volatility prevailed well beyond equity markets (Graph II.11). While the ongoing recovery went hand in hand with lower variability in macroeconomic and firm-specific fundamentals, central banks also played an important role in keeping volatility low. Asset purchases and forward guidance removed some of the uncertainty about future movements in bond yields and thereby contained the amplitude of swings in bond prices. US bond market volatility accordingly continued to fall, reaching its lowest level since 2007, after spiking during the sell-off in mid-2013 (Graph II.11, right-hand panel). At the same time, implied volatility in currency markets declined to levels last seen in 2006-07, while the volatility in credit markets (computed from options on major CDS indices referencing European and US corporations) fell to post-crisis lows.
The developments in the year under review thus indicate that monetary policy had a powerful impact on the entire investment spectrum through its effect on perceived value and risk. Accommodative monetary conditions and low benchmark yields - reinforced by subdued volatility - motivated investors to take on more risk and leverage in their search for yield.
1 See R Rajan, "Has financial development made the world riskier?", European Financial Management, vol 12, no 4, 2006, pp 499-533; T Adrian and H S Shin, "Financial intermediaries and monetary economics", in B Friedman and M Woodford (eds), Handbook of Monetary Economics, vol 3, 2010, pp 601-50; and C Borio and H Zhu, "Capital regulation, risk-taking and monetary policy: a missing link in the transmission mechanism?", Journal of Financial Stability, vol 8, no 4, 2012, pp 236-51. For a comprehensive review of the empirical evidence on the risk-taking channel of monetary policy, see F Smets, "Financial stability and monetary policy: how closely interlinked?", Sveriges Riksbank Economic Review, 2013:3, special issue.
2 More specifically, intermediaries with fixed liabilities (eg insurance companies and pension funds), or asset managers promising clients a fixed return, may respond to the low-rate environment by taking on more duration or credit risk (within the constraints of the regulatory framework or investment mandate). Compensation practices in the asset management industry linking pay to absolute measures of performance may also play an important role in driving a search for yield among fund managers. For a discussion of several institutional factors and incentives contributing to the search for yield phenomenon, see eg R Greenwood and S Hanson, "Issuer quality and corporate bond returns", The Review of Financial Studies, vol 26, no 6, June 2013, pp 1483-525.
3 This indicator of risk tolerance is commonly referred to as the variance risk premium. See T Bollerslev, G Tauchen and H Zhou, "Expected stock returns and variance risk premia", The Review of Financial Studies, vol 22, no 11, November 2009, pp 4463-92; and G Bekaert, M Hoerova and M Lo Duca, "Risk, uncertainty and monetary policy", Journal of Monetary Economics, vol 60, no 7, October 2013, pp 771-88.