Uneasy calm gives way to turbulence
The Federal Reserve's interest rate lift-off in December did little to disturb the uneasy calm that had reigned in financial markets in late 2015. But the new year had a turbulent start, featuring one of the worst stock market sell-offs since the financial crisis of 2008.
At first, markets focused on slowing growth in China and vulnerabilities in emerging market economies (EMEs) more broadly. Increased anxiety about global growth drove the price of oil and EME exchange rates sharply lower and fed a flight to safety into core bond markets. The turbulence spilled over to advanced economies (AEs), as flattening yield curves and widening credit spreads made investors ponder recessionary scenarios.
In a second phase, the deteriorating global backdrop and central bank actions nurtured market expectations of further reductions in interest rates and fuelled concerns over bank profitability. In late January, the Bank of Japan (BoJ) surprised markets with the introduction of negative interest rates, after the ECB had announced a possible review of its monetary policy stance and the Federal Reserve issued stress test guidance allowing for negative interest rates. On the back of poor bank earnings results, banks' equity prices fell well below the broader market, especially in Japan and the euro area. Credit spreads widened to a point where markets fretted about a first-time cancellation of coupon payments on contingent convertible bonds (CoCos) at major global banks.
Underlying some of the turbulence was market participants' growing concern over the dwindling options for policy support in the face of the weakening growth outlook. With fiscal space tight and structural policies largely dormant, central bank measures were seen to be approaching their limits.
US monetary policy lift-off
On 16 December, the Federal Reserve raised the target range for the federal funds rate, after eight years of monetary policy easing across the major currency areas. Even after the increase, the US monetary policy stance remained highly accommodative: the increase in the federal funds target range was minimal - 25 basis points - and the stock of assets acquired over years of large-scale asset purchases was left unchanged. In real terms, the US policy rate had been negative since 2008 (Graph 1, left-hand panel). The Federal Open Market Committee (FOMC) signalled that the shortfall of inflation below its 2% objective, and uncertainty surrounding economic conditions more broadly, were expected to warrant only gradual increases in the federal funds rate. Nonetheless, the decision marked a turning point in an era of extraordinary monetary accommodation.
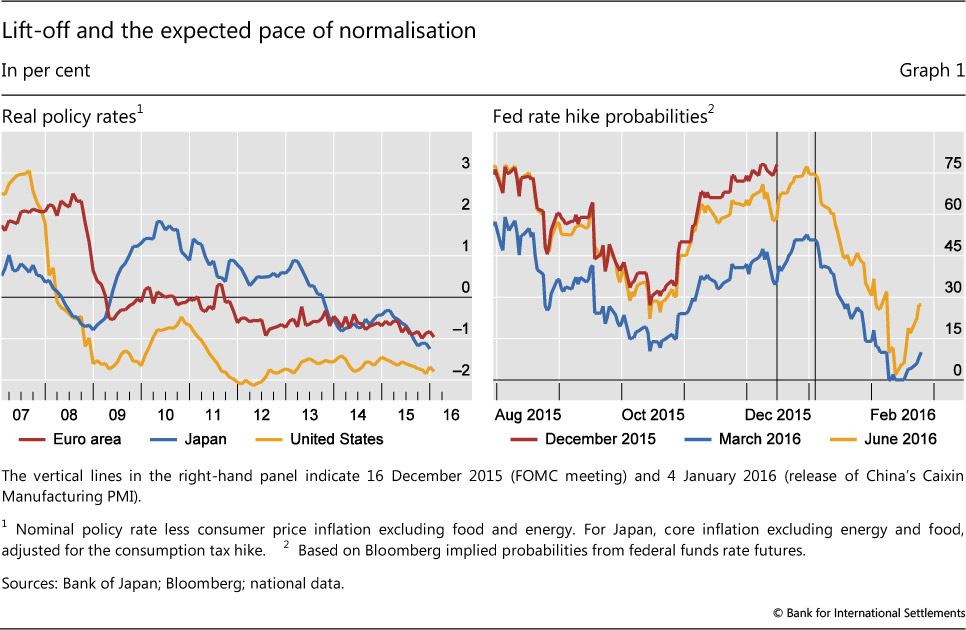
When the first US rate hike eventually came, it hardly caused a stir. The onset of the tightening cycle had long been expected, starting as early as May 2013, when expectations of an eventual "tapering" of asset purchases had reverberated through global financial markets. In the days before 16 December 2015, the futures-implied probability of a December lift-off was near 80%, reflecting confidence in the US economic outlook (Graph 1, red line in right-hand panel).1 Apart from temporary volatility around the announcement date, the yield curve barely moved. Equity markets traded sideways, as one source of uncertainty was resolved. However, other sources of uncertainty soon appeared, and have come to dominate the scene.
Turbulence spreads from EMEs to AEs
The deterioration of global growth prospects unsettled financial markets from the start of the year.
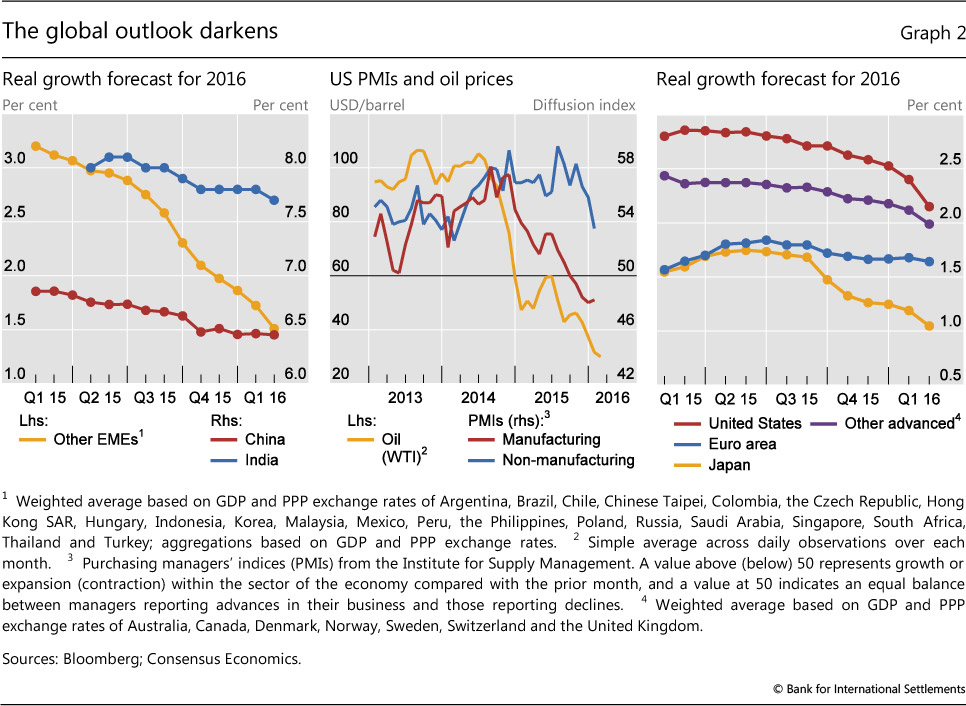
The first phase of turbulence centred on anxiety over global growth in EMEs, and China in particular. China's reported growth slowed to 6.9% in 2015, the lowest official rate since 1990. Consensus forecasts for 2016 had been falling continuously over the previous 12 months (Graph 2, left-hand panel). The softness in manufacturing had long been offset by a growing service sector, but in December the services PMI stood at its weakest level in 17 months. Concerns about a slowdown in Chinese manufacturing spread to other EMEs, for which 2016 growth forecasts had been falling rapidly in the second half of 2015 (Graph 2, left-hand panel). Worries about manufacturing were not limited to Asia: the strength of the US dollar and low oil prices cast a pall over the outlook for US manufacturing, which weakened relative to the non-manufacturing sector (centre panel). Indeed, the growth outlook for all major economic regions continued to deteriorate (right-hand panel).
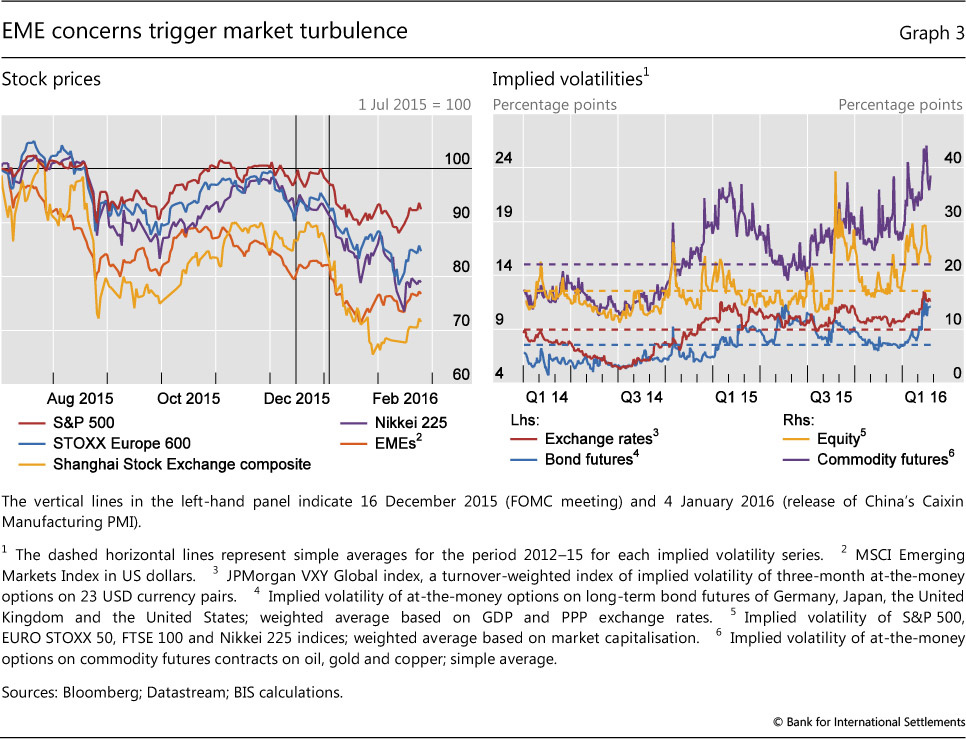
Against this backdrop, disappointing news from China triggered market turbulence on the very first trading day of the year. As a closely watched manufacturing index pointed to renewed sectoral weakness, stock markets sold off in both advanced and emerging economies (Graph 3, left-hand panel). As the Shanghai Composite plunged over 15% in the first two weeks of the year, major AE stock markets dropped by almost 10%. During the first week alone, trading in China was halted twice in response to new market mechanisms that stop trading when losses reach a certain threshold, adding to market distress. Implied volatilities soared to peaks comparable to those observed in August 2015, and well above the subdued levels of the previous three years (Graph 3, right-hand panel). But in contrast to that short-lived episode, the rout in early 2016 lasted for several weeks.
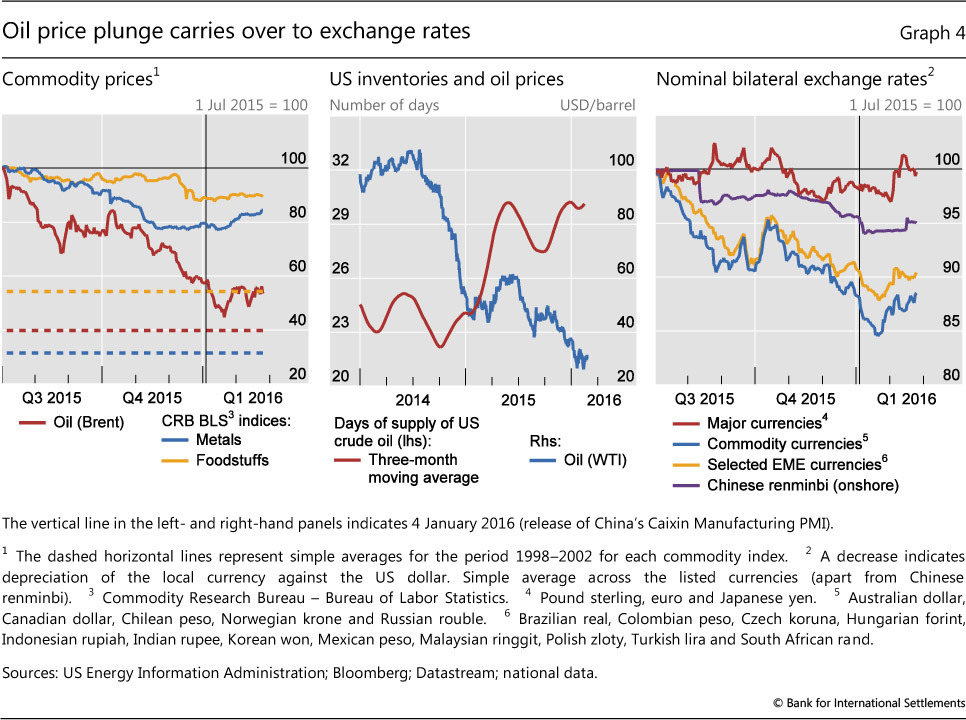
Growing concern about the global economic outlook, in turn, led to further losses in commodity markets. The prospect of weaker demand, on top of the supply glut that had become apparent over the past 18 months, hit crude oil markets hard. Oil prices extended the slide of the second half of 2015, falling below $30 per barrel for several days before rebounding to slightly above that level (Graph 4, left-hand panel). Brent settled 70% below the average nominal price observed between mid-2010 and mid-2014, the peak of the long boom in commodity prices which spanned over a decade. In fact, current oil prices barely exceed the average nominal price levels of the five years preceding 2002, right before the onset of the commodity price boom. Base metals and foodstuffs showed more resilience, not least because the respective indices had already dropped substantially prior to the recent turbulence. Their nominal prices remained well above pre-peak levels.
The heavy debt burden of producers (especially US shale companies) may have exacerbated the price decline.2 Lower oil prices reduce the cash flows from current production and raise the risk of illiquidity and possibly debt defaults. Firms facing such strains may have maintained or even raised production to preserve liquidity and reduce debt, thereby contributing to further price declines. These forces may have been at play in the US market, where the large drop in oil prices went hand in hand with continuous increases in oil inventories (Graph 4, centre panel).
In the midst of a global risk asset sell-off, a general flight to safety strengthened the US dollar. Currencies of EMEs and commodity exporters tested new lows before finding support in mid-January at levels about 3% below year-end (Graph 4, right-hand panel). Concerns about renminbi depreciation also stirred foreign exchange market volatility. On 11 December 2015, the People's Bank of China introduced the China Foreign Exchange Trade System (CFETS) reference basket, signalling a shift from a singular focus on the US dollar. Between August 2015 and late January 2016, the renminbi depreciated by 6% against the US dollar, while staying broadly stable vis-à-vis the CFETS basket. The country's foreign exchange reserves dropped by more than $300 billion over the same period, at a seemingly accelerating pace that unnerved investors. Expectations of further depreciation may have contributed to the sell-off in the domestic stock market, which in turn put further pressure on the currency. The combined impact of lower oil prices and a stronger US dollar has put substantial pressure on many EMEs at a time when the tide of global dollar liquidity appears to be turning.3
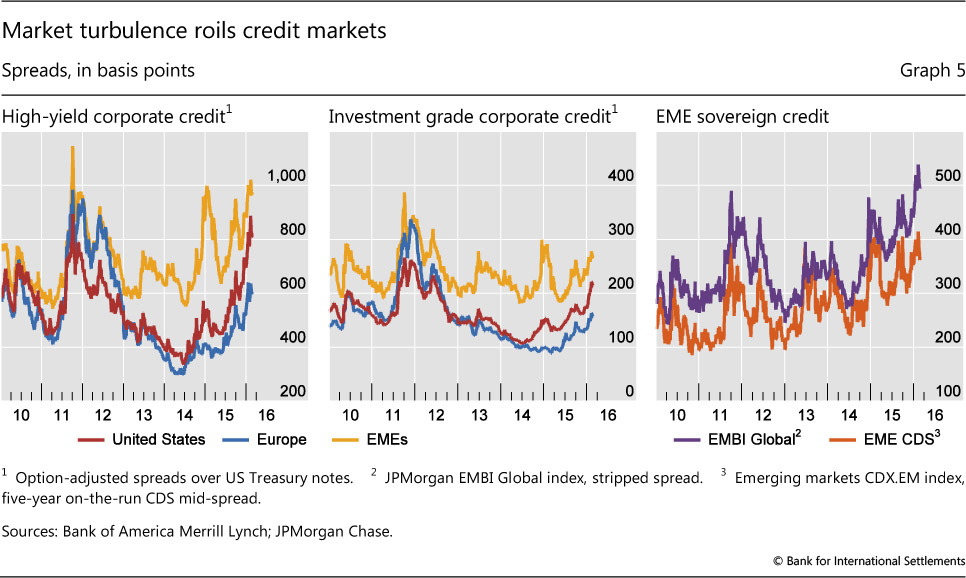
Global credit markets were also riled by turbulence. The low interest rate environment of the past few years had gone hand in hand with a search for yield that eased credit conditions, in particular for riskier borrowers. As market turbulence spread, AE high-yield credit came under unusual pressure, after having been buffeted by increasing headwinds since mid-2014 (Graph 5, left-hand panel). The widening of spreads was particularly sharp for US high-yield debt, which was weighed down by the underperformance of energy companies and fears of a rise in default rates (see Box 1). Since mid-2014, the US high-yield spread more than doubled, reaching levels comparable to the peaks observed during the European debt crisis in 2011. By comparison, the widening of corporate spreads was more moderate in Europe, with high-yield spreads halfway to their 2011 peaks. The divergence between the investment grade spreads across the two regions coincided with the onset of the oil price plunge in mid-2014, possibly reflecting concerns over contagion from the oil sector to other parts of the US economy (Graph 5, centre panel). Sovereign credit spreads in EMEs also widened during the initial weeks of 2016, comfortably surpassing the heights recorded in 2011 (right-hand panel).
The monetary policy landscape across EMEs varied, reflecting the role played by commodities, exchange rates and other drivers of inflation. Central banks in emerging Asia and Europe, whose economies mostly benefited from the commodity price plunge, kept their monetary policies unchanged despite substantial currency depreciation. Commodity exporters, by contrast, tightened or signalled an inclination to tighten rates, as currency depreciation triggered strong inflationary pressures in spite of slowing economic activity. For most countries, however, the challenging global backdrop for exchange rates left limited space for monetary stimulus.
Box 1
Tensions in high-yield bond markets
Ben Cohen and Gianpaolo Parise
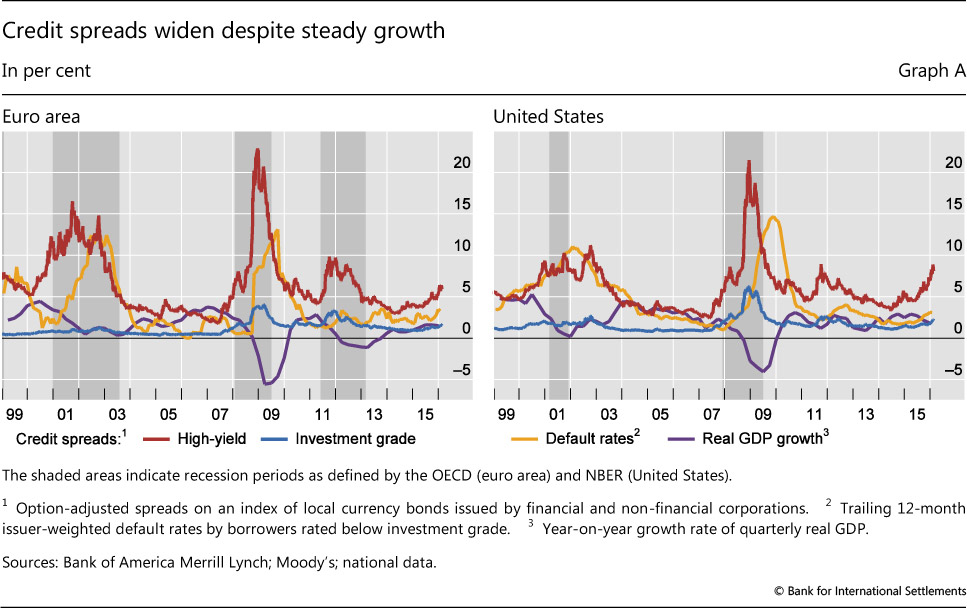
The high-yield debt market was subject to significant tensions in 2015. The BofA Merrill Lynch US High Yield Index fell 4.6% and high-yield credit spreads exceeded 5% in Europe and 7% in the US (Graph A). At the end of 2015, market turbulence affected a number of specialised investment funds and severe investor redemptions forced them to try to unload illiquid assets as prices plunged. In the second week of December, the Third Avenue Focused Credit Fund stopped fulfilling investor sell orders and announced plans to liquidate its whole portfolio in an orderly fashion within one year. In the days following the events at Third Avenue, other high-yield oriented funds, including funds managed by Sunlion Capital Partners, Lucidus Capital Partners and Whitebox Advisors, either suspended redemptions or set plans to liquidate their holdings.
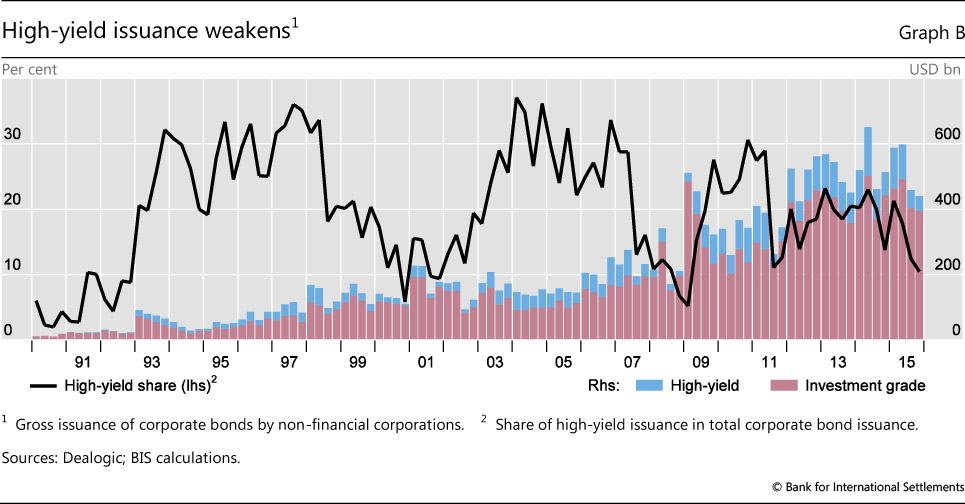
As the difficulties on the demand side of the market emerged, the issuance of new high-yield securities slowed. While corporate bond issuance remained strong, issuance in the high-yield segment contracted, particularly in the second half of the year. From a low of $98 billion in 2008, high-yield debt issuance had exceeded $400 billion annually in 2013-14, before falling to $334 billion in 2015 (Graph B).
The ongoing turmoil in the energy sector is central to explaining the tensions experienced by high-yield debt securities. The Merrill Lynch HY Energy Index plummeted in 2015, underperforming both US Corporate High Yield and Emerging Markets High Yield indices. Even though previous crises have also inflicted substantial losses on high- yield securities, the tensions in the energy sector are specific to the most recent period (Graph C). An increasing number of defaults toward the end of 2015, however, hints at the possibility of broader fragilities (Graph C, right-hand panel).
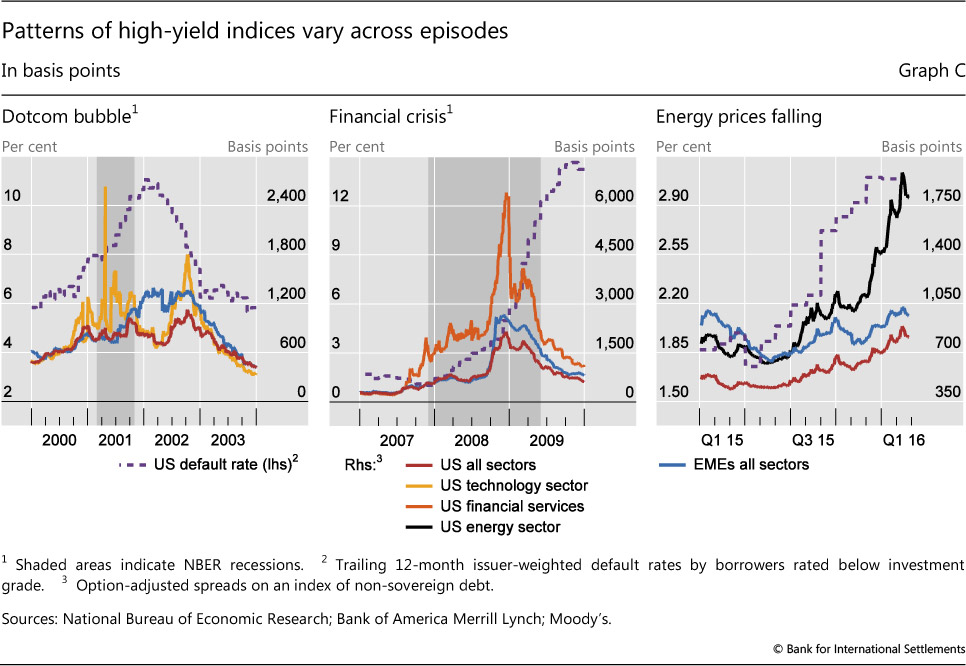
One interpretation of recent events is that the high-yield rout is an isolated development, driven by US oil industry weakness; another is that this is a "canary in the coal mine" moment signalling broader fragilities. Recent experience, supported by academic research, suggests that sharp increases in credit spreads are a leading indicator of recessions. This is the case even when wider spreads initially reflect sector-specific strains: high-yield credit spreads started to rise in the technology sector at the beginning of 2000, just before the burst of the tech bubble (Graph C, left-hand panel), while financial sector high-yield spreads rose in 2007, before the Great Financial Crisis (centre panel). Spreads of other risky securities in these episodes only started to widen when the broader economy turned down. More recently, while spreads have widened dramatically since the second quarter of 2015 in the energy sector, other credit spreads, including those on emerging market corporate debt, have crept up much more gradually (right-hand panel).
A Estrella and G Hardouvelis, "The term structure as a predictor of real economic activity", Journal of Finance, vol 46, 1991, pp 555-76; A Estrella and F Mishkin, "Predicting US recessions: financial variables as leading indicators", Review of Economics and Statistics, vol 80, 1998, pp 45-61; and J Faust, S Gilchrist, J Wright and E Zakrajsek, "Credit spreads as predictors of real-time economic activity: a Bayesian model-averaging approach", The Review of Economics and Statistics, vol 95, no 5, 2013.
Turbulence extends as markets focus on banks
The ongoing financial turbulence against a weakening global backdrop gave way to a second phase of turbulence, in which markets focused on the possibility that central banks could drive interest rates further into negative territory and, in the process, add to the persistent weakness in bank profitability.
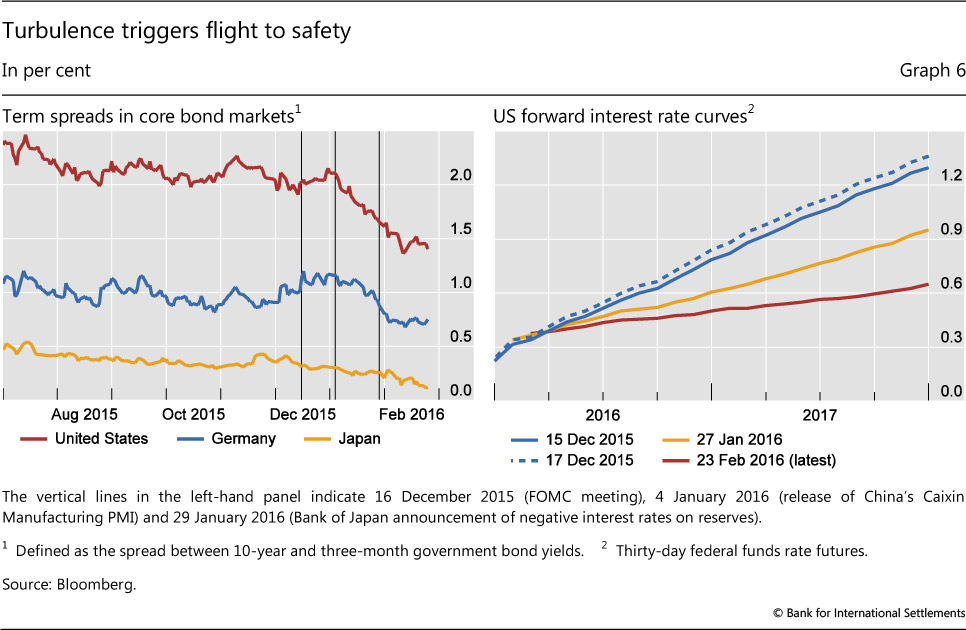
As turbulence rippled through emerging and advanced financial markets, the resulting flight to safety helped flatten yield curves in core bond markets. By late January, the term spread between the 10-year US Treasury bond and the three-month bill had dropped more than 50 basis points from the end of 2015 (Graph 6, left-hand panel) and the comparable spread for German bunds retreated by almost 40 basis points. In the past, flattening yield curves and widening credit spreads have often heralded weakness in economic activity (see Box 1).
These developments sowed doubt among market participants about the positive outlook for the US economy, on which the Federal Reserve had predicted the December lift-off. External weakness, a strong dollar and widening credit spreads threatened to smother the recovery. With this new backdrop, market expectations of future rate hikes declined to a point that became inconsistent with the prospect of three to four rate increases in 2016 implied by FOMC participants' monetary policy assessments (Graph 1, right-hand panel). By early February, the probability of a rate hike in March had dropped from 50% to near zero, and even a June hike came to be regarded as unlikely. The turbulence led markets to price in a very gradual pace of tightening. In contrast to expectations at the time of the December lift-off, by late January markets expected the federal funds rate to stay below 1% throughout 2017, and in February the expected pace of tightening fell even further (Graph 6, right-hand panel).
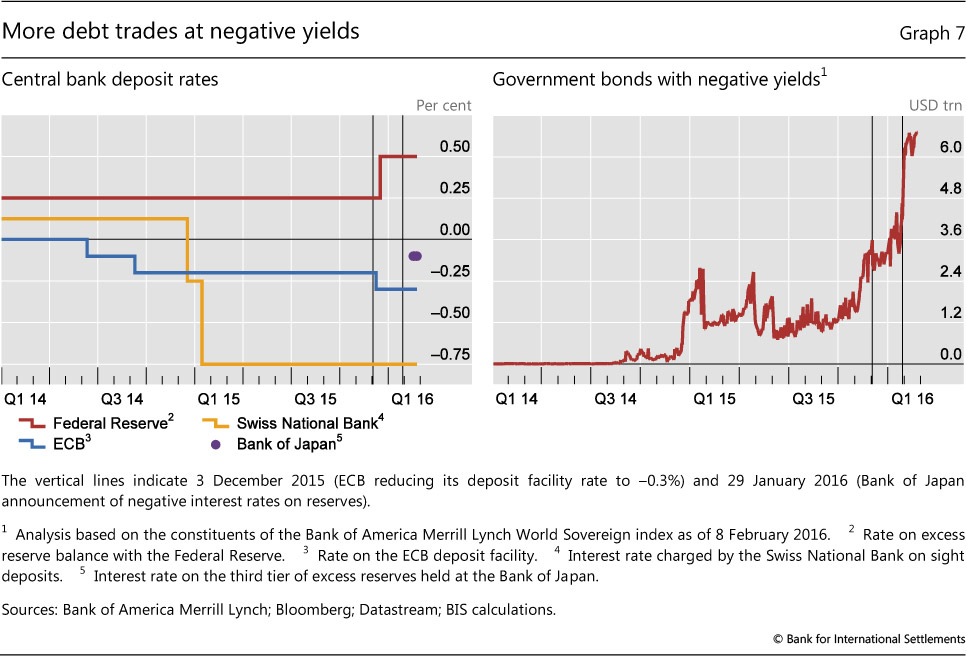
Policymakers in major AEs reacted to these developments with moves that were taken as pointing towards further accommodation. At its January meeting, the FOMC acknowledged the global financial turbulence and possible repercussions on the US economy, but did not signal a change to the previous guidance. But on 28 January markets took note of the Fed's announcement of the guidelines for the 2016 banking stress test, which asked banks to consider the potential impact of negative Treasury bill rates as part of a "severely adverse scenario". The previous week, the ECB left its monetary stance unchanged but announced a review in March, with markets regarding further accommodation as more likely. The BoJ surprised the markets on 29 January by introducing negative interest rates charged on the excess over required reserves and the balances accumulated by financial institutions under its quantitative and qualitative easing programme (QQE) and loan support programme. The BoJ thus joined the ECB and the Swiss National Bank in imposing negative rates on bank reserves (Graph 7, left-hand panel).4
The BoJ decision had an outsize effect on financial markets. Japanese government bond yields fell to record lows across the curve, with negative yields at all maturities out to 10 years. And after a fleeting rebound in the Japanese stock market and a short-lived depreciation of the yen, Japanese banks' stock prices fell sharply. This occurred even though the BoJ measure was designed to minimise the immediate impact on bank profitability.
As markets digested the implications of negative policy rates in Japan, they appeared to price in a further set of easing moves more generally. In a matter of days, the universe of sovereign bonds trading at negative yields expanded from $4 trillion to more than $6.5 trillion (Graph 7, right-hand panel). By early February, almost one quarter of the outstanding stock of sovereign bonds in the Merrill Lynch sovereign fixed income index were trading at negative yields. Among Japanese government bonds, that share exceeded 60%.
As the universe of bonds yielding negative rates expanded, markets became increasingly aware of new constraints and trade-offs that might limit policy options. By some reports, the pool of euro-denominated debt yielding less than the ECB deposit rate (currently at -0.3%) surged by a third after the ECB's policy meeting on 21 January. The rules governing the ECB's asset purchase programme make such securities ineligible for future ECB purchases. If price dynamics continued to shrink the universe of eligible securities, the scope of the asset purchase programme would thus narrow, unless the deposit rate were pushed further into negative terrain - which, in turn, was seen as possibly eroding euro area banks' future net interest margin.
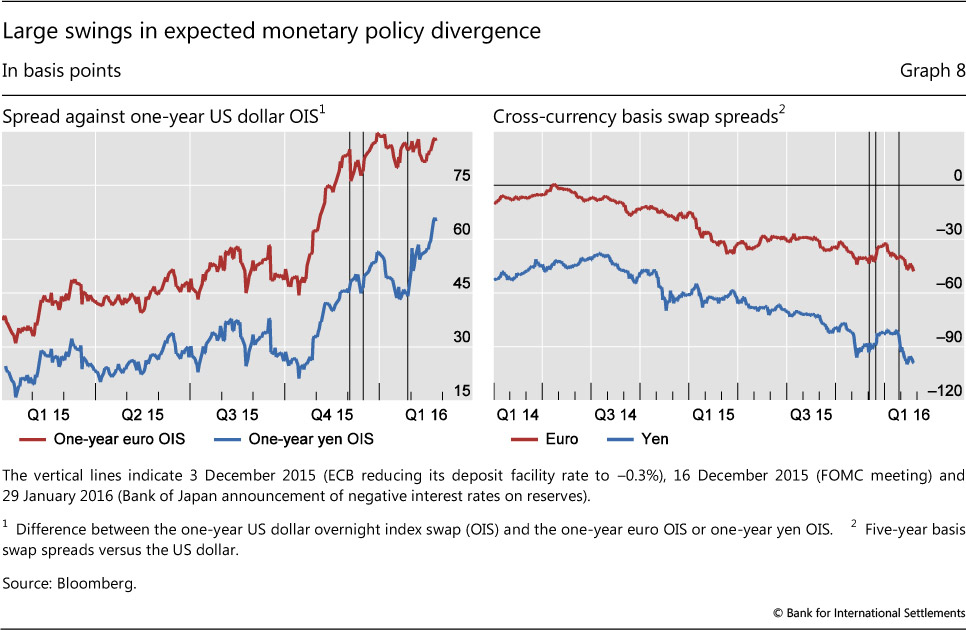
These developments resulted in large swings in the extent of the divergence that market expected between G3 monetary policies going forward. A simple measure compares the expected average overnight rates over one year in the United States with the corresponding averages for the euro area and Japan (Graph 8, left-hand panel). This measure of policy divergence rose in late 2015 on the way to US lift-off, and declined in January as markets reduced their expected pace of US tightening. With the BoJ's foray into negative rates, however, the expected divergence widened again relative to the United States. Roughly in line with the divergence in monetary policies across the major currency areas, cross-currency basis swap spreads widened against the dollar, by about 15 basis points in the case of the yen, and by 8 basis points for the euro (right-hand panel).5
As stress reigned in financial markets and the global outlook deteriorated, tensions spread to the equity and debt obligations of major global banks. European bank shares had been trailing the broader market since mid-2015, but the gap widened in 2016 (Graph 9, left-hand panel). US banks also underperformed the S&P 500 index by 10% since early January, but Japanese banks plunged 15% vis-à-vis the Nikkei after the BoJ announcement.
Alongside falling share prices and widening credit default swap (CDS) spreads, the market for contingent convertible bonds (CoCos) of European banks took a remarkable dive (Graph 9, centre panel). The limited impact on senior bank debt spreads suggests that the size or quality of capital buffers were not the primary concern even as CDS spreads widened. But the possibility that European banks might have to suspend dividend distributions and CoCo coupon payments set in motion a dynamic that reinforced the plunge in bank valuations across asset classes (Box 2).
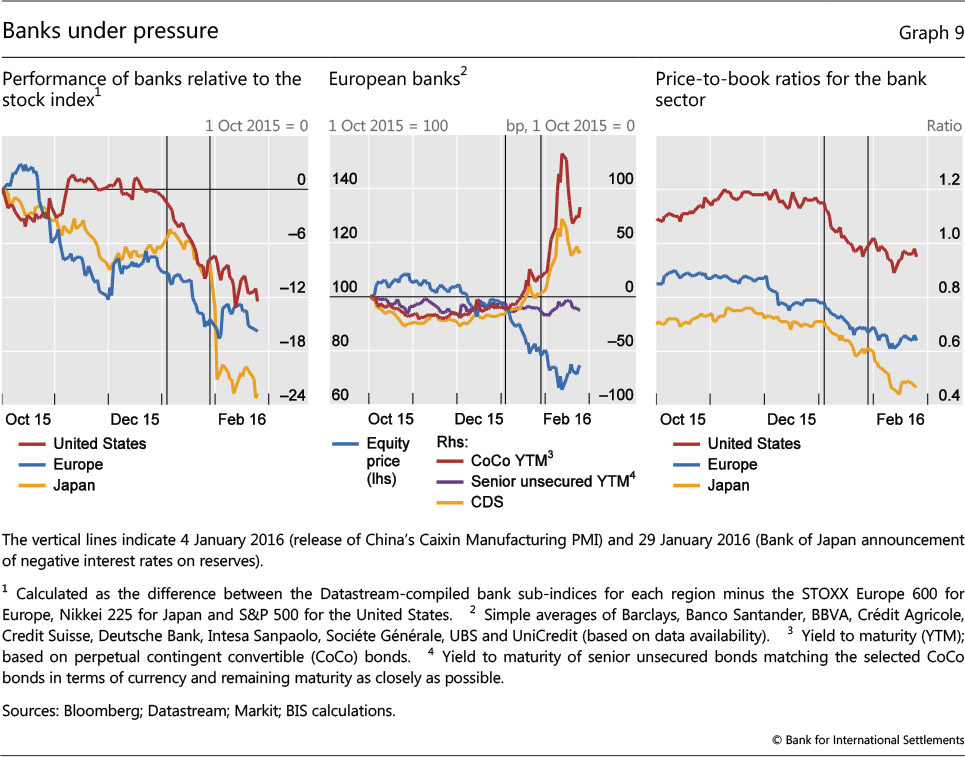
These developments led market participants to focus on bank profitability. The doubts markets harbour about the prospects of European and Japanese banks, in particular, have long been reflected in the extent to which their share prices traded below their book value (Graph 9, right-hand panel). Price-to-book ratios slid further during the turmoil, but the persistent gap between European and Japanese banks vis-à-vis their US peers remained. Banks' reluctance to pass negative rates on to depositors contributed to the gradual erosion in net interest income (Box 2).6 At the same time, concern over prospective bank earnings led market participants to look closely at the likely impact of an extended period of negative interest rates on bank profitability.
Box 2
Sell-off of European bank shares
Michael Chui
The securities of European banks were hit particularly hard in the first weeks of 2016. The STOXX Europe 600 index has fallen by 23% so far this year, and CDS and CoCo bond spreads have also risen sharply (Graph 9, centre panel). Concerns about the sector's prospects, particularly with respect to earnings, seem to have been on investors' minds. Price declines have been further exacerbated by market dynamics.
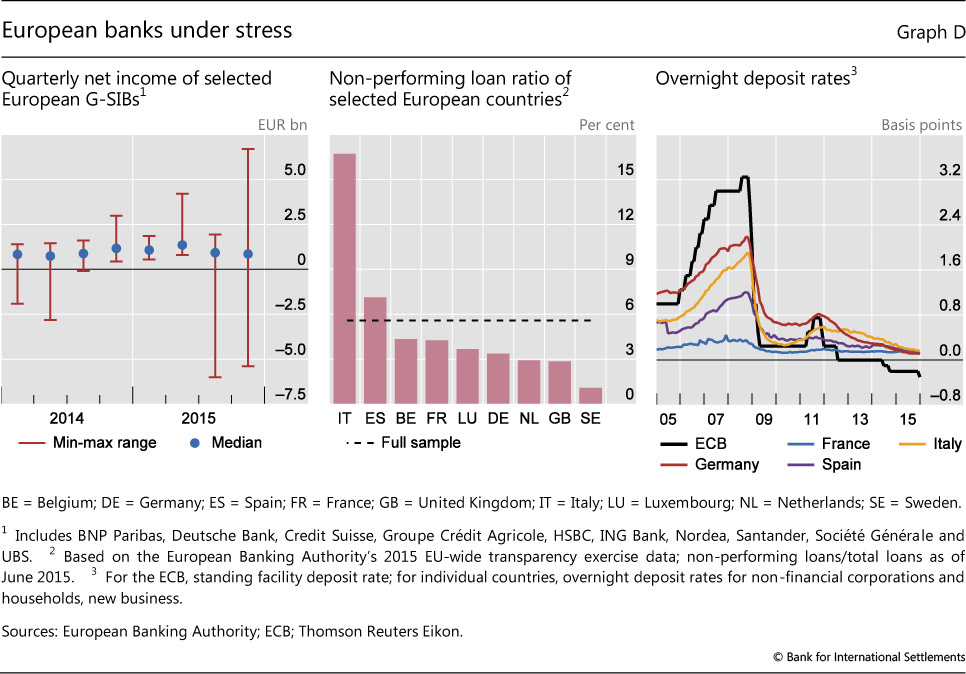
Investors' concerns about banks' condition have different facets. Several major banks reported larger losses or poor profits in the fourth quarter of 2015 (Graph D, left-hand panel). In addition, some banks are still hamstrung by the legacy of non-performing assets on their balance sheets (centre panel), and new uncertainties have emerged regarding the size of direct and indirect exposures to the energy sector.
Uncertainty about banks' earnings prospects have been heightened by the expectation that negative policy rates and exceptionally low interest rates out the yield curve may prevail for longer than originally anticipated. Interest margins have been squeezed, given banks' reluctance to pass negative rates on to depositors (Graph D, right-hand panel). Banks seem to have coped with the operational challenges so far, but this offers limited comfort if rates move lower and stay negative for a prolonged period.
Movements in the prices of bank securities have been exacerbated by market dynamics associated with the interactions between CoCos, equity and CDS. In Europe, the imposition of loss-sharing on junior creditors in recent bank resolutions and the clarification of the relevance of Tier 2 requirements for banks' ability to make coupon payments on CoCos may have focused investors' attention on potential sources of uncertainty. In particular, concerns about the likelihood of CoCo coupon cancellation amid large losses compress the value of these bonds. An actual cancellation would be a first-time event for CoCos as a new asset class. This prospect may have set in motion hedging activities, with the holders of CoCos shorting banks' equity and/or buying default protection to hedge further declines in CoCo prices, leading to a strong price co-movement of these instruments. With investors in CoCos bruised and equity prices weak, questions also arose over banks' ability to raise market-based capital in the future, if needed.
See European Banking Authority, "Opinion of the European Banking Authority on the interaction of Pillar 1, Pillar 2 and combined buffer requirements and restrictions on distributions", 16 December 2015.
Underlying some of the turbulence of the past few months was a growing perception in financial markets that central banks might be running out of effective policy options. Markets pushed out further into the future their expectations of a resumption of gradual normalisation by the Fed. And as the BoJ and ECB signalled their willingness to extend accommodation, markets showed greater concerns about the unintended consequences of negative policy rates. In the background, growth remained disappointing and inflation stubbornly below targets. Markets had seemingly become uncertain of the backstop that had been supporting asset valuations for years. With other policies not taking up the baton following the financial crisis, the burden on central banks has been steadily growing, making their task increasingly challenging.
1 See "Uneasy calm awaiting lift-off", BIS Quarterly Review, December 2015.
2 See D Domanski, J Kearns, M Lombardi and H S Shin, "Oil and debt", BIS Quarterly Review, March 2015, pp 55-65; and S Dale, "New economics of oil", presentation at the Society of Business Economists Annual Conference, London, 13 October 2015.
3 See "Highlights of global financing flows" BIS Quarterly Review, March 2016, and J Caruana, "Credit, commodities and currencies", lecture at the London School of Economics and Political Science, London, 5 February 2016.
4 A total of five central banks moved their policy rates below zero, traditionally seen as the lower bound for nominal interest rates: Danmarks Nationalbank, the ECB, Sveriges Riksbank, the Swiss National Bank and the BoJ. The implementation of negative policy rates is discussed in detail in M Bech and A Malkhozov, "How have central banks implemented negative policy rates?", BIS Quarterly Review, March 2016.
5 On the achievements in rebuilding financial strength and the challenges facing banks in advanced economies, see BIS, "Old and new risks in the financial landscape", 85th Annual Report, June 2015, pp 101-19.
6 On related dislocations in fixed income derivatives markets, see the box by S Sundaresan and V Sushko in "Uneasy calm awaiting lift-off", BIS Quarterly Review, December 2015.