Uneasy calm awaiting lift-off
The interplay between the shifting prospects for policy normalisation in the United States, emerging market (EM) weaknesses and accommodation in other major advanced economies (AEs), drove market developments in the fourth quarter of 2015.
Markets stabilised in October, following the August rout. Fears of a crisis centring on EMs faded as Chinese equity and currency markets - the rout's epicentre - entered calmer waters. Sentiment improved after policy interventions in EMEs and on expectations of continuing monetary accommodation in AEs, including the United States. Asset markets across the world staged a strong rebound and volatilities fell.
Market sentiment changed following the Federal Open Market Committee's (FOMC) October meeting and the strong US labour market report in early November. Both events raised the odds of a December rate hike in the United States. US bond yields rose and the dollar re-asserted its strength, reflecting expectations that monetary policies will diverge across the major AEs.
Although EME markets suffered a particularly sharp re-pricing, market reactions were short-lived. In the first five days following the US payroll data, equity, bond and foreign exchange markets seemed to replay the mid-2013 "taper tantrum". But in contrast to the continued deterioration that took place then, markets across the different EM asset classes largely recouped their initial losses by mid-November.
The short-lived market response might suggest that EMEs could ride out the prospect of US monetary tightening. However, less favourable financial market conditions, combined with a weaker macroeconomic outlook and increased sensitivity to US interest rates, heighten the risk of negative spillovers to EMEs once US rates do start to rise in the United States. Tighter financial conditions could also accentuate rising financial stability risks in a number of EMEs.
October rebound
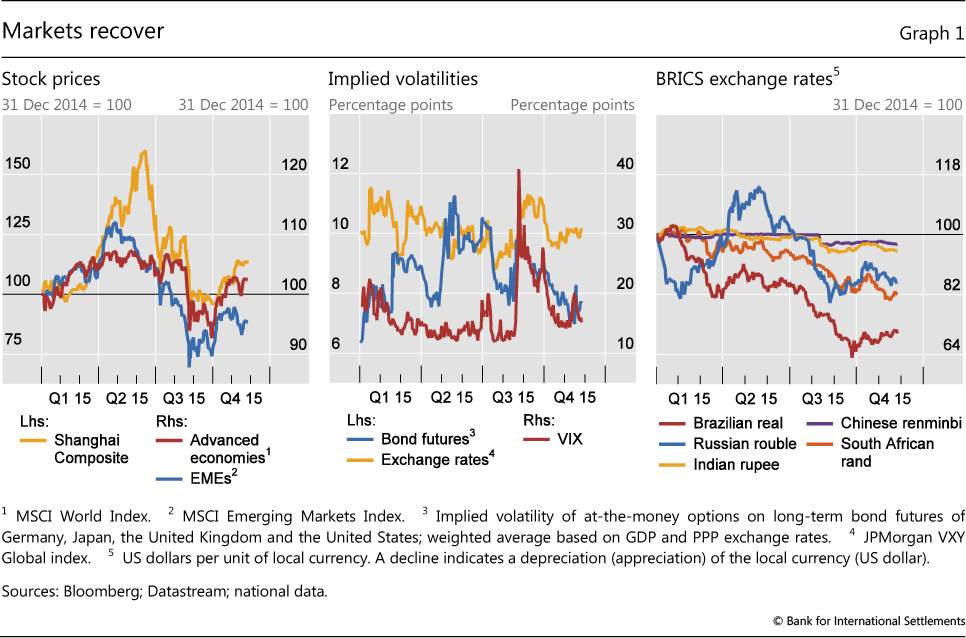
Markets bounced back in October after two turbulent months. In August and September, global financial markets saw sharp corrections in response to disappointing news from EMEs and high financial market volatility in China.1 As a result, global equity markets posted their heaviest quarterly losses since 2012 (Graph 1, left-hand panel), while implied volatilities across markets (Graph 1, centre panel) and corporate credit spreads surged.
EMs were hit hard. Equity markets plummeted, and EM currencies took another dive after months of weakness (Graph 1, right-hand panel). Market volatility and currency weakness coincided with an exodus of capital from EMEs (Graph 2, left-hand panel). EPFR reported combined portfolio outflows of more than $45 billion from EM mutual funds in August and September, much larger than during the mid-2013 taper tantrum.
In October, equity markets staged a remarkable recovery, recording their strongest one-month gain in recent years. Market nerves were partly calmed by receding fears over tail risk in China. The improvement was broad-based. European and American stocks recouped nearly all losses experienced in the third quarter, while China's stocks also made up some lost ground. In tandem, equity market volatility eased.
Other markets also recovered, although not as strongly. Spreads tightened in credit markets, but remained wider than last year. Similarly, exchange rates began to stabilise while bond and exchange rate volatilities fell. In addition, capital returned to EMEs, albeit on a modest scale.
The market rebound occurred despite few signs of improvement in the macroeconomic backdrop. Except in India, the purchasing managers' index (PMI) - a leading indicator for economic activity - remained in contractionary territory in October in the major EMEs (Graph 2, centre panel). China recorded its lowest GDP growth rate in the third quarter (6.9% annualised) since the first half of 2009, and industrial production and fixed investment stayed sluggish in October. Brazil and Russia remained deep in recession as political factors added to economic woes. These developments weighed on the outlook in the major AEs, although their PMIs signalled continued expansion.
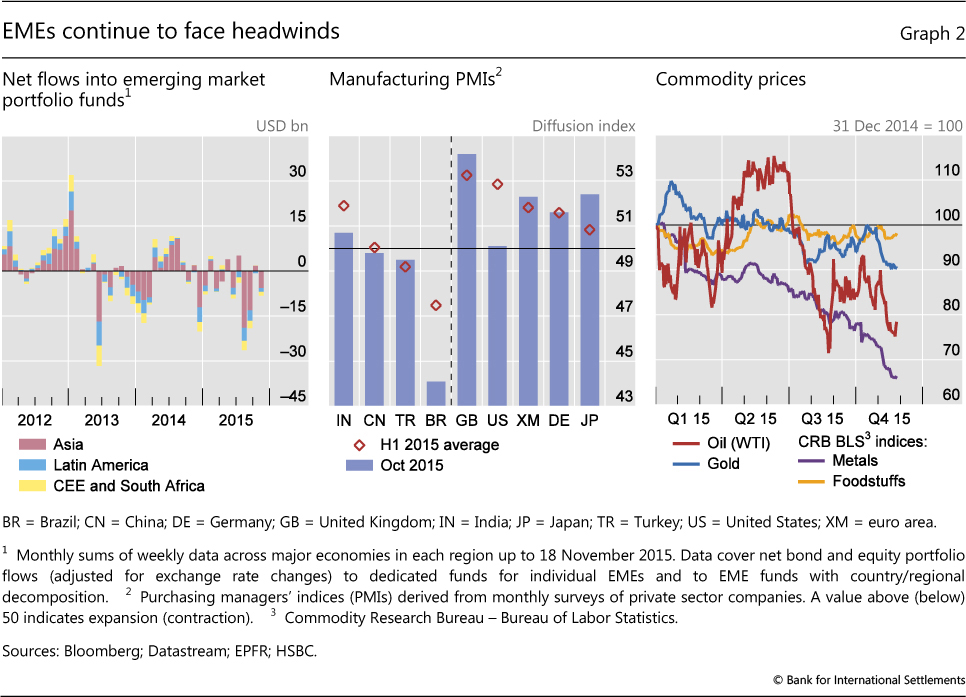
Sub-par growth expectations in EMEs also put further downward pressure on commodity prices. Oil prices staged a brief rebound in early October, but have since sunk below $50 per barrel (Graph 2, right-hand panel). Base metal prices continued to dip.
The market rebound was supported by policy interventions in major EMEs and AEs.
Several EMEs stepped up monetary accommodation to stimulate growth, while others had less room to do so for fear of sparking further currency weakness and inflation. The Reserve Bank of India cut its policy rate to a four-year low of 6.75% in late September. At the end of October, the People's Bank of China lowered the one-year benchmark lending and deposit rates by 25 basis points, the sixth rate cut during this easing cycle, and reduced the reserve requirement ratio by 50 basis points. By contrast, the policy rate in Brazil remained at 14.25% following an increase in July.
Some authorities also intervened in currency markets. By the end of October, China's foreign exchange reserves had fallen by over $450 billion from their peak in June 2014. And over one quarter of the reduction occurred in August and September 2015. Brazil undertook forward-like swap and US dollar repo operations on a large scale to provide dollar liquidity and currency risk protection for the private sector.
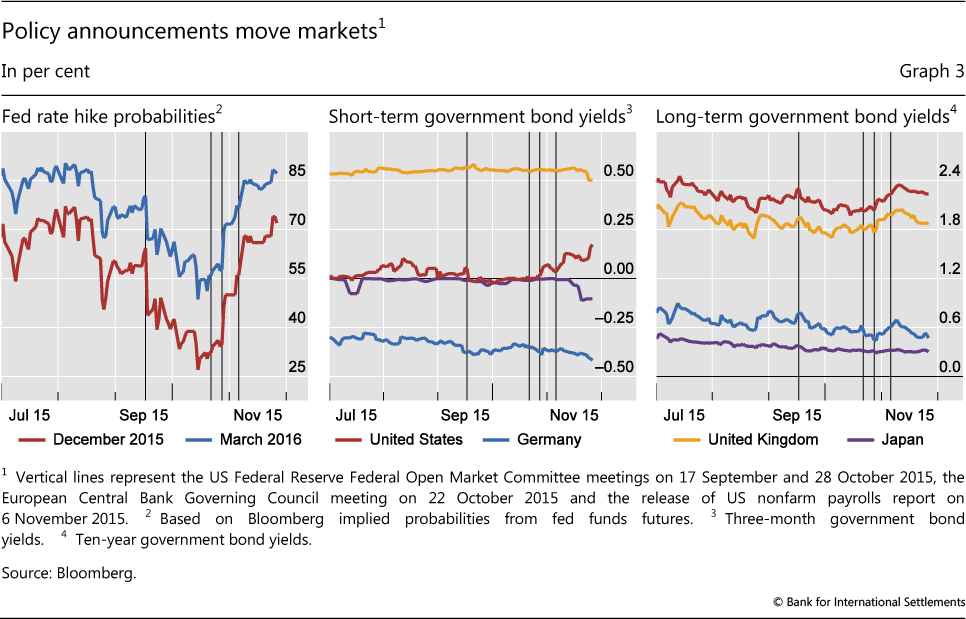
The FOMC refrained from raising its policy rate at its September meeting, significantly boosting market sentiment. The probability of a rate hike in 2015, as implied by fed funds futures, fell abruptly to 30% (Graph 3, left-hand panel) and the three-month Treasury yield declined below zero. Across the maturity spectrum, US Treasury yields remained very low in the ensuing weeks, despite the threat of a potential default as a result of political delays in lifting the government's debt ceiling (since then resolved) (Graph 3, centre and right-hand panels).
The market mood further improved after the ECB Governing Council signalled its willingness to consider further monetary stimulus following its 22 October meeting. In Europe, government bond yields fell sharply (Graph 3, centre and right-hand panels) and yields on three-month Italian bonds turned negative for the first time. As a subsequent series of speeches by ECB officials were interpreted as signals for an expansion in monetary accommodation in early December, yields continued to fall and term premia dipped further into negative territory (Graph 4, left-hand panel). By the end of November, the stock of euro area government bonds that carried negative yields had risen to more than €1.9 trillion, or approximately one third of the total market (Graph 4, centre panel).
Other major government bond markets moved less (Graph 3, centre and right-hand panels). Japanese government bonds reacted little to the anticipated continuation of quantitative easing. The Bank of Japan kept monetary stimulus unchanged despite data showing the economy slipping back into a recession in the third quarter. UK gilt yields also changed little, as markets continued to expect a rate rise in 2016.
Markets anticipate divergence
Markets changed course in late October, when the implied odds of a Fed tightening increased substantially. The first turnaround came after the FOMC's post-meeting statement, released on 28 October, was perceived as having a more hawkish tone. When the United States reported much stronger-than-expected payroll data on 6 November, the expectations of a December lift-off were further reinforced: the market-implied likelihood of a rate rise jumped to 50% immediately after the October FOMC meeting, and moved on up to almost 70% upon the release of the payroll data (Graph 3, left-hand panel).
Money and bond markets reacted to heightened rate expectations. US Treasury yields increased (Graph 3, centre and right-hand panels); on 6 November the three-month Treasury yield saw its biggest one-day leap since the taper tantrum in 2013. Yields at the long end rose too, but not as much, flattening the yield curve.
Since then, market attention has begun to shift from the timing of a lift-off to the subsequent path of the policy rate. So far, the market is pricing in a very gradual tightening with short-term rates expected to remain below 2% until the end of 2018. But the uncertainty is large. The implied volatility of two-year swaptions jumped on 6 November from already high levels that surpassed those during the taper tantrum.
Pricing adjustment was also significant in currency markets. The US dollar rose to a seven-month high against AE currencies in early November. The euro in particular lost further ground vis-à-vis the dollar as markets priced in the divergence between prospective US tightening and further accommodation in the euro area. Overall, the euro depreciated by over 10% in the first 11 months of this year. And markets have seemingly started to position themselves for a more persistently strong dollar. Having shrunk during the third quarter from their March peak, when the ECB adopted quantitative easing, net short euro positions versus the dollar started to increase again at the end of October.
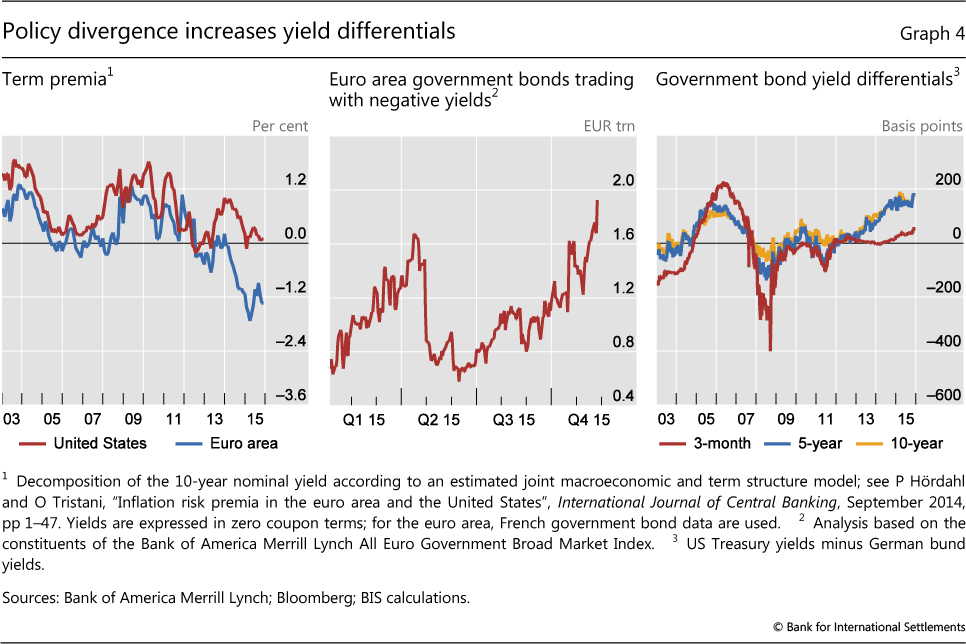
The anticipated policy divergence between the United States and the euro area led to a widening of bond differentials (Graph 4, right-hand panel). The difference between three-month government bond yields in the United States and Germany edged up, although it remained much less pronounced than during the last US tightening cycle, from 2003 until mid-2006. In contrast, the yield difference between 10-year US Treasuries and German bunds has been much wider.
The increased likelihood of policy divergence between the US, the euro area and other major currency areas also rippled through global US dollar funding markets. Historically, cross-currency basis swap spreads - a measure of tensions in global funding markets - were virtually zero, consistent with the absence of arbitrage opportunities. Since 2008, the basis has widened repeatedly in favour of the US dollar lender, ie there is a higher cost for borrowing in dollars than in other currencies even after hedging the corresponding foreign exchange risk - conventionally recorded on a negative basis (Graph 5, left-hand panel). As such, negative basis swap spreads indicate the absence of arbitrageurs to meet heightened demand for US dollar liquidity.2
The US dollar premium in FX swap markets widened substantially - in particular vis-à-vis the Japanese yen - after the odds of Fed tightening reached 70%. At the end of November, the basis swap spread of the Japanese yen versus the US dollar was minus 90 basis points, possibly reflecting in part the more than $300 billion US dollar funding gap at Japanese banks.
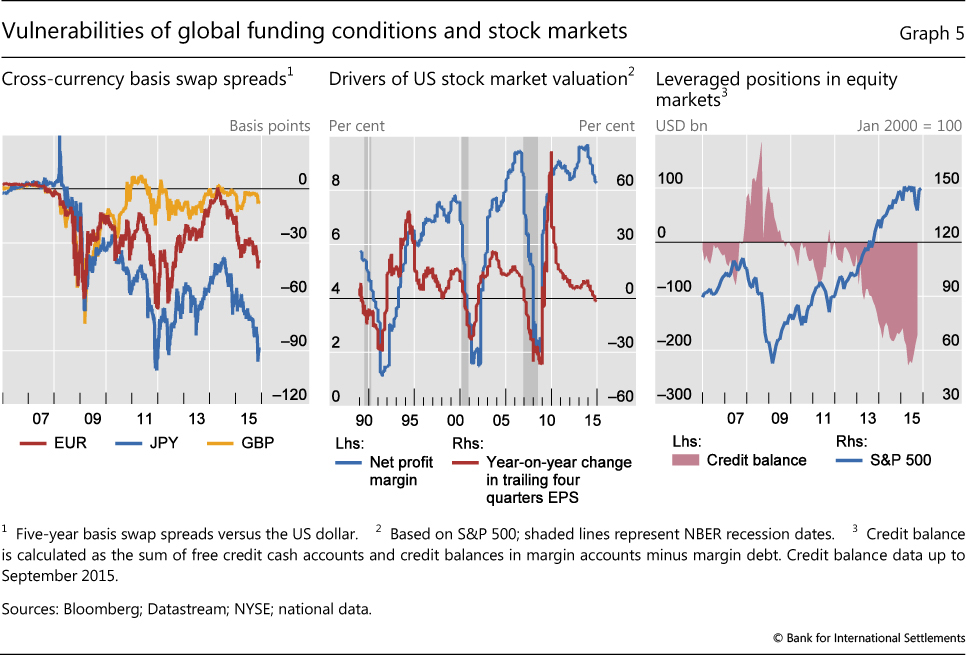
While funding continued to be available, such a large negative basis indicates potential market dislocations. And this may call into question how smoothly US dollar funding conditions will adjust in the event of an increase in US onshore interest rates. Similar pricing anomalies have also emerged in interest rate swap markets recently, raising related concerns (see box).
In contrast, the stock market's response to the increased odds of tightening was more muted. In the days following the labour data announcement, US stocks weakened, but subsequently turned despite the release of the October FOMC minutes and a stream of speeches by Fed officials which markets viewed as preparing the ground for a December rate hike. The Paris terrorist attack on 13 November and heightened tensions in Syria led to increased concerns over geopolitical risks, but had little impact on the market.
The moderate response suggests that the positive and negative effects of a rate hike are perceived as broadly balanced for equities. On the one hand, higher rates would be positive as they would confirm the strength of the US recovery. But higher rates would inter alia increase interest expenses for corporates. Low rates have helped to bolster high profit margins despite low earnings growth for US corporates in recent years (Graph 5, centre panel). Earnings in fact fell in the third quarter, by 0.6%. Historically, earnings shrinkage has signalled recessions, although few analysts now forecast such a development.
Markets also continued to be propped up by leveraged positions, which may be vulnerable to higher interest rates (Graph 5, right-hand panel). Although down from its August peak, margin debt in the US equity market remained within reach of previous record highs seen in the run-up to the dotcom bust more than 10 years ago.
Uneasy calm?
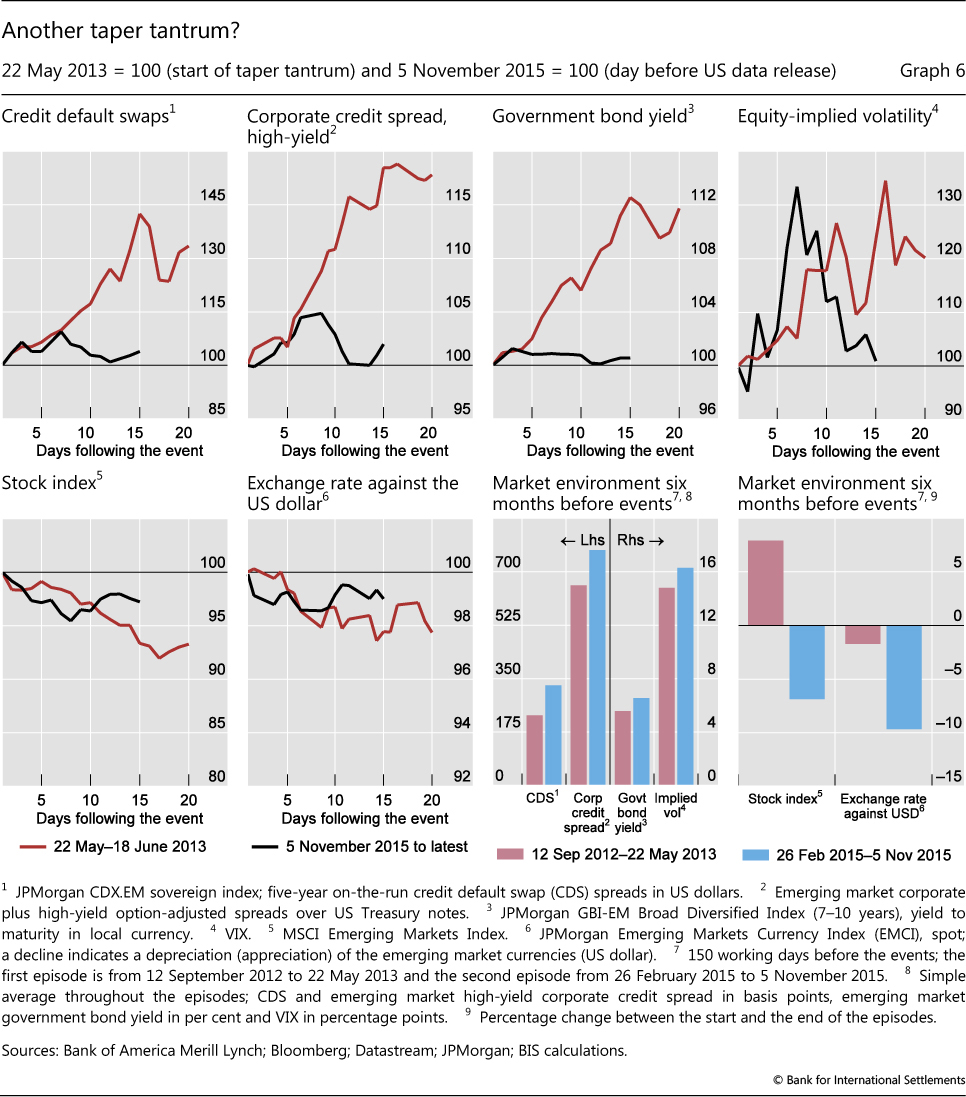
Recalling the early stages of the taper tantrum, EMEs reacted strongly to the release of the US employment data. Across markets, the reaction in the first few days after 6 November was comparable to, if not stronger than, the "taper tantrum" episode beginning in May 2013 (Graph 6), when a speech by the Federal Reserve Chairman was taken to signal an imminent shift to a less accommodative policy stance. This time, the effects on foreign exchange markets were especially pronounced.
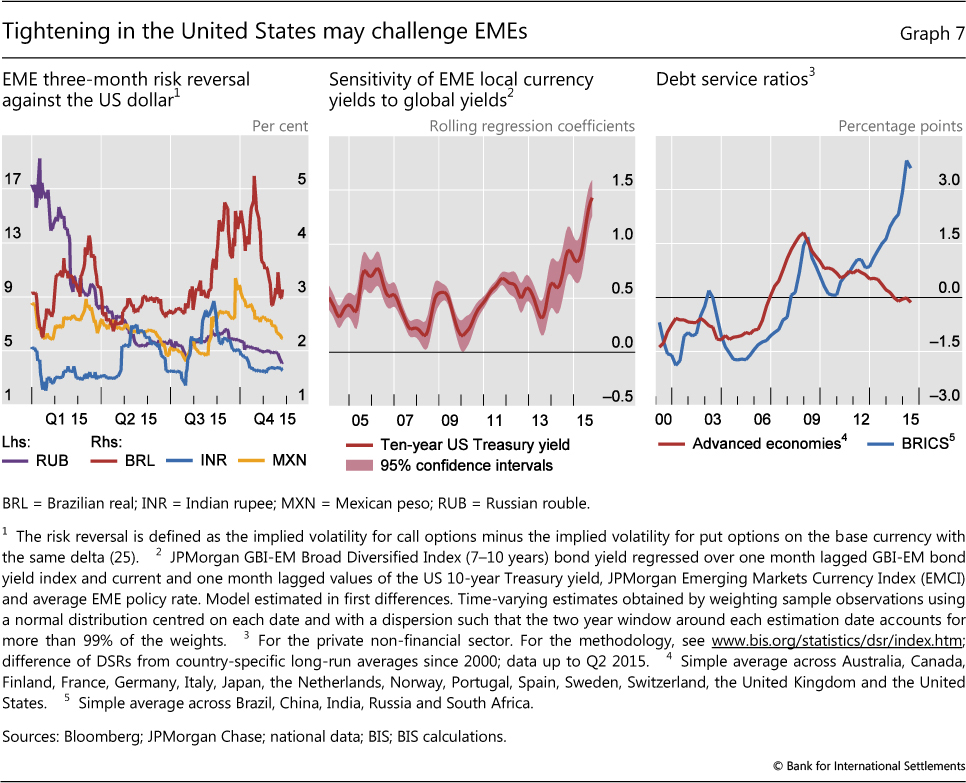
However, market reactions were short-lived this November, in contrast to the prolonged weakness seen in 2013. In less than two weeks, EM government and corporate bond markets returned to their early-November levels. Equity and foreign exchange markets recovered most of their losses. And even during the first few days, currency risk reversals over the next three months - an option-implied measure capturing the risks of large appreciations versus depreciations - hardly moved, indicating little shift in exchange rate pressures (Graph 7, left-hand panel). Overall, the short-lived market response points to resilience among EMEs to prospects of a tighter monetary policy stance in the United States.
Even though calm returned quickly to markets, compared with the initial reactions,, the recent episode took place against a less buoyant and, in some cases, weaker market backdrop than in 2013 (Graph 6, bottom centre-right and right-hand panels). In the six months leading up to the taper tantrum, equity markets gained and exchange rates were broadly stable. In contrast, in the same window before the payroll data, equity markets had sustained considerable losses and EM currencies had already depreciated by nearly 10% on average against the dollar. Funding conditions in government and corporate credit markets were also much tighter ahead of the current episode. For instance, average high-yield corporate credit spreads were 30% higher during the six months ahead of 6 November 2015 than during the run-up to the Bernanke speech. Perhaps most importantly, the taper tantrum was not preceded by a bout of market turbulence. In contrast, in August 2015 the VIX had reached levels not seen since the onset of the European debt crisis in 2011 and CDS spreads on EME sovereigns had exceeded levels experienced during the worst of the taper tantrum.
Recent dislocations in fixed income derivatives markets
Suresh Sundaresan and Vladyslav Sushko
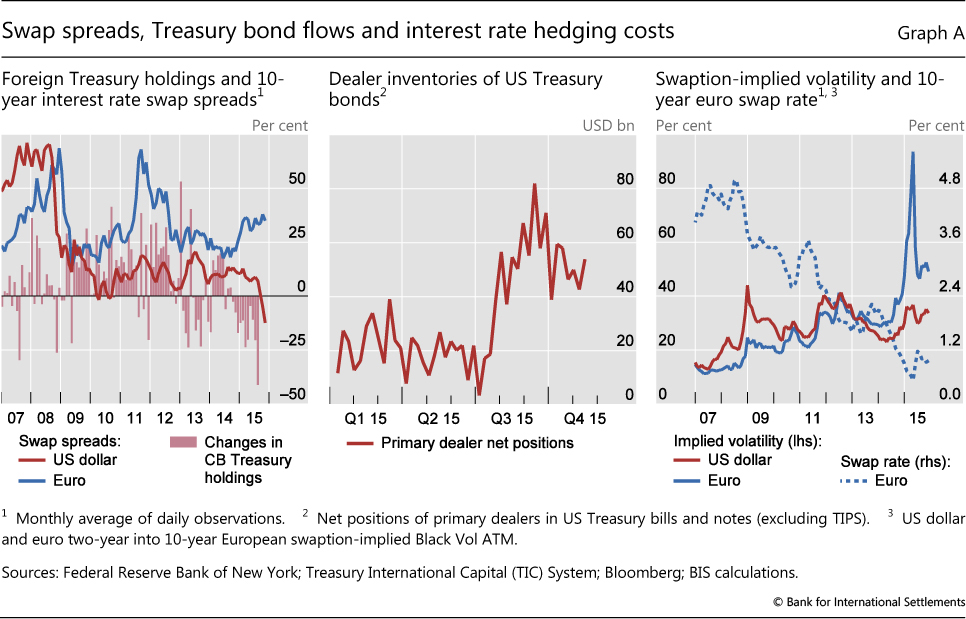
Recent quarters have witnessed unusual price relationships in fixed income markets. US dollar swap spreads (ie the difference between the rate on the fixed leg of a swap and the corresponding Treasury yield) have turned negative, moving in the opposite direction from euro swap spreads (Graph A, left-hand panel). Given that counterparties in derivatives markets, typically banks, are less creditworthy than the government, swap rates are normally higher than Treasury yields because of the additional risk premium. Hence, the negative spreads point to a possible dislocation. One set of factors relates to supply and demand conditions in interest rate swap and Treasury bond markets. In the swap markets, forces that can compress swap rates include credit enhancements in swaps, hedging demand from corporate bond issuers, and investors seeking to lock in longer durations (eg insurers and pension funds) by securing fixed rates via swaps. In cash markets, in turn, upward pressures on yields stemmed from the recent sales of US Treasury securities by EME reserve managers. The market impact of these Treasury bond sales may have been amplified by a second set of factors that curb arbitrage and impede smooth market functioning. First, the capacity of dealers' balance sheets to absorb rising inventory may have been overwhelmed by the amount of US Treasury bonds reaching the secondary market in the third quarter (Graph A, centre panel), causing dealers to bid market yields above the corresponding swap rates. Second, balance sheet constraints may have made it more costly for intermediaries to engage in the speculative arbitrage needed to restore a positive swap spread. Such arbitrage is sensitive to balance sheet costs because it requires leverage, with a long Treasury position funded in the repo market.
In the euro area, market tensions have been of a different nature. Ten-year swap spreads started to widen in early 2015, around the time when the Swiss National Bank abandoned its currency peg, then increased further over subsequent months (Graph A, left-hand panel). While past episodes of widening swap spreads can be attributed to credit risk in the banking sector, the most recent developments may have more to do with hedging by institutional investors. While swap rates also fell (Graph A, right-hand panel), the swap spread widened, indicating that cash market yields fell by even more. One possible explanation is that, as yields fall amid expectations of ECB asset purchases, institutional investors with long-duration liabilities, such as insurers and pension funds, would have been under pressure to extend their asset portfolio duration by purchasing additional longer-dated bonds, possibly compressing market yields below the swap rates.
In addition to extending portfolio duration by purchasing longer-dated bonds or entering a long-term interest rate swap as a fixed rate receiver, investors may also hedge the risk of steeply falling yields by purchasing options to enter a swap contract at a future date (swaptions). Hence, swaptions tend to become more expensive in times of stress and when investors rush to hedge duration risk.
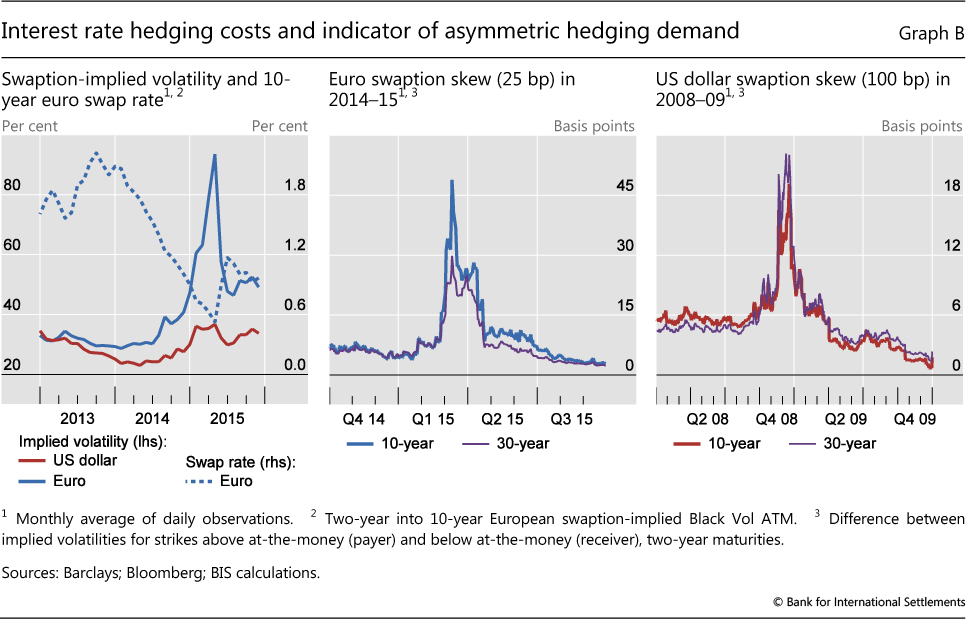
As 10-year swap rates were compressed in early 2015, the cost of such options written on euro swap rates rose by a factor of three by 20 April 2015 (Graph B, left-hand panel). Steeply rising euro rate hedging costs preceded the actual correction in yields, which started rebounding around the weekend of 18 April culminating in the so-called bund tantrum. This suggests that this year's turbulence in fixed income markets may have had its origins in derivatives and hedging activity, with reduced market depth in cash markets exacerbating the spillovers.
Such volatile movements in euro area interest rate derivatives markets raise questions about smooth pricing responses in the face of possibly transient order imbalances. Of question is liquidity in hedging markets and the capacity of traditional options writers, such as banks, to provide adequate counterparty services to institutional hedgers. Looking back at the events of late April, the rise in demand to receive fixed rate payments via swaps by institutional hedgers may have run into a lack of counterparties willing to receive floating (pay fixed) rates amid sharply falling market yields. The emergence of one-sided hedging demand pressures can be gleaned from the skew in swaption pricing (Graph B, centre and right-hand panels). The skew observed for euro rates approaching the bund tantrum resembled the developments in US dollar rates in December 2008, when US pension funds rushed to hedge interest rate risk via swaptions as market yields tumbled.
There are some elements in common with the widening of cross-currency basis swap spreads (see Graph 6 and the discussion in the text), whereby supply and demand imbalances for US dollar funding interact with factors preventing arbitrage between onshore money market rates and the swap-implied US dollar rates. See D Domanski, H S Shin and V Sushko, "Hunt for duration: not waving but drowning?", BIS Working Papers, no 519, 2015. See R Perli and B Sack, "Does mortgage hedging amplify movements in long-term interest rates?", Journal of Fixed Income, vol 13, no 3, 2003, pp 7-17. See the box by A Schrimpf and R Riordan on "Volatility and evaporating liquidity during the bund tantrum", BIS Quarterly Review, September 2015, pp 10-1.
There have also been signs that EM local currency yields are increasingly sensitive to developments in the United States. The post-crisis era has been characterised by strong international spillovers from US bond yields to emerging markets, even when those countries were at different stages of the business cycle.3 And this effect seems to have strengthened over time. A simple rolling regression of an EME bond index on US 10-year Treasury yields suggests that the potential for spillovers is larger now than it was during the taper tantrum (Graph 7, centre panel).
Weaker financial market conditions combined with an increased sensitivity to US rates may heighten the risk of negative spillovers to EMEs when US policy is normalised. On the one hand, a solid US recovery, the basis for an interest rate hike, is likely to benefit EMEs through trade channels. On the other hand, further dollar appreciation and increasing yields may pose additional risks to growth and inflation in some countries.
Tighter financial conditions may also increase financial stability risks in EMEs. Credit growth in EMEs has been strong over recent years, owing to favourable growth prospects and very easy global financial conditions. For example, the average credit-to-GDP ratio in the BRICS has risen by close to 25% since 2010. Despite low interest rates, rising debt levels have pushed debt service ratios for households and firms above their long-run averages, particularly since 2013, signalling increased risks of financial crises in EMEs (Graph 7, right-hand panel).4 Debt service ratios will inevitably increase even further when lending rates start to rise. Any further appreciation of the dollar would additionally test the debt servicing capacity of EME corporates, many of which have borrowed heavily in US dollars in recent years.5
1 See "EME vulnerabilities take centre stage", BIS Quarterly Review, September 2015.
2 See also the box on "Dislocated markets" in the September 2015 issue of the BIS Quarterly Review, pp 14-5.
3 See B Hofmann and E Takáts, "International monetary spillovers", BIS Quarterly Review, September 2015, pp 105-18.
4 For a recent discussion of early warning indicators for EMEs see Table 1 (p 33) in the "Highlights of global financing flows" in the September 2015 issue of the BIS Quarterly Review.
5 Dollar borrowing of EME corporates is further discussed in McCauley, B, P McGuire and V Sushko (2015), "Dollar credit to emerging market economies", this issue.