Highlights of the BIS international statistics
The BIS, in cooperation with central banks and monetary authorities worldwide, compiles and disseminates data on activity in international financial markets. This chapter summarises the latest data for the international banking and international debt securities indicators. Banking data are available through the second quarter of 2015 while debt securities figures are available through the third quarter. Two boxes look at foreign bank lending to China and OTC derivatives in the first half of 2015.1
Takeaways
- Cross-border bank lending contracted between end-March and end-June 2015. The decline was mainly driven by a fall in lending to advanced economies (AEs). By contrast, claims on emerging market economies (EMEs) increased modestly during the same period.
- According to the BIS locational banking statistics (LBS), cross-border claims on AEs fell by $916 billion between end-March and end-June 2015, reversing the first quarter's $761 billion expansion.
- The BIS consolidated banking statistics (CBS) suggest that the drop in lending to AEs during Q2 2015 was only $305 billion. The size of the decline in the CBS was much smaller than the one in LBS primarily because of derivatives positions and inter-office loans, both of which are included in the LBS, but not in the CBS.
- Cross-border claims on China rose by $38 billion during the second quarter of 2015. Despite this moderate quarterly increase, international bank lending to China has lost significant momentum and contracted by 3% in the year to end-June 2015.
- International debt security issuance contracted in the third quarter of 2015, with net issuance of $50 billion, down from $233 billion in the second.
- The third-quarter slide in the issuance of international debt securities was particularly severe in EMEs, where net issuance fell to $1.5 billion, the largest downturn since the end of the financial crisis.
- Outstanding OTC derivatives positions dwindled in the first half of 2015, falling by 12% from $629 trillion to $553 trillion. Trade compression - a process of tearing up trades to eliminate economically redundant derivatives positions - accounts for much of this decline. Picking up significantly in 2014 and continuing to grow in the first half of 2015, compression has allowed dealers to trim the size of their derivatives books.
Recent developments in the international banking market
Cross-border banking activity contracted significantly between end-March and end-June 2015, more than reversing the large expansion in the first quarter. The LBS2 reveal that cross-border claims fell by $902 billion in exchange rate-adjusted terms3 during Q2 2015, slowing the annual growth rate4 of cross-border lending to 1% at end-June 2015, down from 6% at end-March 2015 (Graph 1). That said, the decline in Q2 2015 largely represented a reversal of the $780 billion increase observed in the first quarter of 2015. As a consequence, the overall decrease in cross-border bank claims during the first half of 2015 was only $122 billion.
Bank credit to AEs and EMEs diverged during Q2 2015. Cross-border claims on AEs fell by $916 billion. This quarterly decline more than offset the $761 billion increase in Q1 2015, bringing down year-on-year growth to less than 1%. By contrast, cross-border claims on EMEs grew by $46 billion in the course of Q2 2015, almost fully reversing the $57 billion contraction during the previous quarter. Despite the latest quarterly increase, the annual growth rate of cross-border lending to EMEs turned negative (-1%) for the first time since end-September 2012.5
Cross-border claims on advanced economies contracted during Q2 2015
The sharp contraction in cross-border lending to AEs between end-March and end-June 2015 reversed the developments seen during the previous quarter. Cross-border claims on AEs fell by $916 billion during the second quarter of 2015 (after adjustment for exchange rate fluctuations and breaks in series) after the $761 billion increase during the first. This took their outstanding stock to $19.6 trillion at end-June 2015.
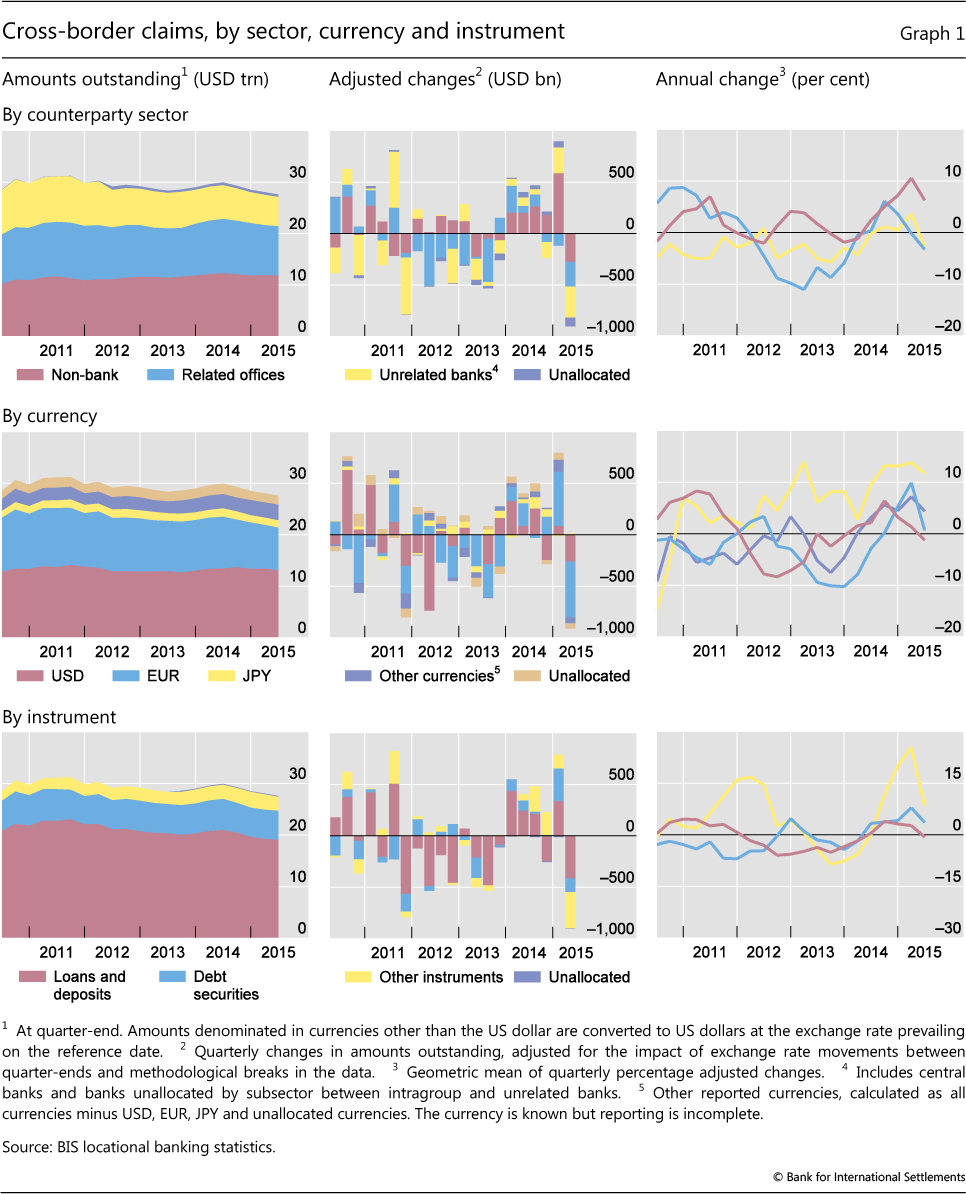
The above reversal pattern was present for cross-border bank lending to both bank and non-bank borrowers in AEs. Cross-border claims on banks contracted by $499 billion between end-March and end-June 2015, after increasing by $255 billion during Q1 2015. This took their outstanding stock to $11.3 trillion and pulled their annual growth rate into negative territory (-2%). Cross-border claims on non-banks, which had increased by $456 billion in Q1 2015, fell by $342 billion in Q2 2015. This slowed their year-on-year growth rate to 5% at end-June 2015, down from 10% at end-March 2015.
The currency breakdown in the LBS reveals that sharp drops in euro- and US dollar-denominated claims led the contraction in cross-border bank lending to AEs during the second quarter of 2015. Euro-denominated claims, which constituted more than one third of the overall stock of cross-border claims on AEs, accounted for more than half of the latest quarterly contraction. They fell by $527 billion, which slowed their year-on-year growth rate to 1% at end-June 2015, down from 9% at end-March 2015. US dollar-denominated claims on AEs saw a $255 billion decline, which pushed their annual growth rate down to -2%, the first year-on-year contraction since the second quarter of 2014. Cross-border claims denominated in Swiss francs and Japanese yen also contracted during Q2 2015, by a respective $51 billion and $9 billion. By contrast, lending in sterling expanded (by $14 billion), albeit more weakly than in the first quarter of 2015.
The CBS on an immediate counterparty basis6 suggest that the Q2 2015 contraction in cross-border lending to AEs was much milder than the one recorded by the LBS. The former data set reveals that the outstanding stock of cross-border claims on AEs declined by $305 billion between end-March 2015 ($10,075 billion) and end-June 2015 ($9,770 billion).7
The declines in cross-border claims on AEs recorded by the LBS and the CBS data differ in size for two main reasons. First, the instrument breakdown in the LBS reveals that $342 billion of the contraction was accounted for by "Other instruments", which primarily includes the positive market values of reporting banks' derivatives positions. Such derivatives positions are not included in cross-border claims in the CBS. Second, $112 billion of the Q2 2015 overall decline in the LBS was due to inter-office loans, which are not included in the CBS.
Modest increase in credit to emerging Asia
After two consecutive periods of contraction, cross-border lending to EMEs expanded moderately in Q2 2015. The $46 billion rise in such lending (after adjustment for exchange rate fluctuations and breaks in series) was not enough to offset earlier contractions, and consequently the year-on-year change declined to -1%, down from its most recent peak of 14% in Q4 2013.
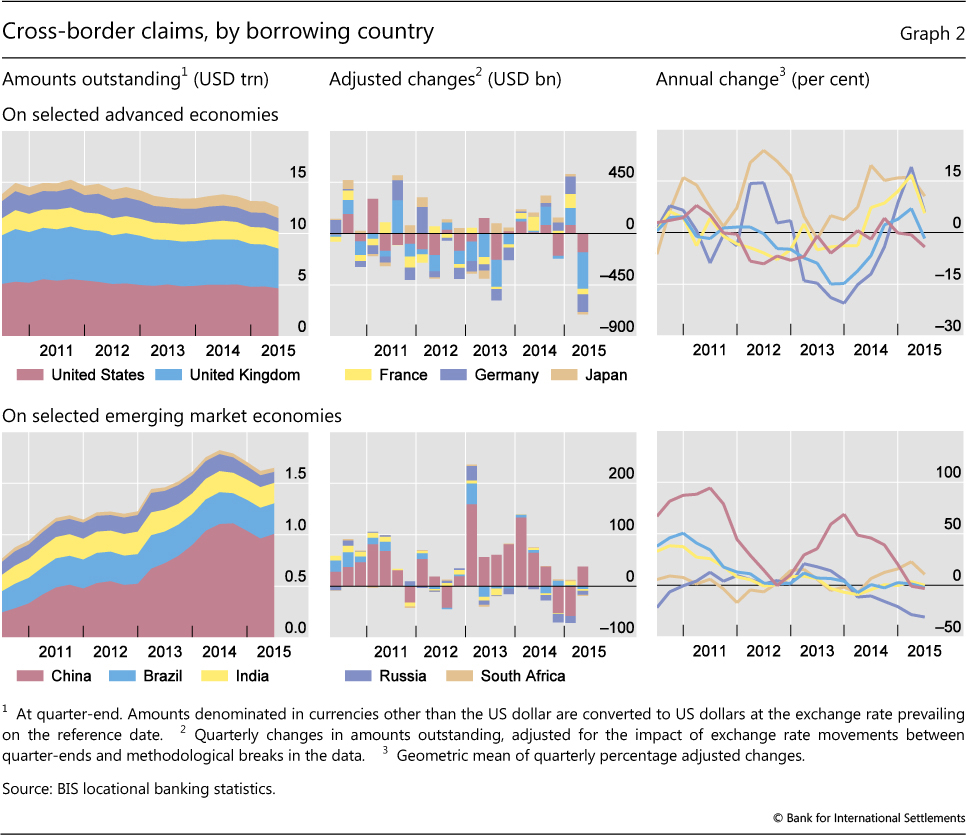
Cross-border lending to emerging Asia in general, and China in particular, continued to lose momentum. Claims on emerging Asia went up by $42 billion during Q2 2015. Nevertheless, despite the latest quarterly increase, the year-on-year growth rate has turned negative (-2%). Regional developments were once again dominated by China, which remains the largest EME borrower country, with an outstanding volume of cross-border claims equivalent to $1 trillion. Even though cross-border claims on China increased by $38 billion during the second quarter of 2015, the annual growth rate fell to -3% (Graph 2, bottom panels). Box 1 sheds light on foreign lending to China from a consolidated perspective.
The picture for international bank lending to other countries in emerging Asia was mixed. Korea saw cross-border claims on its residents increase by $2.6 billion. By contrast, lending to India and Indonesia contracted, by a respective $3.5 billion and $1.4 billion.
Mixed growth in credit to non-Asian emerging market economies
Cross-border lending to Latin America and the Caribbean remained virtually unchanged (after adjustment for exchange rate fluctuations and breaks in series) between end-March and end-June 2015. However, this regional aggregate conceals considerable differences at the country level. Brazil, the second largest borrower among EMEs, saw its cross-border borrowing drop by $5.1 billion during Q2 2015, which reduced its outstanding total to $296 billion (Graph 2, bottom panels). Mexico, the second largest borrower in the region, also experienced a decline (of $3 billion), which took its outstanding stock of cross-border borrowing to $123 billion. By contrast, cross-border claims on Venezuela grew by $2 billion. The increase was almost entirely driven by a jump in cross-border claims on banks, and lifted the annual growth rate of cross-border claims on the country to 11%. Cross-border claims on Argentina, Ecuador, Guyana and Uruguay all rose as well (with increases of about $1 billion each).
Box 1
Foreign bank lending to China
Cathérine Koch
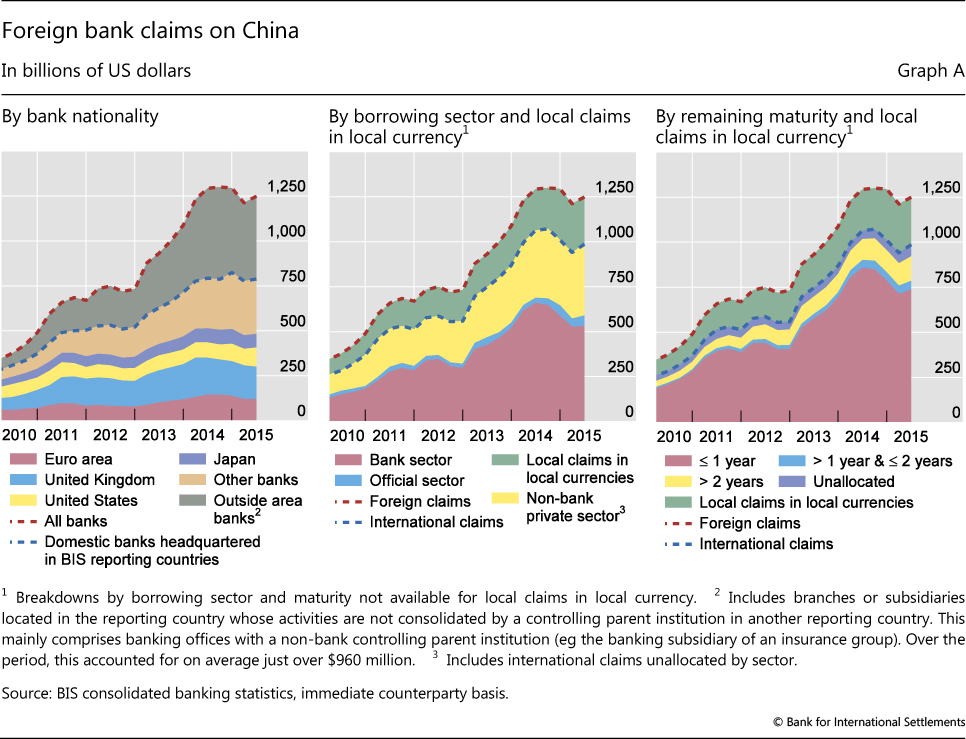
The BIS consolidated banking statistics (CBS) on an immediate counterparty basis indicate that foreign claims on Chinese residents, including local claims booked by foreign banks' offices in China, amounted to $1.2 trillion at end-June 2015. This was down from an all-time high of $1.3 trillion at end-September 2014. As of mid-2015, almost two thirds of these foreign claims were booked by banks headquartered in BIS reporting countries (Graph A, left-hand panel). Banks headquartered outside BIS reporting countries but with offices located in BIS reporting countries - for instance, Chinese banks located in Hong Kong SAR - accounted for more than a third of the foreign claims on China at end-June 2015.
 The claims of this group of so-called "outside area banks" contracted from $512 billion at end-September 2014 to $460 billion at end-June 2015. Unlike the claims of banks headquartered in BIS reporting countries, those of outside area banks are reported on an unconsolidated basis and thus include intragroup positions.
A large share of the growth in foreign claims on China over the past several years has taken the form of credit to banks (Graph A, centre and right-hand panels). The outstanding stock of these interbank claims accounted for more than half of international claims on China at the end of Q2 2015. However, these claims declined from $660 billion at mid-2014 to $532 billion at mid-2015 (Graph A, centre panel).
 Interbank positions include renminbi-denominated claims that are the counterpart to offshore deposit liabilities.
 By contrast, international claims on the Chinese non-bank private sector continued to grow at the steady pace seen in the past few years, lifting their outstanding stock from $91 billion at mid-2010 to $395 billion at mid-2015.
Short-term claims have mirrored the recent declines in interbank lending to China (Graph A, right-hand panel). Claims with remaining maturities of up to one year, which accounted for 75% of the total stock of international claims on China as of end-Q2 2015, have contracted from $858 billion at mid-2014 to $737 billion at mid-2015. Thus, they constituted most of this period's overall decline in international bank lending to China.
Foreign claims comprise local claims of the bank's offices abroad as well as cross-border claims of the bank's offices worldwide. A list of countries in the BIS reporting area is available on the BIS website: www.bis.org/statistics/rep_countries.htm. China does not report international banking statistics to the BIS. However, the locational statistics and consolidated statistics on an immediate counterparty basis capture the positions of Chinese and other banks headquartered outside the BIS reporting area to the extent that these positions are booked through offices in a BIS reporting country. International claims are defined as the sum of cross-border claims denominated in all currencies and foreign offices' local claims denominated in foreign currencies. Changes in the consolidated banking statistics are not adjusted for exchange rate movements. To the extent that claims are denominated in currencies other than the US dollar, an appreciation of the US dollar will result in a decline in the reported US dollar value of outstanding claims in those currencies. See R McCauley, "Capital flowed out of China through BIS reporting banks in Q1 2015", BIS Quarterly Review, September 2015, pp 28-9.
Between end-March and end-June 2015, cross-border lending to emerging Europe contracted by $3.5 billion; and, as in other regions, the picture varied markedly across countries. Cross-border claims on Russia and Ukraine continued to decline. The $8 billion quarterly drop on Russia accelerated the year-on-year decline to 30% and reduced the outstanding stock to $108 billion. Cross-border claims on Ukraine fell by $473 million during the second quarter of 2015, which took their annual rate of contraction to 44%. Those on Bulgaria and Turkey also declined (by $1.1 billion and $3.5 billion, respectively). By contrast, claims on the Czech Republic and Poland rose significantly (by $1.9 billion and $5.2 billion, respectively), with the quarterly expansion registered by Poland almost entirely driven by interbank cross-border claims.
During the second quarter of 2015, cross-border lending to Africa and the Middle East went up by $6 billion. The latest quarterly expansion kept the annual growth rate at a robust 11% - in line with the steady expansion observed since the beginning of 2014 - and took the outstanding total to $523 billion. The strongest underlying components of the overall increase were rises in cross-border claims on the United Arab Emirates ($11 billion), Qatar ($2 billion) and Egypt ($1.5 billion). By contrast, cross-border lending to Nigeria, Saudi Arabia and South Africa fell (by $1.2 billion, $1.8 billion and $2.3 billion, respectively).
The euro as a global funding currency
The latest developments in euro-denominated cross-border claims (discussed above) appear to be part of a broader pattern that links exchange rate movements in a given funding currency with global cross-border bank lending denominated in that currency. Specifically, there is growing empirical evidence that the depreciation of a global funding currency (typically, the US dollar) is associated with a rise in the net worth of borrowers from countries with other home currencies and, ultimately, with an increase in cross-border lending denominated in the global funding currency.8
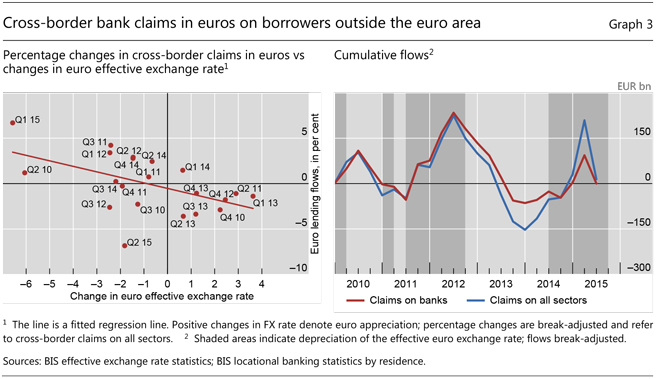
Even though the global funding currency in the above story has typically been the US dollar, the LBS suggest that a similar pattern is starting to emerge for the euro. The left-hand panel of Graph 3 plots quarterly growth rates of euro-denominated cross-border bank claims on borrowers outside the euro area against quarterly changes in the effective euro exchange rate. It suggests that, on average, a euro depreciation is associated with faster growth of euro-denominated cross-border claims on borrowers outside the euro area.
The right-hand panel of Graph 3 takes a time series perspective. It shows the evolution of the cumulative adjusted quarterly flows in euro-denominated cross-border claims on borrowers outside the euro area, while distinguishing between the episodes during which the euro was appreciating and those in which it was depreciating (shaded areas). A similar pattern emerges. Namely, periods of euro depreciation tend to be associated with a pickup in euro-denominated cross-border bank lending (blue line). By contrast, episodes during which the value of the euro increases tend to coincide with contractions in cross-border bank lending in euros. The relationship appears to be driven primarily by cross-border interbank lending (red line).
Recent developments in international debt securities
While cross-border lending contracted in the second quarter of 2015, international debt securities issuance was generally strong throughout the first half of the year (see "Highlights of global financing flows", BIS Quarterly Review, September 2015). This pattern reversed in the third quarter (not covered by the previous section on cross-border claims), when net issuance fell to $50 billion (Graph 4), the largest contraction since the first quarter of 2013. This represents declines of 79% and 78% compared with the previous quarter and the third quarter of 2014, respectively. Issuance contracted both in AE borrowers and EMEs. Borrowers based in AEs issued $22 billion net of repayments, $100 billion less than in the preceding quarter. EME borrowers issued only $1.5 billion on net, about $89 billion less.9 Offshore centres and international organisations accounted for the remainder.
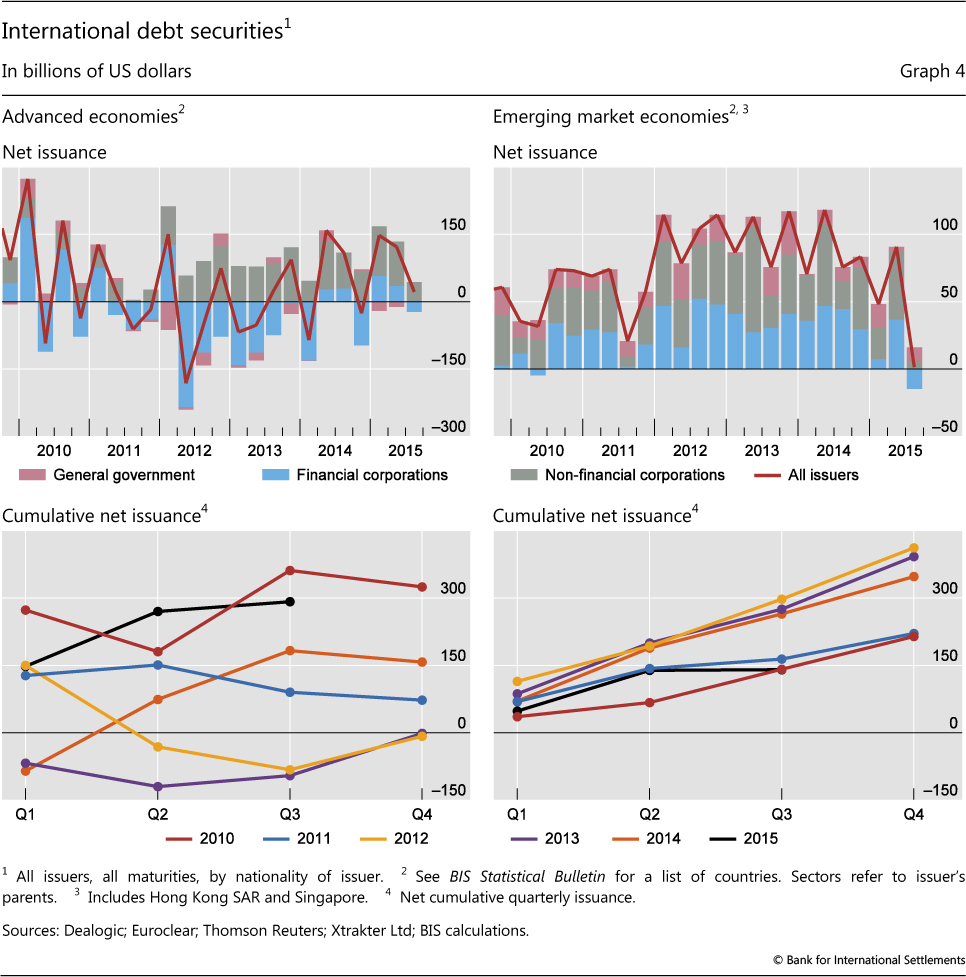
The contraction in debt issuance was especially severe in EMEs. Despite the third quarter slowdown, cumulative net issuance in AEs in the first three quarters of 2015, at $291 billion, exceeded the pace in each of the previous four years (Graph 4, bottom left-hand panel). Emerging market borrowers, by contrast, issued$141 billion in the first three quarters of 2015, a significantly slower pace than in the past several years (Graph 4, bottom right-hand panel).
Weak debt securities issuance in the third quarter can only be partially explained by seasonality. For the largest part, it appears to have reflected the turbulence that affected global financial markets, particularly EMEs (see "EME vulnerabilities take centre stage", BIS Quarterly Review, September 2015). Preliminary estimates from the Institute of International Finance suggest that the third quarter of 2015 was the worst for EME portfolio flows since the Great Financial Crisis. Growing concerns over emerging market fundamentals, falling commodity prices and rising debt burdens probably played a role. Additionally, an increasing focus on local markets may also have been a factor, in particular for China. Recent data from the People's Bank of China indicate that total bond issuance by Chinese non-financial corporations including domestic issuance was on the increase.
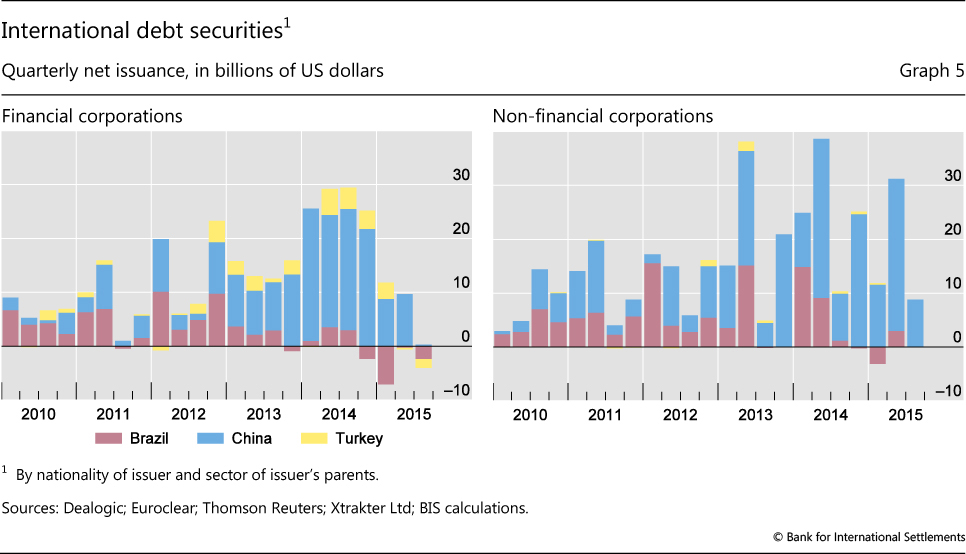
Net issuance by EMEs posted its largest negative figure since the end of the crisis (Graph 4, top right-hand panel). Net repayments by financial corporations totalled $15 billion, compared with $37 billion in net issuance in the previous quarter, while net issuance by non-financial corporations in EMEs was $6 billion. Both values were the lowest since the beginning of 2009. Net issuance by Brazilian financial corporations was negative, at -$2 billion, compared with -$200 million in the previous quarter, the value for Chinese financial corporations fell to $300 million, down from $10 billion in the previous quarter, while net issuance for Turkish financial firms was negative, at -$1.6 billion, the lowest in the last six years (Graph 5, left-hand panel). Net issuance from Chinese non-financial corporations fell to $9 billion, down from $28 billion, and to -$8 million for Brazilian firms, down from $3 billion in the preceding quarter (Graph 5, right-hand panel). Similarly, net issuance eased by $4.3 billion in India and $5.5 billion in Korea.
The quarterly decline in international debt issuance was also significant in developed economies. The financial industry reduced its net issuance of debt securities to a negative $22 billion, compared with positive net issuance of $35 billion in the previous quarter (Graph 4, top left-hand panel). Net issuance by non-financial corporations amounted to $43 billion, the lowest value since the fourth quarter of 2011.
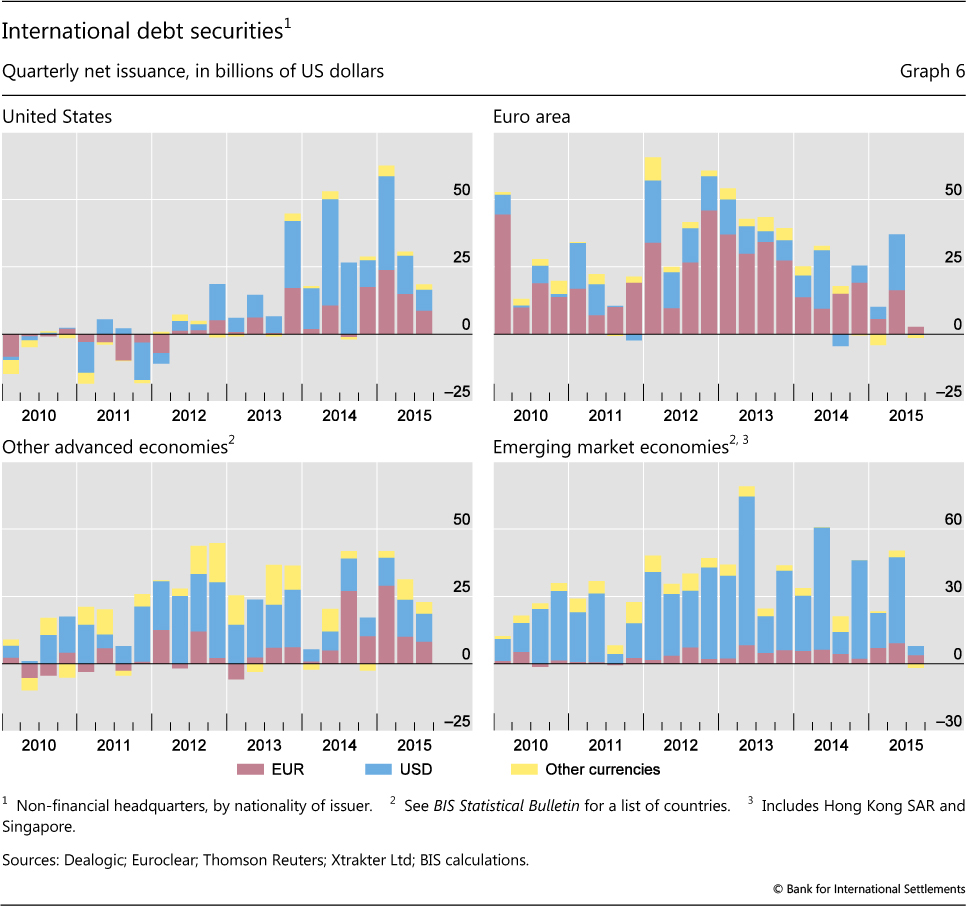
Euro-denominated securities increased their importance vis-à-vis dollar-denominated instruments in the third quarter of 2015. Net issuance in euros by non-financial firms was $23 billion in total, while net issuance in dollars was only $22 billion. The corresponding figures for the previous quarter were $50 billion and $87 billion, respectively. Among US non-financial borrowers, euro-denominated net issuance, at $15 billion, surpassed the dollar-denominated value in the second quarter of 2015, at $14 billion, and continued to be more prominent in the third quarter, at $9 billion versus $8 billion (Graph 6, top left-hand panel). Among European issuers, dollar-denominated net issuance by non-financial corporations was negative at -$200 million, down from $21 billion in the previous quarter (Graph 6, top right-hand panel). In other AEs, the euro's share of total net debt issuance edged upwards, from 32% to 36% (Graph 6, bottom left-hand panel). Both euro- and dollar-denominated issuance declined in EMEs compared to the previous quarter. However, the euro increased its presence in total EME net debt issuance, going from 18% in the second quarter of 2015 to 62% in the third quarter, its highest share in the last six years (Graph 6, lower right-hand panel).
Box 2
Outstanding OTC derivatives positions dwindle as compression gains further traction
Andreas Schrimpf
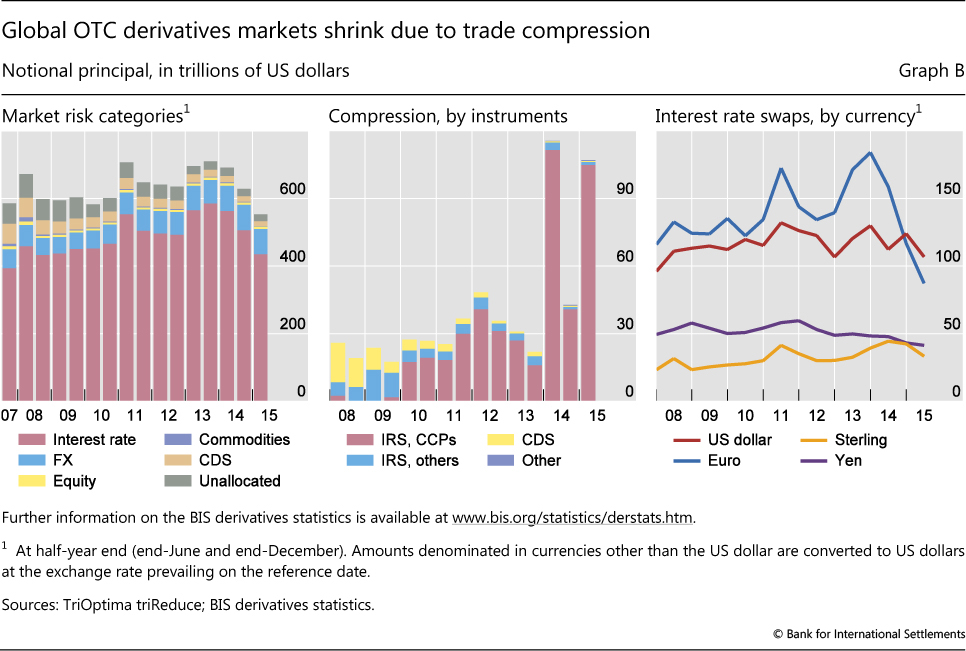
Outstanding positions in global over-the-counter (OTC) derivatives markets shrank significantly in the first half of 2015. Notional amounts of outstanding contracts fell by 12% between end-December 2014 and end-June 2015, from $629 trillion to $553 trillion (Graph B, left-hand panel). Changes in outstanding notionals, however, do not necessarily reflect changes in market activity or in the risk that is actually held. Dealers often enter into derivatives contracts to offset existing exposures. The move towards central clearing tends to further inflate outstanding notionals; after novation to the central counterparty (CCP), a single trade between two dealers becomes two outstanding contracts of each dealer with the CCP. Trade compression - a process of tearing up trades to eliminate economically redundant derivatives positions - has reversed this trend, helping to sharply undercut the value of outstanding notional OTC derivatives positions in recent years. The overall volume of compressions increased strongly in 2014 but continued to grow in the first half of 2015 (Graph B, centre panel).
The decline in outstanding OTC derivatives contracts largely stems from a sharp contraction in notional amounts in the euro-denominated interest rate segment. The notional value of such contracts fell from $167 trillion to $126 trillion between end-December 2014 and end-June 2015 (or equivalently from €138 trillion to €113 trillion). Since late 2013, the outstanding volume of EUR interest rate swap notionals has dropped by about 50% (Graph B, right-hand panel), thanks to a strong increase in compression.
Basic compression technology has been available for several years, but has gained particular traction in the interest rate swap (IRS) segment in the past two years (Graph B, centre panel). Growing demand by global bank dealers for more efficient balance sheet usage (partly driven by regulatory changes) has been a key catalyst for technological innovation that facilitates the compression of derivatives trades. The most popular compression services are offered by third-party providers, drawing on submissions of the portfolio positions of each of their subscribers. An algorithm seeks to identify redundant contracts that can be terminated without changing each participant's net position. The shrinkage of a dealer's derivatives book via compression techniques helps reduce operational risks, counterparty risks and associated costs.
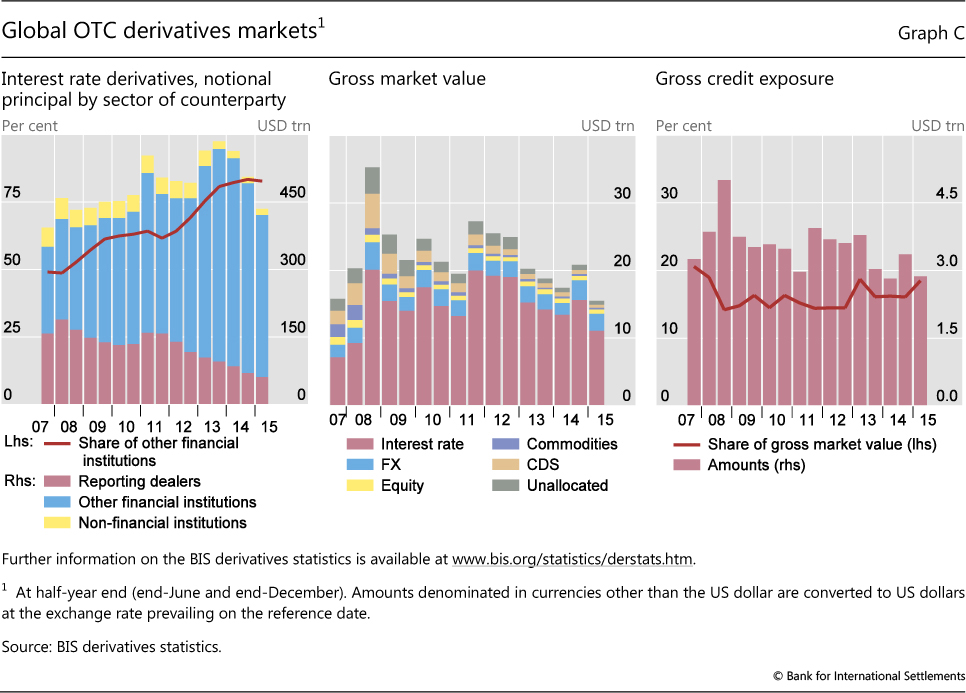
Compression had already contributed to a significant decline in outstanding notional amounts of credit default swap contracts in the years following the Great Financial Crisis. More recently, the pickup in clearing of IRS through CCPs (see Domanski et al, "Central clearing: trends and current issues", in this issue) may have led to an acceleration of this trend, since central clearing has further enabled the use of sophisticated compression techniques. The distribution of interest rate derivatives by counterparty points to a continued shift in activity towards financial institutions other than dealers, including CCPs (Graph C, left-hand panel). Contracts between dealers and other financial institutions, including CCPs, stood at $360 trillion at end-June 2015, down from $421 trillion at end-December 2014. More recently, compression methods have emerged that do not require third-party involvement. This has led to a further pickup in compression volumes. And some newly available electronic trading platforms for OTC derivatives - such as swap execution facilities (SEFs) - have also started to offer efficient mechanisms for cancelling offsetting positions between counterparties.
The gross market value of outstanding contracts - that is, the cost of replacing all outstanding contracts at market prices prevailing on the reporting date - also decreased in the first half of 2015 (Graph C, centre panel). Gross market values have continued their downward trend of recent years despite a brief spurt in late 2014. Market values stood at $15.5 trillion at end-June 2015, their lowest level since 2007. Along with compression, a narrowing gap between rates on the reporting date and rates at contract inception may have contributed to the decline. Gross credit exposures, which take into account the reduction of counterparty credit risk through netting agreements but not collateral, also declined, to $2.9 trillion at end-June 2015, close to pre-crisis levels (Graph C, right-hand panel).
Over this period, currency movements overstated the contraction of positions in non-US dollar currencies. For example, the euro's depreciation against the dollar between end-December 2014 and end-June 2015 led to a decline in the dollar value of euro-denominated positions. Yet, even after adjusting for this effect, notionals at end-June 2015 were still about 10% lower than at end-December 2014. There is a variety of reasons why the impact of compression has been strongest in the EUR IRS segment. EUR derivatives books tend to be very large from the outset, compared to those in other currencies. EUR IRS also tend to be more standardised and the set of broker-dealers active in these markets is less diverse. All this means that the scope for compression may have been larger in EUR IRS.
1 This article was prepared by Cathérine Koch (catherine.koch@bis.org), Gianpaolo Parise (gianpaolo.parise@bis.org) and Andreas Schrimpf (andreas.schrimpf@bis.org). Statistical support was provided by Jeff Slee, Stephan Binder, Branimir Gruić and Denis Petre.
2 The LBS are based on the location of banking offices and capture the activity of all internationally active banking offices in the reporting country regardless of the parent bank's nationality. Banks record their positions on an unconsolidated basis, including those vis-à-vis their own offices in other countries.
3 Quarterly changes in outstanding amounts are adjusted for the impact of exchange rate movements between the respective quarter-ends and for methodological breaks in the data series.
4 Annual percentage changes are calculated as the sum of exchange rate- and break-adjusted changes over the preceding four quarters divided by the amount outstanding one year earlier.
5 The remainder of the quarterly shift in claims is accounted for by offshore centres and an unallocated portion.
6 The CBS are based on the nationality of reporting banks and are reported on a worldwide consolidated basis, ie excluding positions between affiliates of the same banking group. Banks consolidate their inter-office positions and report only their claims on unrelated borrowers without providing a currency breakdown. As a consequence, exchange rate-adjusted changes are not available in the CBS.
7 Changes in outstanding stocks in the CBS should always be interpreted with caution because, unlike the adjusted flows in the LBS, they are not adjusted for exchange rate fluctuations and breaks in series.
8 See V Bruno and H S Shin, "Capital flows and the risk-taking channel of monetary policy", Journal of Monetary Economics, no 71, 2015, pp 119-32; and B Hofmann, I Shim and H S Shin, "The risk-taking channel of currency appreciation", BIS Working Papers, forthcoming.
9 Includes Hong Kong SAR and Singapore.