Cross-border bank lending during the taper tantrum: the role of emerging market fundamentals
Cross-border bank lending to emerging markets slowed sharply during the taper tantrum. The abruptness of this slowdown varied considerably across both lenders and borrowers. We use newly available data to explain the drivers of this cross-sectional variation. Although the initial tapering shock originated from advanced economies, EME-specific factors explain the bulk of the variation in the slowdown across lender-borrower pairs.1
JEL classification: F34, G15, G21.
Starting with the Federal Reserve's May 2013 hint that it might begin reducing its bond purchases sooner than previously expected, the "taper tantrum" triggered sharp drops in the exchange rates of emerging market economies (EMEs) as well as in their bond and equity prices. While the sharp reversal in portfolio flows to EMEs has been widely documented, the behaviour of cross-border bank lending has received less attention. This is surprising given the importance of cross-border bank lending for most EMEs: the outstanding stock of cross-border bank claims on EMEs stood at more than $3.6 trillion at the end of 2013 - roughly as large as the stock of all portfolio investment in EMEs. Thus, notwithstanding the growing importance of securities market financing, a sudden stop in cross-border bank lending could still destabilise economies and, in the worst case, lead to a balance of payments crisis.
During the taper tantrum, cross-border bank lending to EMEs slowed sharply. Its growth rate dropped to 2.5% in the second and third quarters of 2013 from around 10% over the previous two quarters. Interestingly, the intensity of this deceleration varied considerably across lender and borrower. This raises important questions for policymakers: what drove this variation? And were the factors that drove it mainly on the borrower's or on the lender's side?
We attempt to answer these questions by exploring newly available bank lending data in a regression framework. The new data contain three dimensions that are crucial to this analysis - the nationality of the lending bank, the location of the borrower and the currency composition of the claims. These three dimensions allow us to link the evolution of bilateral exchange rate-adjusted flows to drivers connected with both the lender banking systems and the borrower EMEs.
We find that EME-specific factors explain most of the slowdown in cross-border bank lending during the taper tantrum. While factors connected with both the lender banking system and the borrower EMEs are statistically significant, the latter group is responsible for roughly 70% of the explained variation. In particular, we identify the current account balance and the share of cross-border bank lending denominated in US dollars as significant drivers. One lender banking system variable, the change in the average bank credit default swap (CDS) spread during the taper tantrum, accounts for the remaining 30% of explained variation.
The rest of the feature is organised as follows. The first section introduces the data used for our work, in particular the new cross-border bank lending data. The second analyses these data in a regression framework, and the final section concludes with a brief discussion of the main results.
Data
In this section, we first go over the three dimensions of the newly available cross-border bank lending data needed for our empirical analysis. Second, we describe how the growth rate of cross-border bank lending changed across the pairs of lender banking systems and borrower EMEs. Finally, we discuss possible drivers of the variation in cross-border bank lending flows.
The new cross-border bank lending data
In this study, we utilise the recently implemented Stage 1 Enhancements to the BIS international banking statistics (IBS).2 Given that this is the first time the new data have been used in analytical work, we briefly describe the most relevant features and make a comparison with the previously available BIS IBS data sets (see CGFS (2012) for details).
Any attempt to address our question (ie linking fluctuations in cross-border bank flows both to lender banks and to borrower economy factors) requires three dimensions of cross-border bank lending data:
A. the nationality of the lending bank;
B. the residence of the borrower; and
C. the currency composition of cross-border claims.
We need the first two dimensions (A and B) to identify factors specific to the lender banking system and borrower EMEs, respectively. The nationality of the bank (A) identifies the lender banking system, ie the home of the highest-level banking entity in the corporate chain - which, in turn, is used as a proxy for the decision-making unit for cross-border bank lending.3 We need the third dimension (C) to control for the impact of currency fluctuations on changes in the outstanding stocks of cross-border bank claims. For instance, a move in the euro/dollar exchange rate mechanically leads to changes in the US dollar value of euro-denominated claims. Thus, the changes in BIS IBS claims, which are expressed in US dollars, also reflect currency movements. The adjustment for currency movements is particularly relevant, because contractions in cross-border lending tend to coincide with large exchange rate movements.4
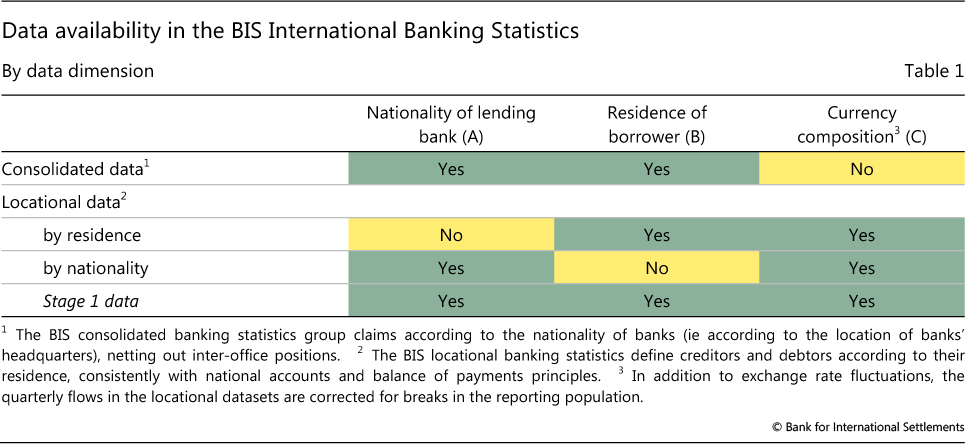
The Stage 1 enhanced data are the first consistent data set to provide all three dimensions at the same time (Table 1). Previously, the BIS IBS data provided information on only two of the above three dimensions. The consolidated data set identified the nationality of the lending banks (dimension A) and the residence of the borrower (dimension B), but did not provide a currency breakdown (dimension C). By contrast, the locational data by residence did reveal the currency composition of banks' cross-border claims (dimension C) as well as the residence of the borrower (dimension B), but they did not identify the nationality of the lending bank (dimension A). Finally, the locational data by nationality contained dimensions A and C, but not dimension B.
The unavailability of all three data dimensions constrained previous studies on the determinants of foreign bank lending to EMEs. For instance, McGuire and Tarashev (2008) used the consolidated data to construct the dependent variable in their model (ie the growth rate of the stock of international claims). As a consequence, they were able to study how the health of individual national banking systems affected foreign lending to EMEs, but only at the cost of working with data that had not been adjusted for exchange rate fluctuations. By contrast, Takáts (2010) used the locational data set in order to construct his dependent variable (ie the growth rate of the stock of currency-adjusted cross-border claims). As a result, he was able to work with exchange rate-adjusted cross-border lending flows, but information on the nationality of the lending banks was lacking, which prevented a decomposition of the estimated global home country factor into banking system-specific factors. Avdjiev et al (2012) came closest to using all three required dimensions by combining the locational data by residence with the consolidated data. However, this approximation could not have the detail and precision available in the Stage 1 Enhancements.
Finally, although the new Stage 1 data are not yet complete, they are nevertheless representative. On aggregate, information on the nationality of lending banks is available for about two thirds of the total cross-border claims on EMEs. This ratio varies considerably and tends to be higher for the larger EMEs.
Cross-border bank lending during the taper tantrum
In selecting the sample for our analysis, we aim to include all internationally significant lender banking systems and borrower EMEs.
In particular, we include all 21 lender national banking systems which had more than $10 billion of cross-border claims on EMEs in the new Stage 1 data at end-2013.5 We also include all 35 EME recipients of cross-border bank lending whose cross-border borrowing exceeded $10 billion at end-2013: Angola, Argentina, Bulgaria, Brazil, Chile, China, Chinese Taipei, Colombia, Croatia, the Czech Republic, Egypt, Hungary, India, Indonesia, Israel, Korea, Kuwait, Lithuania, Malaysia, Mexico, Morocco, Nigeria, Peru, the Philippines, Poland, Romania, Russia, Saudi Arabia, South Africa, Thailand, Turkey, Ukraine, the United Arab Emirates, Venezuela and Vietnam (Graph 1, rows).6
Across our sample, the new Stage 1 data reveal a substantial degree of variation during the episode. In particular, we examine the change in the growth rate of cross-border bank lending to EMEs between the taper tantrum quarters (Q2 and Q3 2013) and the two quarters preceding this episode (Q4 2012 and Q1 2013). Among the largest individual lender national banking systems, this change ranged from -13% to +10%. Among the largest borrower EMEs, the change was between -12% and +7%. Smaller lenders and borrowers saw even bigger changes.
The new Stage 1 data also show that the variation is even greater at the level of bilateral cross-border bank lending flows (ie flows from individual lender banking systems to individual borrower EMEs). Graph 1 displays changes in the bilateral growth rates during the taper tantrum between lender banking systems (columns) and borrower EMEs (rows). For confidentiality reasons, the nationalities of the lender banking systems are not revealed, and colour-coded interval categories are shown instead of exact values.
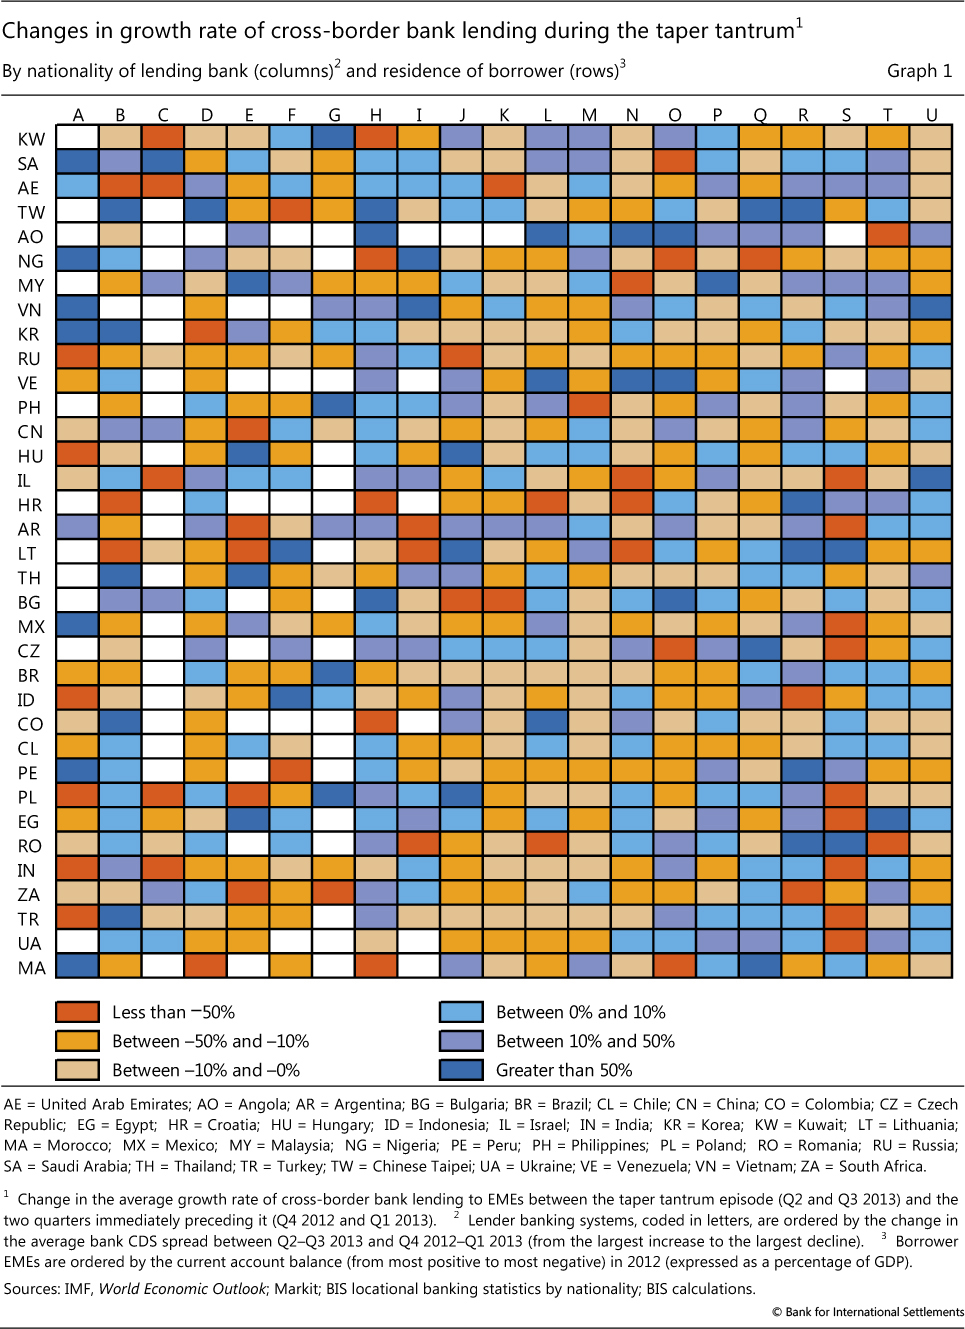
Finally, we also undertake a straightforward ANOVA decomposition on the change in the growth rate of cross-border bank lending. This reveals that the variation between lender national banking systems (the columns in Graph 1) is of roughly the same size as the variation between borrower EMEs (the rows in Graph 1). The decomposition suggests that we should examine factors relating to both lender banking systems and borrower EMEs when analysing what drove the change in cross-border bank lending growth during the taper tantrum.
Possible drivers of cross-border bank lending
Economic theory and past studies of cross-border bank lending suggest a number of economic variables as possible drivers of cross-border bank lending. Given that this is the first study to use the new Stage 1 data, we examine a range of these potential explanatory variables. Furthermore, based on our ANOVA decomposition, we give equal consideration, as potential drivers, to lender banking system- and borrower EME-related factors.
We explore five lender banking system variables: the change in the average bank CDS spread and equity price during the taper tantrum, past real credit and real deposit growth in the home market of banks, and the share of cross-border claims denominated in US dollars. A rise in the CDS spread or a decline in the equity price of the lending bank during the taper tantrum could potentially signal increased levels of bank stress, which would in turn reduce banks' ability to lend. From a different perspective, rapid credit or weak deposit growth in the home market could be a precursor of subsequent funding strains. Finally, a high share of cross-border claims denominated in US dollars could be an indicator of greater reliance on US dollar funding and, consequently, of greater funding strains experienced during the taper tantrum.
We also examine five borrowing EME variables: current account balance, external debt, government budget balance, past real credit growth to the private sector, and the share of cross-border bank lending denominated in US dollars. Higher current account and budget deficits and higher levels of external debt all make borrowers more vulnerable, which typically would reduce banks' willingness to lend. Meanwhile, rapid real credit growth stretches the balance sheets of local borrowers and increases their susceptibility to external shocks (BIS (2014b)). This also tends to reduce banks' willingness to supply cross-border credit to these overstretched borrowers. Finally, a large share of cross-border bank lending denominated in US dollars could indicate, as in the case of lender banking system factors, higher sensitivity to the evolution of US monetary policy.7
A preliminary examination of the data suggests that these variables, particularly the change in banks' CDS spreads and the current account balance, could have had an impact on cross-border bank lending. In Graph 1, lender banking systems are ranked according to the change in the average CDS spread during the taper tantrum, while borrower EMEs are ranked according to their current account balance. Indeed, moving from left to right, ie from rising to declining bank CDS spreads, one can see fewer instances of a slowdown in cross-border bank lending. Similarly, moving from top to bottom, ie from current account surplus to deficit, one can see more instances of deceleration. Of course, these broad trends are punctuated with many exceptions - and should be seen only as an inducement to undertake a more rigorous regression analysis.
Analysis
We undertake the analysis in three steps. First, we present our benchmark regression, ie the regression specification that best fits the cross-border bank lending data. Second, we discuss the economic implications of the model by decomposing the slowdown in cross-border bank lending into the contributions of its main drivers. Finally, we examine the robustness of the benchmark specification.
Benchmark regression
The data structure and the timing of the taper tantrum guide our basic regression setup. As the BIS bank lending data are reported at a quarterly frequency and the taper tantrum lasted from May to September 2013, we compare the growth rates in cross-border bank lending in Q2 and Q3 2013 with their counterparts in the preceding two quarters (Q4 2012 and Q1 2013).
Furthermore, we weigh each observation by the size of the respective bilateral stock of outstanding cross-border claims at the end of Q3 2012. More specifically, the weight that we assign to each observation is equal to the ratio of the respective bilateral stock to the sum of all bilateral stocks in our sample. Our examination of the data suggests that smaller volumes tend to be highly volatile and probably reflect more bank-specific, or even project-specific, factors. As a consequence, the evolution of larger bilateral cross-border bank lending claims is likely to reflect changes in the economic environment more accurately. In order to control for extreme outliers, we also exclude observations for which the value of the dependent variables is more than 10 standard deviations away from the sample mean.
We select our benchmark explanatory variables through an elimination process. We start by running a panel regression that includes all 10 candidate explanatory variables discussed in the previous section. Then we exclude the variable with the lowest t-statistic. Next, we rerun the regression with the remaining variables. We continue this iteration until all remaining explanatory variables are statistically significant at the 5% level.
Our benchmark regression, obtained through the above elimination process, explains the variation of bilateral cross-border bank lending flows with the degree of stress experienced by the lender banking system (as proxied by the change in the average CDS spread) and with the characteristics of the borrower EME (as proxied by the current account balance and the share of cross-border bank lending denominated in US dollars). Formally, we estimate the following equation:

Our dependent variable ΔXBCb,l represents the change in the average growth rate of the lender banking system l's cross-border claims on borrower EME b between the taper tantrum (Q2 and Q3 2013) and the two quarters preceding it (Q4 2012 and Q1 2013). Formally:

Our independent variables are defined as follows: c is a constant; ΔCDSl is the change in the average CDS spread of the lender banking system l between the taper tantrum (Q2 and Q3 2013) and the two quarters preceding it (Q4 2012 and Q1 2013); CABb is the current account balance (as a percentage of GDP) in borrower EME b during 2012; USDSb is the share of cross-border bank lending to borrower EME b denominated in US dollars (as of end-Q3 2012); and εb,l is the error term. We weigh each observation b,l by the share of cross-border claims that the lender banking system l had on borrower EME b in total cross-border bank lending (across all borrower-lender pairs) in our sample as of end-September 2012.
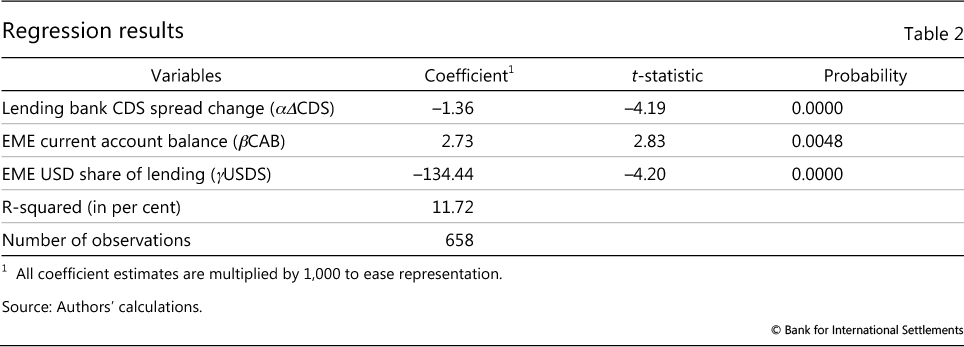
The benchmark results show that both lender banking system and borrower EME factors were statistically and economically significant drivers (Table 2). The regression fits the data well: it explains close to one eighth of the total variation of a large and heterogeneous sample. All the coefficient estimates are statistically significant at the 1% level, well above the 5% significance threshold used to narrow down the list of variables.
The sign of the estimated coefficient for the lender banking system variable suggests a straightforward supply effect. The negative sign for the change in the CDS spread (α) implies that the greater the increase in the stress experienced by a national banking system during the taper tantrum, the more that banking system reduced its cross-border bank lending.
The coefficient on the EME current account balance (β) is positive, implying that a stronger current account position (ie a larger surplus or a smaller deficit) was associated with more resilient cross-border bank lending growth. Intuitively, EMEs with larger external financing needs on the eve of the taper tantrum were more vulnerable to a sudden change in financing conditions. This is consistent with public discussions during the taper tantrum, which often focused on current account balances as an important indicator of vulnerability for EMEs.
Finally, a higher share of US dollar-denominated cross-border claims on a given EME was associated with a sharper slowdown in lending to its residents. Thus, it appears that the taper tantrum had a larger impact on economies with greater reliance on cross-border US dollar funding.
Economic significance
We next show that the benchmark regression captures an economically significant part of the slowdown in cross-border bank lending by plotting predicted and actual lending slowdowns by lender banking system and by borrower EME.
In our decomposition, we focus on deviations from means, as in Avdjiev et al (2012). More specifically, we first create demeaned variables by taking the difference between the regression variables in our benchmark equation and their respective means. We then calculate the contributions by multiplying the demeaned variables by the respective estimated coefficients.
Overall, our benchmark specification explains a large share of the variation in the data. With respect to lender banking systems (Graph 2, left-hand panel), the econometric model accurately captures the slowdowns in cross-border lending to EMEs reported by both advanced economy banks (eg German, Swiss and US banks) and EME banks (eg Brazilian banks): the distance between actual lending (black dots) and estimated lending (red dots) is generally small. However, the fit is not uniformly precise for all banking systems. For example, the model captures neither the surprising acceleration in French banks' lending growth nor the full scale of the slowdowns reported by Japanese and Dutch banks.
In general, the estimates fit better for larger lender banking systems than for smaller ones. Technically, this is due to the volume weighting in the benchmark regression, which puts emphasis on fitting larger bilateral observations. Economically, this also implies that our benchmark regression more closely follows the total volumes of cross-border bank lending but that the price paid for doing so is that it less accurately fits some smaller country-specific growth rates.
The estimates fit even better for borrower EMEs (Graph 2, centre panel). The benchmark specification performs well not only for the largest borrower EMEs (eg China, India, Brazil and Turkey) but also for smaller EMEs (eg the Czech Republic and Peru). This good fit for smaller economies is not necessarily expected, given the weighting we used in the regression analysis. The most notable exception is Russia, where our model does not predict the full extent of the slowdown.
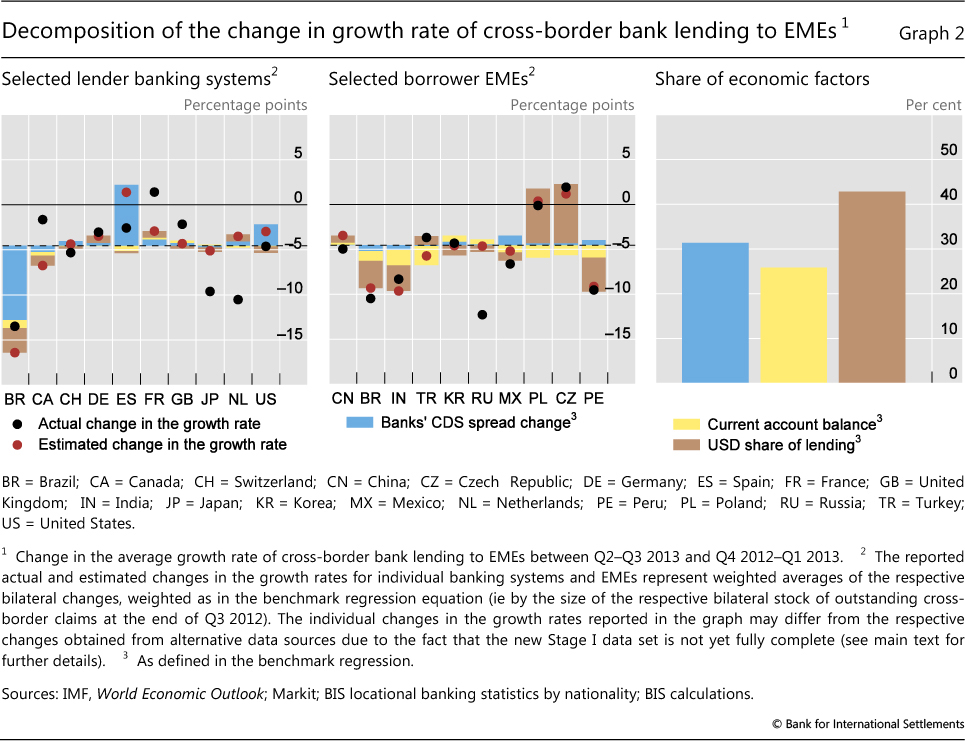
Our estimates imply that factors associated with borrower EMEs accounted for the bulk of the explained variation in cross-border lending (Graph 2, right-hand panel). All in all, EME factors account for around 70% of the explained variation. Among them, the US dollar share of cross-border lending accounted for around 45% and the current account balance for around 25%. Meanwhile, the factor related to lender banking systems, the change in banks' CDS spreads, accounted for around 30% of the explained variation.
The strong explanatory power of EME-related variables in the benchmark specification potentially explains why our estimates tend to fit borrower EMEs even better than they do the lender banking systems. Although variation across lender banking systems and borrower EMEs is roughly similar, the EME-related variables seem to be able to better capture the EME-specific variation.
In sum, our analysis shows that, even though the initial taper tantrum shock originated from the advanced economies, it was mostly EME-specific vulnerabilities that determined how the slowdown in cross-border bank lending would be distributed across EMEs.
Sensitivity analysis
We examine the robustness of our benchmark results to alternative specifications by conducting a sensitivity analysis. While for the sake of brevity we do not list the detailed regression results, they are available on request.
Our benchmark specification is robust to dropping one variable at a time. In each of the resulting specifications, all estimated coefficients retain their statistical significance, their respective signs and even their magnitudes.
The benchmark results are also robust to the inclusion of additional explanatory variables. In particular, we include three additional borrowing EME-linked variables that might signal vulnerabilities as discussed in BIS (2014a): credit-to-GDP gaps, inflation and government debt levels, but none of these turns out to be significant at the 5% level. Similarly, the other potential explanatory variables that were excluded in the elimination process also remain insignificant when added to the benchmark regression.
Furthermore, the benchmark results remain robust to the exclusion of individual borrower EMEs from the sample. The signs of the coefficients remain unchanged in all cases. In addition, the statistical significance also remains robust in almost all cases: the three explanatory variables from the benchmark regression remain significant at the 1% level in 101 out of 105 possible cases. The robustness of the results is particularly reassuring in the case of China, because it reveals that the benchmark results are not dominated through the regression weighting by the large and relatively stable cross-border bank lending flows to China.
The benchmark results also remain robust to the exclusion of individual lender banking systems from the sample. The sign, size and statistical significance of the coefficient estimates remain robust in almost all cases. The lender bank CDS spread, the current account balance and the US dollar share of cross-border bank lending remain significant at the 5% level in all but one of 63 possible cases.
Finally, we demonstrate that using the new Stage 1 data is critical for our analysis. In particular, when we run the benchmark regression with the consolidated data (Table 1, top row) as the dependent variable instead of the new Stage 1 data, the results become much weaker. The regression loses around half of its explanatory power. Furthermore, the change in the bank CDS spread loses its statistical significance and even reverses its sign.
In sum, the sensitivity analysis delivers two key takeaways. First, the benchmark regression and its coefficient estimates are very robust. Second, it is essential to use the exchange rate-adjusted bilateral flows from the new Stage 1 data.
Conclusion
Our analysis shows that both lender banking system and borrower EME factors explain statistically and economically significantly the cross-sectional variation in cross-border bank lending during the taper tantrum. However, it is the EME-specific factors that are more relevant from an economic perspective: the US dollar share of cross-border bank lending and the current account deficit are jointly responsible for around 70% of the explained cross-sectional variation. The rest is accounted for by the change in the average bank CDS spread during the taper tantrum.
Given that this is the first analysis of the new Stage 1 data, its findings should be interpreted with caution. For instance, the result that borrower EME factors explain more of the cross-sectional variation might partly reflect better data quality along that dimension. Borrower EMEs are natural objects for national statistical data collection efforts, whereas data on lender banking systems come from several sources that may not necessarily be fully harmonised. Future research might shed further light on such issues.
Finally, any interpretation of these results should take into account that cross-border bank flows represent only a part, albeit a considerable one, of international financial flows. Total cross-border bank claims on EMEs are of roughly the same magnitude as portfolio investments in EMEs. While cross-border bank lending is important, non-bank cross-border financing has increased even more rapidly over the past few years, as documented in BIS (2014b) and Chui at al (2014). That said, cross-border bank lending remains a major source of foreign financing in most EMEs. As a result, a better understanding of its drivers would help policymakers.
References
Avdjiev, S, Z Kuti and E Takáts (2012): "The euro area crisis and cross-border bank lending to emerging markets", BIS Quarterly Review, December, pp 37-47.
Bank for International Settlements (2014a): 84th Annual Report, "Global financial markets under the spell of monetary policy", Chapter II, June.
--- (2014b): 84th Annual Report, "Debt and the financial cycle: domestic and global", Chapter IV, June.
Committee on the Global Financial System (2010): "Funding patterns and liquidity management of internationally active banks", CGFS Papers, no 39, May.
--- (2012): "Improving the BIS international banking statistics", CGFS Papers, no 47, November.
Chui, M, I Fender and V Sushko (2014): "Risks related to EME corporate balance sheets: the role of leverage and currency mismatch", BIS Quarterly Review, September, pp 35-47.
McGuire, P and N Tarashev (2008): "Bank health and lending to emerging markets", BIS Quarterly Review, December, pp 67-80.
Takáts, E (2010): "Was it credit supply? Cross-border bank lending to emerging market economies during the financial crisis", BIS Quarterly Review, June, pp 49-56.
1 The authors thank Claudio Borio, Dietrich Domanski, Patrick McGuire, Hyun Song Shin, Christian Upper and Philip Wooldridge for useful comments and discussions. Bilyana Bogdanova and Emese Kuruc provided excellent research assistance. The views expressed are those of the authors and do not necessarily reflect those of the BIS.
2 Access to these data is currently limited to central banks and other reporting authorities. Enhanced data will be made available more widely when their availability and completeness improve.
3 Strictly speaking, the nationality of the lending bank identifies the country of ownership, and not necessarily that of the decision-making unit. In general, the nationality of ownership and decision-making are more likely to coincide in banking systems that are more centralised (eg in the case of German and French banks) - and, by the same token, they are less likely to do so in more decentralised banking systems (eg with Spanish banks). However, in the case of cross-border bank lending, the overlap between the countries of ownership and decision-making is likely to be stronger than in the case of local lending - which makes nationality a reasonable, though imperfect, proxy for decision-making in this instance. See CGFS (2010) for further discussion of models for international banking.
4 For instance, when we repeat the full analysis with currency-unadjusted consolidated data, the results of our benchmark estimation change drastically. For details, see the section on sensitivity analysis below.
5 In order to ensure that our sample is representative, we exclude lender national banking systems whose home country had not started providing complete breakdowns for the Stage 1 data as of Q3 2012 and whose cross-border claims on EMEs are primarily booked in the home country. For confidentiality reasons, we do not list the lender national banking systems included in our sample.
6 The sample selection for EMEs is based on the locational data by residence. These values may exceed those obtained from the new Stage 1 data because some BIS reporting countries do not yet report Stage 1 data. We exclude offshore financial centres from the sample.
7 The exact definitions of all potential explanatory variables are available upon request.