Highlights of the BIS international statistics
The BIS, in cooperation with central banks and monetary authorities worldwide, compiles and disseminates data on activity in international financial markets. This chapter summarises the latest data for the international banking and OTC derivatives markets, available up to mid-2014. A box looks at the sectoral composition of offshore borrowing of EME non-financial corporations.1
Takeaways
- International banking activity expanded for a second consecutive quarter between end-March and end-June 2014, partially reversing the sustained contraction experienced in 2012 and 2013. The annual growth rate of cross-border claims went up to 1.2% in the year to end-June 2014, its first move into positive territory since late 2011.
- Banks' cross-border claims on emerging market economies (EMEs) continued their recovery from the "taper tantrum" of mid-2013.
- Increases in the second quarter of 2014 were concentrated in Asia, with China again receiving substantial inflows.
- Claims on China continued to grow at annual rates of close to 50%. The latest increase took the outstanding stock of cross-border claims on China to $1.1 trillion, by far the largest in the emerging market world and the seventh largest overall.
- Cross-border claims on emerging Europe declined, with credit to Russia, Hungary and Ukraine contracting the most.
- Positions in over-the-counter (OTC) derivatives retreated slightly in the first half of 2014. The notional amount of outstanding contracts fell to $691 trillion at end-June 2014, from $711 trillion at end-2013.
- Central clearing by market participants advanced further, reaching 27% of notional credit default swaps (CDS) outstanding at end-June 2014, up from 23% one year earlier. In addition, bilateral netting agreements reduced the net market value of outstanding CDS contracts, which provides a measure of exposure to counterparty credit risk, to 23% of their gross market value.
- The classification by sector of foreign affiliates of EME non-financial corporations sheds light on the risk profile of their offshore debt. Non-financial affiliates are presumably more likely than financial affiliates to be engaged in activities other than providing funding for the parent. The split between financial and non-financial subsidiaries varies greatly across countries and industries.
Recent developments in the international banking market
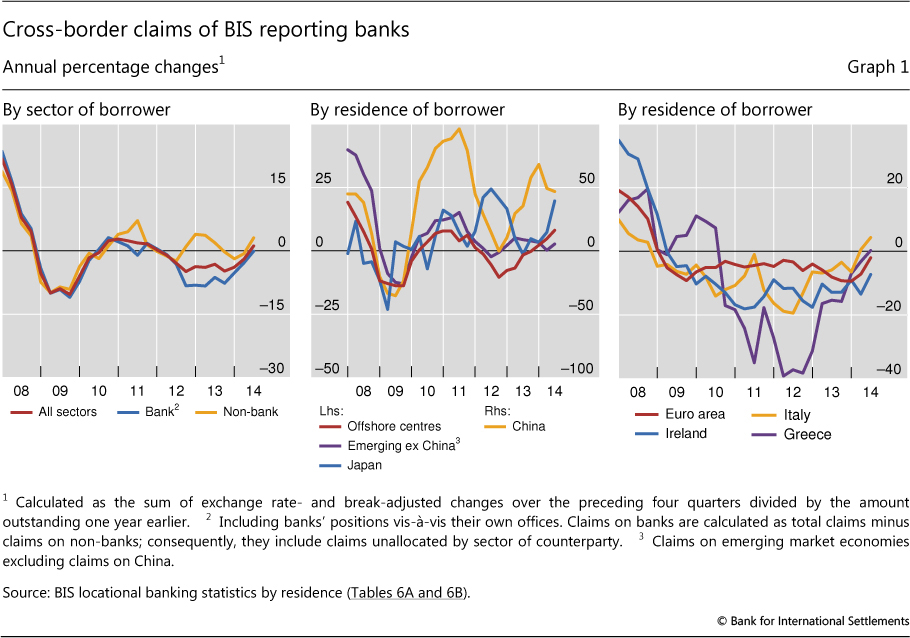
Between end-March and end-June 2014, international banking activity expanded for a second consecutive quarter following the sustained contraction of 2012 and 2013. The cross-border claims of BIS reporting banks rose by $401 billion to $30.0 trillion. At 1.2% in the year to end-June 2014, this was the first increase in the annual growth rate of cross-border claims since late 2011 (Graph 1, left-hand panel). The modest recovery in international lending during the second quarter appears to have coincided with a continued strengthening of risk appetite; nevertheless, international credit flows through banks remained smaller than the respective flows through the bond market.2
The strongest component of cross-border banking activity was claims on non-bank borrowers. They rose by $207 billion between end-March and end-June 2014, taking the year-on-year growth rate to 3% (Graph 1, left-hand panel). Cross-border claims on banking offices, which in the locational banking statistics3 include banks' own offices, also increased (by $194 billion) during the second quarter of 2014, continuing the pickup that had started in the first. Outstanding cross-border claims on non-bank borrowers thus totalled $12.3 trillion at end-June 2014, near their pre-crisis peak in 2008. By contrast, at $17.7 trillion, the outstanding stock of interbank claims remained about 22% below its pre-crisis peak.
The consolidated banking statistics4 provide a more detailed sectoral breakdown of counterparties than the locational statistics and yield further insights into the sectors receiving credit. The recent increases in cross-border claims on non-bank borrowers went mainly to non-bank financial institutions, non-financial corporations and households, grouped together as the non-bank private sector. This is a departure from the post-2008 pattern of lending to governments. The outstanding stock of consolidated international claims (on an immediate borrower basis) on the non-bank private sector rose by $139 billion to $9.5 trillion at end-June 2014.5 By comparison, claims on public sector borrowers increased by $61 billion to $3.1 trillion.
The growth in claims on non-bank borrowers was especially strong for offshore financial centres. The locational banking statistics indicate that, between end-March and end-June 2014, BIS reporting banks increased cross-border lending to non-bank borrowers in offshore centres by $62 billion. The latest quarterly expansion raised the annual growth rate to 10% and took the outstanding stock of claims on non-bank entities in offshore centres to $1.8 trillion as of end-June 2014. Most of the funds were channelled to entities in the Cayman Islands - where many international investment funds, especially hedge funds, are domiciled - with smaller amounts flowing to non-banks in Hong Kong SAR and Singapore.
The increase in total cross-border claims was well spread across borrowing countries in the second quarter of 2014. Claims on Japan rose by $32 billion, resulting in a growth rate of 20% in the year to end-June 2014 (Graph 1, centre panel). This took the outstanding stock of claims on Japan to $1.1 trillion, including banks' positions vis-à-vis their own offices. Claims on borrowers in the euro area, including cross-border claims between countries within the currency zone, rose by $225 billion. This was the largest quarterly expansion since 2008. It slowed the annual rate of contraction in cross-border claims on the euro area from -7% as of end-March 2014 to -2% as of end-June 2014 (Graph 1, right-hand panel).
Inflows were recorded by some euro area members that had previously experienced substantial drops in cross-border credit. Cross-border claims on Italy rose by $35 billion, resulting in a 4% increase in claims compared with a year earlier (Graph 1, right-hand panel). Ireland saw inflows of $11 billion, which slowed the annual pace of contraction to -7%.
Credit to emerging market economies
International lending to emerging market economies also expanded during the second quarter of 2014, continuing the recovery from the taper tantrum of mid-2013.6 The $98 billion increase took the annual growth rate to 12%.
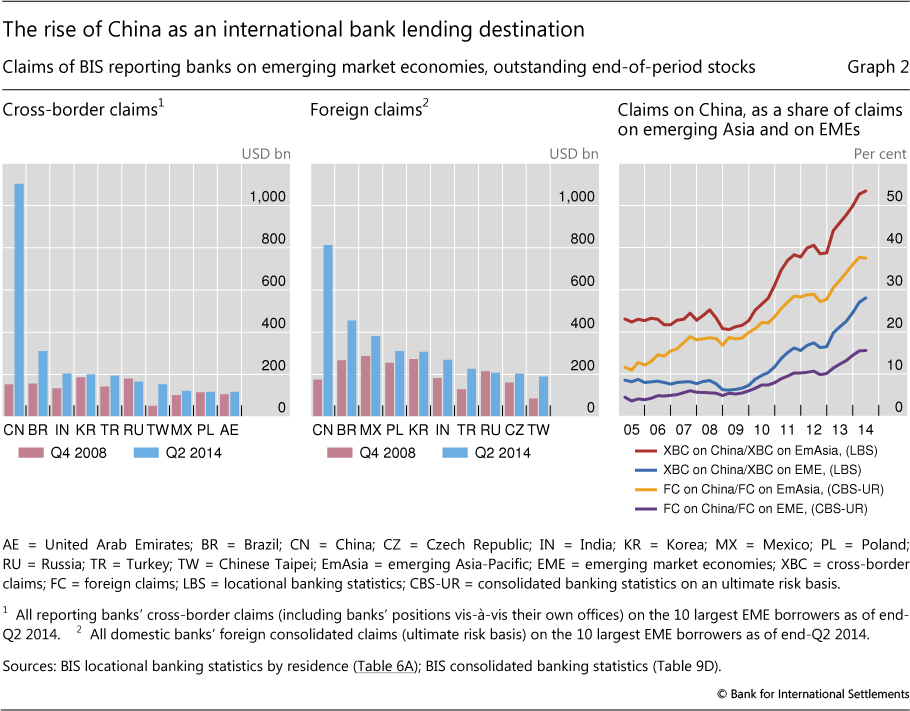
China again dominated inflows to EMEs. Cross-border claims on the country increased by $65 billion during Q2 2014 and were up by 47% in the year to end-June 2014 (Graph 1, centre panel). Owing to such rapid growth, China has become by far the largest EME borrower for BIS reporting banks. Outstanding cross-border claims on residents of China totalled $1.1 trillion at end-June 2014, compared with $311 billion on Brazil and slightly more than $200 billion each on India and Korea (Graph 2, left-hand panel). Globally, China ranked seventh overall, just behind the Netherlands, but immediately ahead of Japan. A key factor behind the surge was transactions between mainland and overseas offices of Chinese banks. Yet even on a consolidated basis - that is, after excluding inter-office transactions - and taking account of foreign banks' claims booked via their affiliates in China, BIS reporting banks' exposure to China was almost twice as large as that to any other emerging market economy (Graph 2, centre panel). At end-June 2014, it stood at $813 billion, compared with $456 billion vis-à-vis Brazil and $381 billion vis-à-vis Mexico (for consolidated foreign claims on an ultimate risk basis). As recently as 2009, China was not even among BIS reporting banks' top five foreign EME exposures.
The current status of China as the premier EME international bank lending destination is the result of a remarkable evolution that has taken place largely since the financial crisis (Graph 2, right-hand panel). On an unconsolidated basis, as recently as at end-2008, China accounted for 6% of cross-border claims on all EMEs and for 21% of those on emerging Asia. By mid-2014, those two shares had risen to 28% and 53%, respectively. On a consolidated basis, similar dynamics have played out. Namely, China's share of BIS reporting banks' foreign claims on all EMEs has grown from 5% at end-2008 to 16% at mid-2014. During the same period, China's share in foreign claims on emerging Asia has risen from 17% to 38%.
Excluding China, cross-border claims on emerging market economies rose by $33 billion between end-March and end-June 2014, up 2.7% year on year (Graph 1, centre panel). Increases were concentrated in Asia. Claims on Korea grew by $13 billion in Q2 2014 and 6% over the year, while those on Indonesia increased by $5 billion and 18%, respectively. Claims on Latin America rose modestly ($3 billion, 2%).
Emerging Europe was an exception to the general pattern of increases in cross-border claims in the second quarter. Cross-border lending to the region contracted by $2.1 billion during the quarter, and by 5% year on year. Credit to a few countries grew, notably to Turkey (up by $7 billion during the quarter, 0% year on year). However, these increases were offset by declines vis-à-vis Russia (-$6 billion, -10%), Hungary (-$3 billion, -13%) and Ukraine (-$2 billion, -18%).
In Russia and Ukraine, foreign banks' claims booked via local affiliates, which tend to be locally funded, held up better than cross-border claims. Adjusted for exchange rate movements, local claims in local currency on Russian residents went up about 5% at end-June 2014 compared with a year earlier. Those on residents of Ukraine fell by about 3%. Consequently, those foreign banks with sizeable local operations in Russia and Ukraine, particularly Austrian, French and Italian banks, saw smaller declines in their total foreign claims - cross-border plus local claims - than banks with predominantly cross-border claims, such as German, Japanese, UK and US banks.
In addition to their foreign claims, BIS reporting banks had other potential exposures - comprising derivatives contracts, guarantees extended and credit commitments - to residents of Russia and Ukraine totalling $156 billion and $17 billion, respectively. The majority ($130 billion and $16 billion) of these exposures were in the form of guarantees extended, which primarily represent the contingent liabilities of CDS protection sellers (at notional values). Importantly, such CDS-related contingent liabilities are usually reported on a gross basis, without taking account of netting agreements or collateral. They thus represent a ceiling on banks' CDS-related exposures to a given country. While other potential exposures to Russia did not change much between end-2013 and end-June 2014, those to Ukraine declined by about $2 billion owing to a reduction in banks' credit commitments.
The OTC derivatives market in the first half of 2014
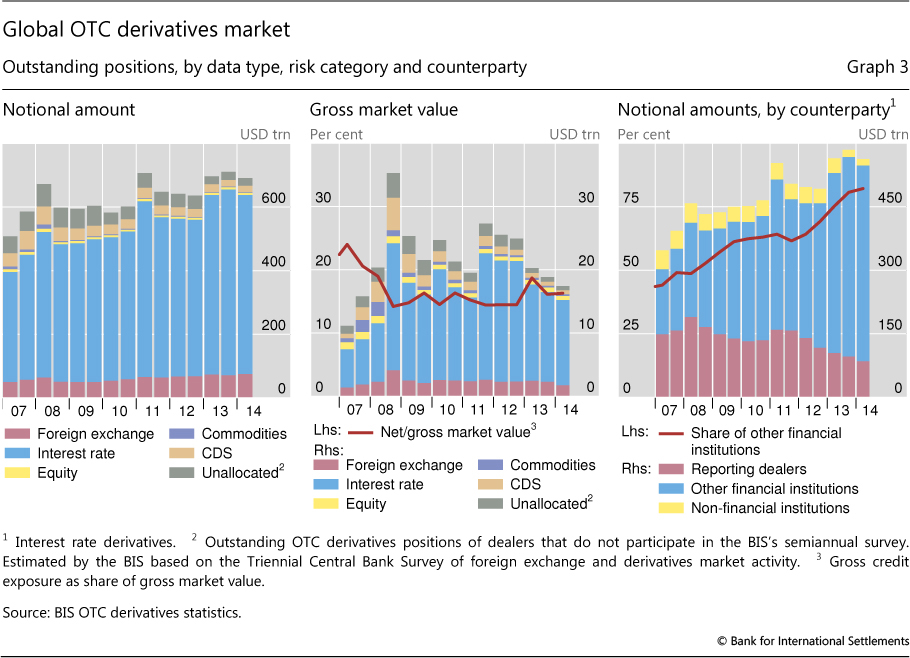
Activity in over-the-counter derivatives markets contracted slightly in the first half of 2014. Notional amounts of outstanding OTC derivatives contracts fell by 3% to $691 trillion at end-June 2014 (Graph 3, left-hand panel). The gross market value of contracts, which measures the cost of replacing outstanding contracts at market prices, fell by 7% to $17 trillion at end-June 2014 (Graph 3, centre panel). Gross credit exposures - a measure of dealers' exposure after accounting for legally enforceable netting agreements but before collateral - remained roughly unchanged. Amounting to $2.8 trillion at end-June 2014, this gauge of counterparty risk stood at 16.3% of gross market values, about the same as half a year earlier (Graph 3, centre panel).
The contraction in aggregate notional derivatives positions was largely driven by the interest rate segment. Notional amounts of interest rate derivatives contracts stood at $563 trillion at mid-2014, about $20 trillion below the volume recorded at end-2013. Outstanding volumes of interest rate swaps fell by 8% to $421 trillion. An important driver of the fall in notional values has been the elimination of redundant swap contracts via trade compression, which has expanded significantly in 2014.7 The contraction in swap positions was partly offset by rising activity in the forward rate agreement segment, where notional contract volumes expanded by 17% to $93 trillion. Outstanding amounts of fixed income options, by contrast, remained largely unchanged.
Gross market values of interest rate derivatives have declined by 5% since late 2013 and hence by slightly more than the notional amounts. At $13 trillion, the market values of outstanding interest rate derivatives positions at end-June 2014 were one third below their recent peak at end-2011. Such declines can generally be traced to a narrowing of the gap between market interest rates on the reporting date and the rates prevailing at contract inception.8 In the first half of 2014, the drop in market value was largely confined to contracts denominated in US dollars. For euro- and yen-denominated contracts, gross market values increased between end-2013 and end-June 2014, to $7.4 trillion and $0.8 trillion, respectively. These movements probably reflect the divergence in market interest rates, which declined by more in euro and yen markets in the first half of 2014 than in the US dollar market.9
The distribution of interest rate derivatives by counterparty points to a continued shift in activity towards financial institutions other than dealers (Graph 3, right-hand panel). Contracts between dealers and other financial institutions stood at $463 trillion at end-June 2014, or 82% of all contracts, up from about one half at end-2008. A potential driver could be the increased use of derivatives by asset management firms and a general shift away from the traditional dealer-centric market structure.10 That said, the trend towards central clearing of OTC contracts also plays an important role, as it may overstate growth in notional amounts for other financial institutions. Once a trade between a dealer and its counterparty is novated to the central counterparty (CCP), it becomes two outstanding contracts with the CCP.11
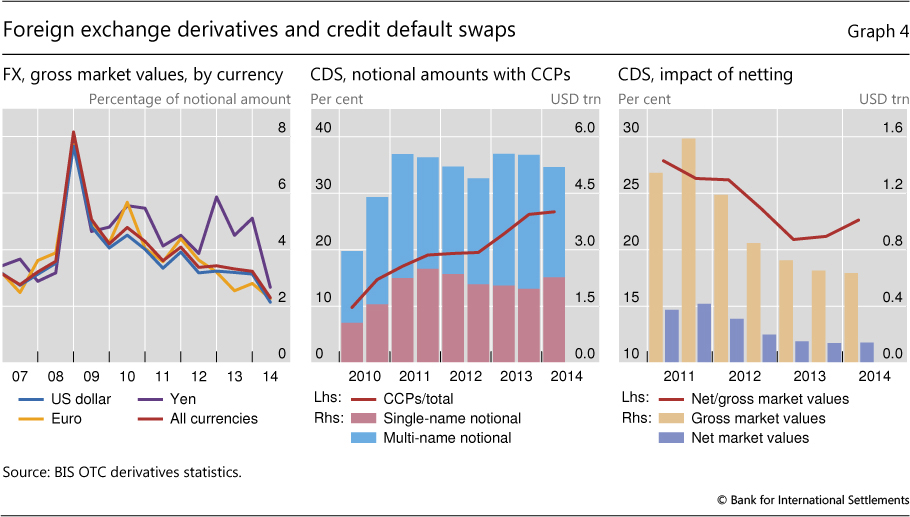
Notional amounts of outstanding foreign exchange (FX) contracts moved up by 6% to $75 trillion at mid-2014. The pickup in FX OTC derivatives volumes was fairly evenly distributed across the main instruments (forwards and FX swaps, currency swaps and options). At the same time, the market values of outstanding FX derivatives plunged by 25% to the lowest level (as a share of notionals) in several years (Graph 4, left-hand panel). The market value declined to $1.7 trillion at end-June 2014 from $2.3 trillion at end-2013 and $2.4 trillion at end-June 2013. Contracts against the US dollar represented 87% of the notional amount outstanding at end-June 2014 and accounted for most of the decline in gross market values. The market values of FX swaps, forwards and options linked to the yen declined by more than 50% in the first half of 2014, a period when the main yen exchange rate movements stabilised and FX volatility receded from the elevated levels seen in 2013.
What does the sectoral classification of offshore affiliates tell us about risks?
Branimir Gruić, Christian Upper and Agustín Villar
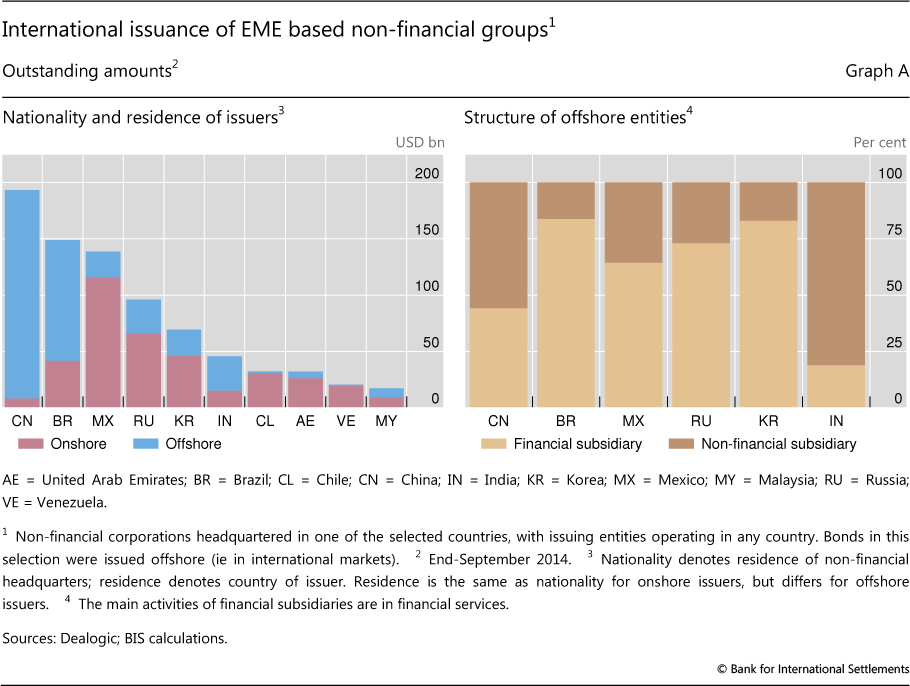
Around one half of the outstanding international debt securities of non-financial corporations headquartered in major EMEs was issued through subsidiaries abroad, albeit with significant variation between countries (Graph A, left-hand panel). This debt does not show up in the residence-based external debt statistics, which therefore paint an overly benign picture of the non-financial corporate sector's indebtedness. But the risk profile of offshore debt is likely to be very different depending on whether the issuing affiliate is a fully fledged firm with significant operations in the country of residence or if it is merely a conduit channelling funds to the parent.
 Unfortunately, information on the full set of activities of offshore subsidiaries is not available at the aggregate level. That said, the sectoral classification of affiliates can help. Specifically, the non-financial affiliates of non-financial corporations are presumably more likely than purely financial affiliates to engage in activities other than providing funding for the parent. If so, the sector of the issuing entity could shed at least some light on the risk profile of offshore debt.
The sector classification of offshore affiliates shows considerable variation between countries, even in the case of those with similar offshore shares. More than 80% of offshore issuance by firms headquartered in India is by non-financial subsidiaries (Graph A, right-hand panel). Much of this debt is raised by firms in the Metal & Steel sector with large operations around the world. Chinese firms also issue heavily through non-financial subsidiaries abroad, which account for well over one half of issuance abroad by firms headquartered in China. By contrast, Brazilian and Korean firms issue primarily through financial subsidiaries.
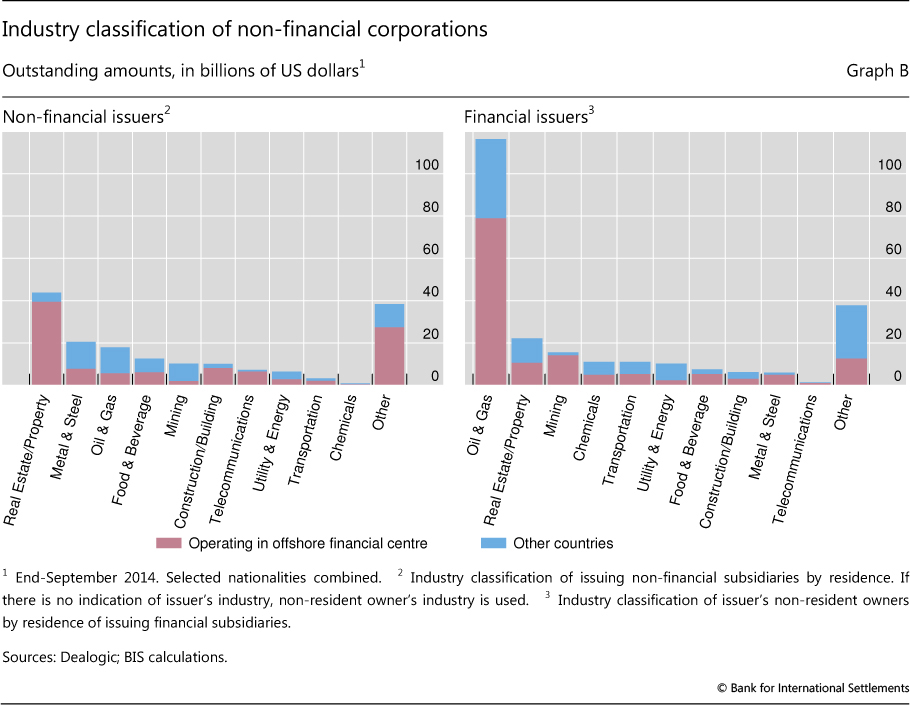
The split between financial and non-financial subsidiary also varies between industries. For instance, firms operating in the Oil & Gas sector overwhelmingly issue through financial subsidiaries (Graph B), suggesting that most of the funding is being channelled to the parent. For most other sectors, the proportion of debt issued by financial and non-financial subsidiaries is roughly similar.
Using the sectoral split as a proxy for risk profiles does have its limits. This is illustrated by the Real Estate/Property sector. The bulk of issuance from this sector is by firms headquartered in China, which issue mostly through non-financial affiliates. A possible reason is that non-financial affiliates can hold property that may serve as collateral. But this property need not be located in the country of issuance; it could equally well be situated in China or a third country. In fact, the vast majority of immediate (offshore) issuers belonging to this sector are resident in offshore financial centres (Graph B) such as the Cayman Islands that have tiny property markets compared with the volume of bonds outstanding.
International debt securities are those issued in a country other than the one in which the issuer resides. This analysis ignores local issuance, ie in the country of the issuer. For previous discussions of offshore borrowing, see R McCauley, C Upper and A Villar, "Emerging market debt securities issuance in offshore centres", BIS Quarterly Review, September 2013, pp 22-23; and B Gruić, M Hattori and H S Shin, "Recent changes in global credit intermediation and potential risks", BIS Quarterly Review, September 2014, pp 17-18. For a discussion of how the repatriation of such funds shows up in balance of payments statistics, see S Avdjiev, M Chui and H S Shin, "Non-financial corporations from emerging market economies and capital flows", BIS Quarterly Review, December 2014, pp 67-77. See M Chui, I Fender and V Sushko, "Risks related to EME corporate balance sheets: the role of leverage and currency mismatch", BIS Quarterly Review, September 2014, pp 35-47, for a discussion of the risks associated with international debt issuance. In some cases, foreign-registered financial subsidiaries pool funding for a global business across different national markets. Aggregating funding for different business units in this way can help achieve economies of scale in issuance while the proceeds can be distributed across different national markets. Foreign investors' holdings of such securities do not affect the external debt statistics of the parent's country.
Outstanding volumes of CDS contracts continued to decline, dropping to $19 trillion at end-June 2014, mostly due to a fall in inter-dealer positions and the continued elimination of redundant contracts. This means that aggregate positions in credit derivatives are now much smaller than before the crisis, when volumes peaked at $58 trillion at end-2007. The notional amount for contracts between reporting dealers fell to $10 trillion at end-June 2014. By contrast, notional amounts outstanding with banks and securities firms picked up to $2 trillion. While trade compression continued to eliminate redundant contracts, the volume of compressions in the CDS segment has slowed since peaking in 2008-09. That said, trade compression made further inroads into other OTC market segments, particularly CCP-cleared interest rate swaps.
Central clearing remained an important theme in OTC derivatives markets during the first half of 2014. It is high on the global regulatory agenda for reforming OTC derivatives markets with a view to reducing systemic risks. Contracts with CCPs rose to account for 27% of all CDS contracts at end-June 2014, up from 23% one year earlier. The share of CCPs was highest for multi-name credit derivatives, at 34% (Graph 4, centre panel). Contracts on CDS indices in the multi-name segment tend to be more standardised, making them more amenable to central clearing than single-name contracts.
Owing in part to the shift towards central clearing, the CDS market has seen an increase in netting. Netting enables market participants to reduce their counterparty exposure by offsetting contracts with negative market values against those with positive ones. A comparison of net market values with gross market values indicates the prevalence of netting agreements. As a result of the increased use of such agreements, net market values as a percentage of gross market values fell to 21% at end-2013. Recently, this share has ticked up again, to 23% at end-June 2014 (Graph 4, right-hand panel). The prevalence of netting is greatest for CDS contracts with other dealers and CCPs, where it reduced the ratio of net to gross market values to 15% and 16%, respectively, at end-June 2014. It is lowest for contracts with insurance companies (85%) and non-financial customers (75%).
1 This article was prepared by Stefan Avdjiev (stefan.avdjiev@bis.org) and Cathérine Koch (catherine.koch@bis.org). Statistical support was provided by Jeff Slee. The section on the OTC derivatives statistics was prepared by Andreas Schrimpf (andreas.schrimpf@bis.org), with statistical support by Denis Pêtre.
2 See BIS, "Global liquidity: selected indicators", memorandum, 8 October 2014.
3 The locational banking statistics are structured according to the location of banking offices and capture the activity of all internationally active banking offices in the reporting country regardless of the nationality of the parent bank. Banks record their positions on an unconsolidated basis, including those vis-à-vis their own offices in other countries.
4 The consolidated banking statistics are structured according to the nationality of reporting banks and are reported on a worldwide consolidated basis, ie excluding positions between affiliates of the same banking group. Banks consolidate their inter-office positions and report only their claims on unrelated borrowers.
5 The consolidated banking statistics do not contain a currency breakdown, which precludes the calculation of exchange rate-adjusted changes that is possible for the locational banking statistics. For example, the depreciation of the euro against the US dollar between end-March and end-June 2014 resulted in a decline in the reported US dollar value of the outstanding stock of claims denominated in euros. Conversely, the appreciation of the yen against the US dollar over the same period resulted in an increase in the reported US dollar value of the outstanding stock of claims denominated in yen.
6 See S Avdjiev and E Takáts, "Cross-border bank lending during the taper tantrum: the role of emerging market fundamentals", BIS Quarterly Review, September 2014, pp 49-60.
7 Compression is a process for tearing up trades, which enables economically redundant derivatives trades to be terminated early without changing the net position of each participant. For statistics on multilateral compressions, see TriOptima, www.trioptima.com/resource-center/statistics/triReduce.html.
8 At the inception of an interest rate swap contract, the market value is zero, ie the expected value of fixed interest rate cash flows over the life of the swap is equal to the expected value of floating interest rate cash flows.
9 See BIS, "Volatility stirs, markets unshaken", BIS Quarterly Review, September 2014, pp 1-11.
10 See D Rime and A Schrimpf, "The anatomy of the global FX market through the lens of the 2013 Triennial Survey", BIS Quarterly Review, December 2013, pp 27-43, for a characterisation of the evolving market structure in foreign exchange OTC markets, which has become less dealer-centric in recent years and features a greater participation by other financial institutions (eg smaller banks, asset managers, hedge funds and proprietary trading firms). K Miyajima and I Shim, "Asset managers in emerging market economies", BIS Quarterly Review, September 2014, pp 19-34, discusses the behaviour of asset managers of emerging market asset portfolios and their use of derivatives.
11 See N Vause, "Central clearing and OTC derivatives statistics", BIS Quarterly Review, June 2011, p 26.