OTC derivatives statistics at end-December 2020
Key takeaways
- The gross market value of over-the-counter (OTC) derivatives increased by $300 billion to $15.8 trillion during the second half of 2020, led by increases in foreign exchange (FX) derivatives. The sizeable US dollar depreciation against major currencies is likely to have contributed to the rise.
- The gross credit exposure of OTC derivatives – which adjusts the gross market value for legally enforceable bilateral netting agreements (but not for collateral) – rose by $160 billion during H2 2020, to reach $3.4 trillion.
- Equity-linked derivatives, which are popular for investors seeking exposure to US equities, have been shifting towards short-term instruments.
- The clearing rate for credit derivatives has continued to rise, while that for interest rate derivatives appears to have plateaued.
Gross market value of OTC derivatives has been rising
The Covid-19-induced market turmoil and strong policy responses drove developments in derivatives markets throughout 2020. Following a notable jump in the first half of the year, the gross market value1 of outstanding derivatives contracts – which provides a measure of amounts at risk – increased by around $300 billion in the second half of 2020, to reach $15.8 trillion (Graph 1, left-hand panel).2 The most recent increase continued the upward trend since end-2018, when the gross market value was 39% lower. Gross credit exposure – which adjusts the gross market value for legally enforceable bilateral netting agreements (but not for collateral) – rose in H2 2020 by $160 billion, to reach $3.4 trillion.
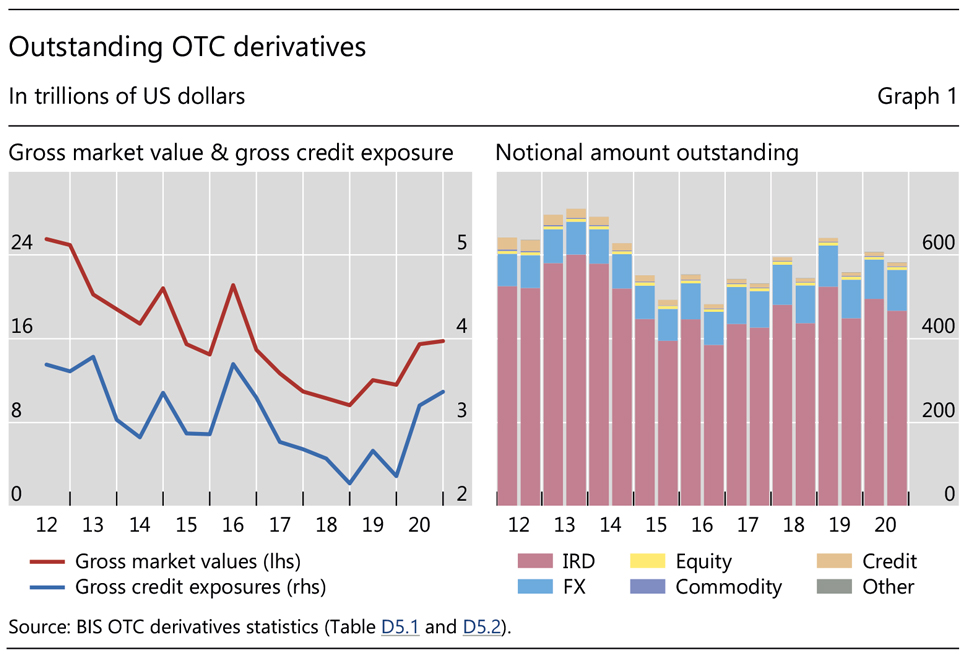
The rise in gross market value in 2020 stands in sharp contrast with the relative stability of the notional amount. Overall, it decreased by 4% to $582 trillion in H2 2020, in part reflecting a sawtooth seasonal pattern evident in the data since 2016 (Graph 1, right-hand panel); since end-2019, it in fact grew by $24 trillion (4%) year on year. Interest rate derivatives, which account for the bulk of the outstanding notional amount, drove the recent evolution: their notional value decreased by 6% to $467 trillion in H2 2020 (their sawtooth pattern is visible in the red bars).3
Dollar depreciation pushes up gross market value of FX derivatives
FX derivatives drove the overall increase in gross market value in H2 2020. Their market value rose by 21%, to reach $3.2 trillion (Graph 2, blue line). This increase coincided with large depreciation of the US dollar against other major currencies.4 Acting as the primary vehicle currency, the US dollar was on one side of more than 80% of all currency pairs (measured by both notional amount and gross market value). Sizeable US dollar exchange rate movements can lead to more trading in FX derivatives, as participants rebalance their portfolios. Unanticipated movements may generate a gap between the market value on the reporting date and that prevailing at the inception of the contracts, thus pushing up the reported gross market value.5
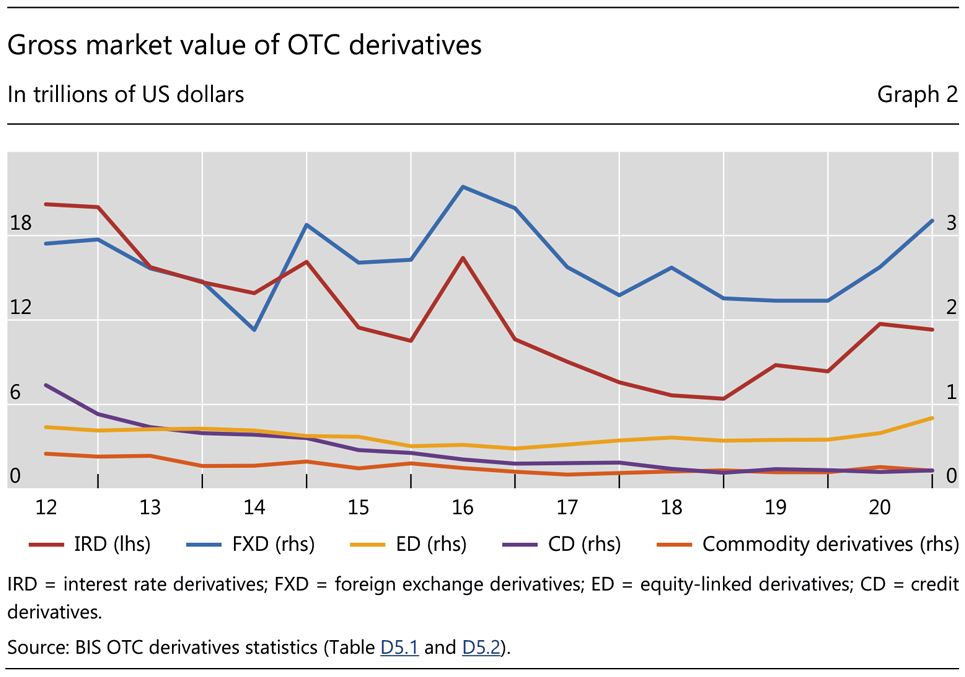
Equity-linked derivatives also contributed to the overall increase in the gross market value (Graph 2, yellow line). Their gross market value increased by a strong 28%, from $660 billion at end-June 2020 to $840 billion at end-2020, the highest level observed since 2010. Such a rise may reflect the large increases in stock prices in major markets that can lead to larger price effects and/or more trading. Over the same period, the gross market value of credit derivatives increased by 10%, from $200 billion to $220 billion. By contrast, the gross market value of other asset classes – ie interest rate derivatives and commodity derivatives – decreased in H2 2020.
Equity-linked derivatives mainly refer to US markets
Overall, the outstanding notional amount of equity-linked derivatives has remained rather stable at around $7 trillion since 2012. These include forwards, swaps and options where the underlying assets are equities or equity indexes.6
Equity-linked derivatives are increasingly popular with investors seeking exposure to US equity markets. The notional amount of US equity-linked derivatives increased from $2 trillion at end-2012 to $3.3 trillion at end-2020. Their share in total equity-linked derivatives increased from under a third to almost half (Graph 3, left-hand panel). By contrast, the notional amount of derivatives referring to European equities has trended downwards: over the past eight years, their outstanding notional dropped from $3.2 trillion to $2 trillion and their share decreased from almost half to less than a third of total equity-linked derivatives (see also Annex Graph A.4).
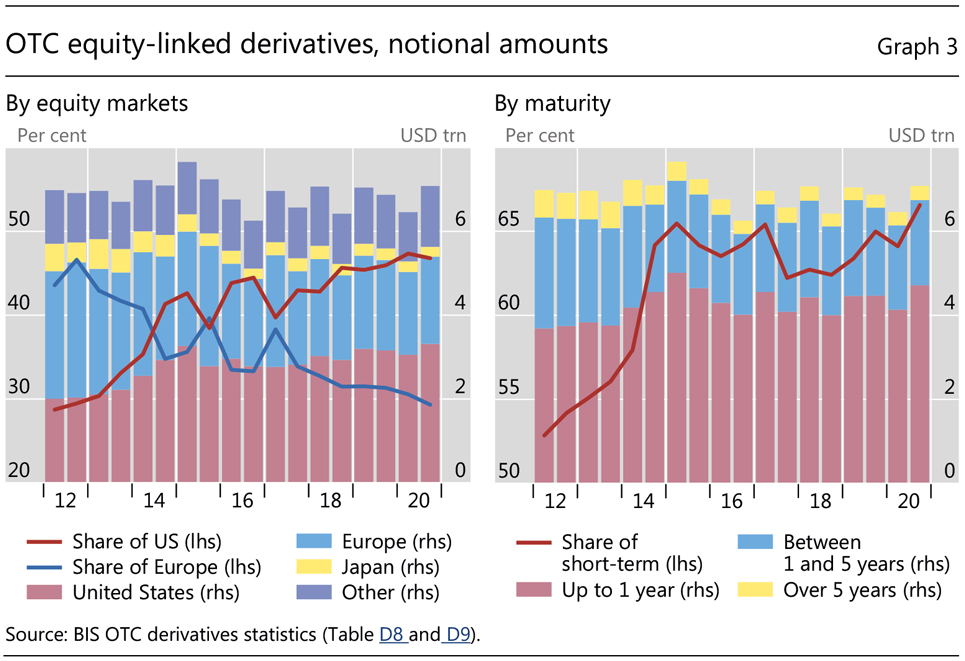
Turning to maturity structures, equity-linked derivatives have shifted towards short-term instruments. The notional amount of instruments with less than one-year maturity amounted to $4.7 trillion at end-2020, up from $3.8 trillion at end-2012. The share of these short-term instruments increased from 54% to 67% of total equity linked derivatives over the same period.
Central clearing rates for CDS continue to rise
Central clearing rates of CDS continued to trend upwards. The share of the notional amount of CDS contracts cleared by central counterparties (CCPs) rose from 60% to 63% during H2 2020 (Graph 4, left-hand panel). Year on year, this share increased by 7 percentage points from end-2019 (56%). Multi-name CDS contracts accounted for the majority of the increase, with the share cleared by CCPs increasing from 65% at end-June 2020 to 68% at end-2020 (right-hand panel). For single-name CDS, the rise in the clearing rate was more modest, from 53% to 54% over the same period.
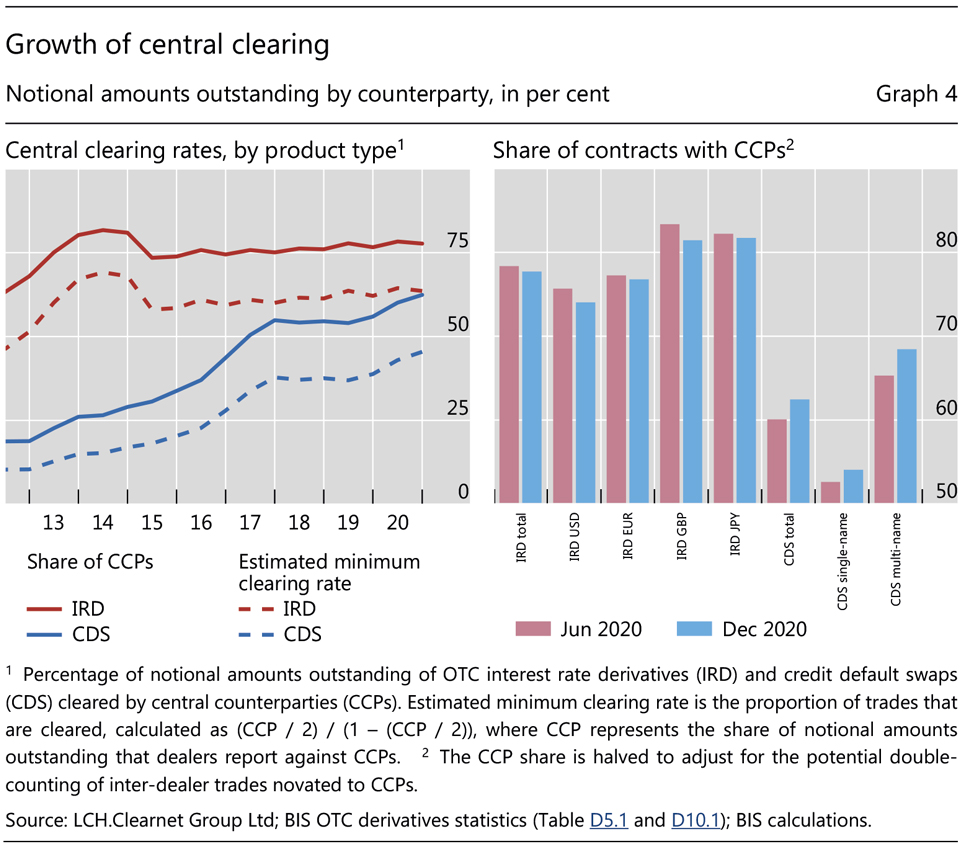
In contrast to CDS, clearing rates for interest rate derivatives seem to have plateaued, after rising rapidly in 2012–15 following the G20 mandate for greater clearing of standardised products.7 The share of interest rate derivatives cleared by CCPs declined slightly, from 78.4% to 77.7% in H2 2020. During this period, the clearing rate of USD contracts decreased from 76% to 74% and that for GBP contracts fell from 83% to 81%, while that for EUR and JPY contracts remained steadily at 77% and 82%, respectively.
1 The gross market value is the sum of the absolute values of all open contracts, with either positive or negative mark-to-market values, evaluated at market prices prevailing on the reporting date.
2 The VIX was higher at end-2020 (23) than at end-2019 (14), but lower than at end-June 2020 (35).
3 End-of-year contractions can occur if dealer banks and/or their clients shrink their derivatives positions for regulatory reporting purposes. See the previous commentary.
4 During H2 2020, the US dollar depreciated 10% against the euro, 11% against the pound sterling, and 5% against the yen (see also the BIS nominal effective exchange rates statistics). Regarding the gross market value of FX derivatives, FX adjustment is treated as a price effect.
5 If exchange rate movements are perfectly anticipated, investors will close the existing positions and enter into new contracts with fair prices (ie zero market value).
6 The default of Archegos in March 2021 brought attention to one type of OTC derivative called total return swaps, especially the ones where the underlying assets are equities. While the BIS statistics do not have a separate breakdown of total return swaps, they provide information on the broader risk category of equity-linked derivatives. Moreover, while equity derivatives are traded mainly on exchanges, the more customised contracts are often traded OTC.
7 Central clearing made significant inroads into OTC interest rate derivatives. See P Wooldridge, "Central clearing predominates in OTC interest rate derivatives markets", BIS Quarterly Review, December 2016, pp 22–4.