OTC derivatives statistics at end-December 2019
- Notional amounts of OTC derivatives rose from $544 trillion at end-December 2018 to $559 trillion at end-December 2019. This, however, corresponds to a significant fall over the last six months, which could be at least partly attributed to seasonal factors.
- The seasonal pattern in the data, whereby end-June values tend typically to be larger than end-of-year values, appears strongest in positions vis-à-vis central counterparties. Such end-of-year contractions can occur if dealer banks and/or their clients shrink their outstanding notional derivative positions for regulatory and financial reporting purposes.
- Contracts denominated in non-G4 currencies (ie excluding USD, EUR, JPY and GBP) have grown in size for both interest rate and foreign exchange derivatives, even though those denominated in US dollars remain the largest segment.
Notional amounts of OTC derivatives fall partly due to seasonal factors
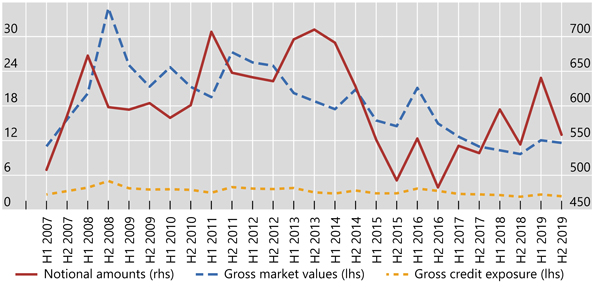
Graph 1: Outstanding notional amounts of OTC derivatives, USD trillions (interactive graph).
Source: BIS OTC derivatives statistics (Table D5.1).
Notional amounts - which determine contractual payments - declined significantly in the second half of 2019, to $559 trillion at end-2019 (Graph 1, red line), partly reflecting the seasonal pattern evident in the data since 2016. Specifically, these amounts have tended to decrease in the second half of each year, followed by a rebound in the following period, generating the sawtooth pattern observed in Graph 1. Factoring out that pattern, notional amounts have increased year on year by around $14 trillion (2.6%), from end-2018 to end-2019, and by more than 15% since end-2016.
The gross market value of these derivative contracts - which provides a measure of amounts at risk - fell slightly, from $12.1 trillion at end-June 2019 to $11.6 trillion by year-end, with interest rate contracts accounting for the bulk (72%) of that total. The gross market value appears to have stabilised in the recent years at very low levels from a historical perspective, reflecting the downward trend observed since the peak during the Great Financial Crisis (GFC) of 2007-09 (Graph 1, blue line).
Gross credit exposures (Graph 1, yellow line) - which adjust gross market values for legally enforceable bilateral netting agreements (but not for collateral) - also declined in the second half of 2019 (from $2.7 trillion at end-June 2019 to $2.4 trillion at year-end). Interestingly, these exposures have continued to fall as a share of gross market value, to 20% at end-2019 compared with the 25% high observed mid-2018 (Graph A1, right-hand panel). This recent trend appears consistent with the reported higher rates of clearing with central counterparties (CCPs), as such clearing allows for increased netting and thereby tends to lower the credit exposures of outstanding derivative contracts.
Seasonal pattern strongest for interest rate derivatives with CCPs
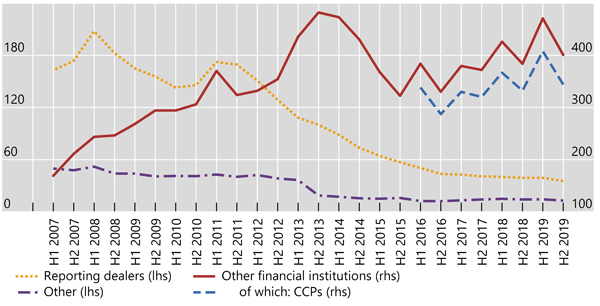
Graph 2: Outstanding notional amounts of OTC interest rate derivatives, USD trillions (interactive graph). "Other financial institutions" refers to financial counterparties except reporting dealers.
Source: BIS OTC derivatives statistics (Table D7).
The seasonality observed in outstanding notional OTC derivatives appears to be mainly driven by the patterns of interest rate derivative positions with CCPs (Graph 2, blue line), which stood at $344 trillion at end-2019. These now represent 77% of total notional amounts outstanding for interest rate derivatives, although this share has systematically dropped at year-end in recent years (Graph A3, right-hand panel). This pattern is most evident in short-term contracts of all types (roughly 50% of the total), and in interest rate swaps in particular (76%). It can also be observed from other data on cleared derivatives collected from specific CCPs.1 Such end-of-year contractions can occur if dealer banks and/or their clients shrink their outstanding notional derivative positions for regulatory and financial reporting purposes.2
In contrast, there is little seasonality in data for credit default swaps (CDS) generally, including for CDS with CCPs: notional amounts of CDS have been steadily declining since the GFC. The share of their cleared positions with CCPs has stabilised at around 55% in the most recent years (Graph A6, centre panel).
Non-G4 currencies on the rise in notional interest rate derivatives
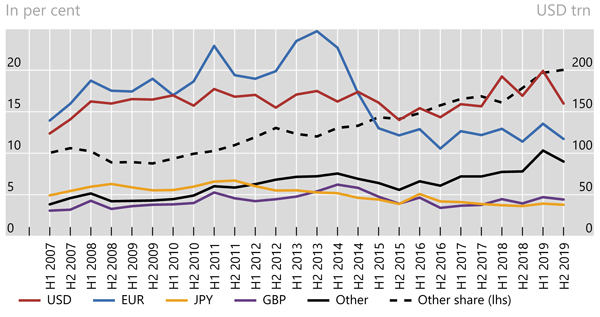
Graph 3: Outstanding notional amounts of OTC interest rate derivatives, USD trillions (interactive graph). "Other" refers to contracts denominated in currencies other than USD, EUR, JPY and GBP.
Source: BIS OTC derivatives statistics (Table D7).
The currency composition of interest rate derivatives has changed significantly over the past decade. Until end-2014, contracts denominated in euros were dominant, peaking at $247 trillion, or 41% of all outstanding contracts at end-2013 (Graph 3, blue line). Since then, these contracts have fallen in both absolute and relative terms, making US dollar-denominated contracts the prevailing ones: they amounted to $160 trillion at end-2019, or 36% of all contracts (red line). Yen- and sterling-denominated contracts have both hovered at $35-45 trillion since end-June 2017.
Interest rate derivatives denominated in currencies other than the G4 currencies (USD, EUR, JPY and GBP) have grown steadily since the late 2000s. At end-2019, they stood at $90 trillion, or 20% of all contracts, up from 9% at end-2009 (Graph 3, black lines). Contracts in the Canadian dollar, Swedish krona and Swiss franc are reported separately and represent one fourth of this category.
Notional FX contracts increasingly involve non-G4 currencies
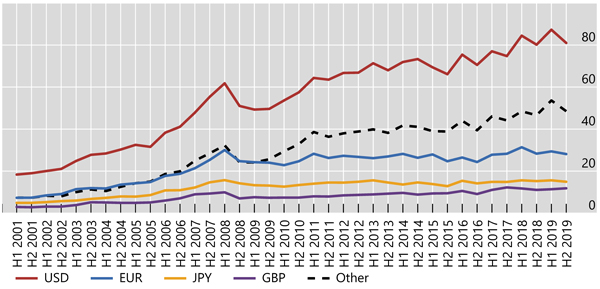
Graph 4: Outstanding notional amounts of foreign exchange OTC derivatives, by currency of leg 2, USD trillions (interactive graph). "Other" refers to contracts involving currencies other than USD, EUR, JPY and GBP.
Source: BIS OTC derivatives statistics (Table D6).
Turning to foreign exchange derivatives, their notional amounts outstanding have risen steadily since the turn of the century. The US dollar is the primary vehicle currency, being almost always (around 90% of the time) one of the two currencies exchanged in FX swaps and forwards. Another interesting feature has been the long-term increase in FX contracts involving non-G4 currencies (Graph 4). Indeed, the steady rise in contracts with the US dollar on one side (red line) has been mirrored by a parallel progression in those involving non-G4 currencies (dashed black line). By contrast, contracts involving the other G4 currencies (EUR, JPY and GBP) have stagnated since the GFC (blue, yellow and purple lines).
The recent rise in notional values of foreign exchange derivatives has been concentrated in short-term instruments. These accounted for 78% of all outstanding positions ($72 trillion) at end-2019, compared with 72% at end-2011. Outright forwards and FX swaps ($55 trillion at end-2019, or 59% of outstanding notional amounts) appear to be the main instruments driving these trends.
1 For instance from LCH Ltd, which represents roughly 90% of the cleared interest rate derivatives market according to data provided by ClarusFT.
2 For further discussion of possible factors behind such intra-year effects, see M Behn, G Mangiante, L Parisi and M Wedow, "Behind the scenes of the beauty contest: window dressing and the G-SIB framework", ECB, Working Paper Series, no 2298, July 2019; and Basel Committee on Banking Supervision, Revisions to leverage ratio disclosure requirements, June 2019. For a discussion of similar behaviour in repo markets, see Bank for International Settlements, Annual Economic Report 2018, Box III.A, June 2018.