Statistical release: BIS international banking statistics and global liquidity indicators at end-December 2023

Key takeaways
- In Q4 2023, cross-border claims fell by $377 billion as banks in several advanced economies (AEs) reported lower derivatives claims on the United Kingdom, a centre for derivatives clearing. The outstanding stock settled at $39 trillion.
- Cross-border credit (ie loans plus holdings of debt securities), however, grew by $319 billion in Q4, driven by lending to non-banks. Banks in Japan reported higher claims on the non-financial sector in the United States.
- Cross-border dollar credit recovered in 2023, after having declined during the Federal Reserve's policy tightening and dollar appreciation in 2022.
- Credit to emerging market and developing economies (EMDEs) increased by $30 billion in Q4 2023, mostly driven by an expansion in renminbi credit.
- The BIS global liquidity indicators (GLIs) show a slight drop in US dollar-denominated foreign currency credit overall in Q4 2023; US dollar credit to EMDEs, however, grew by $12 billion.
Credit to non-banks in the United States grew in Q4 2023
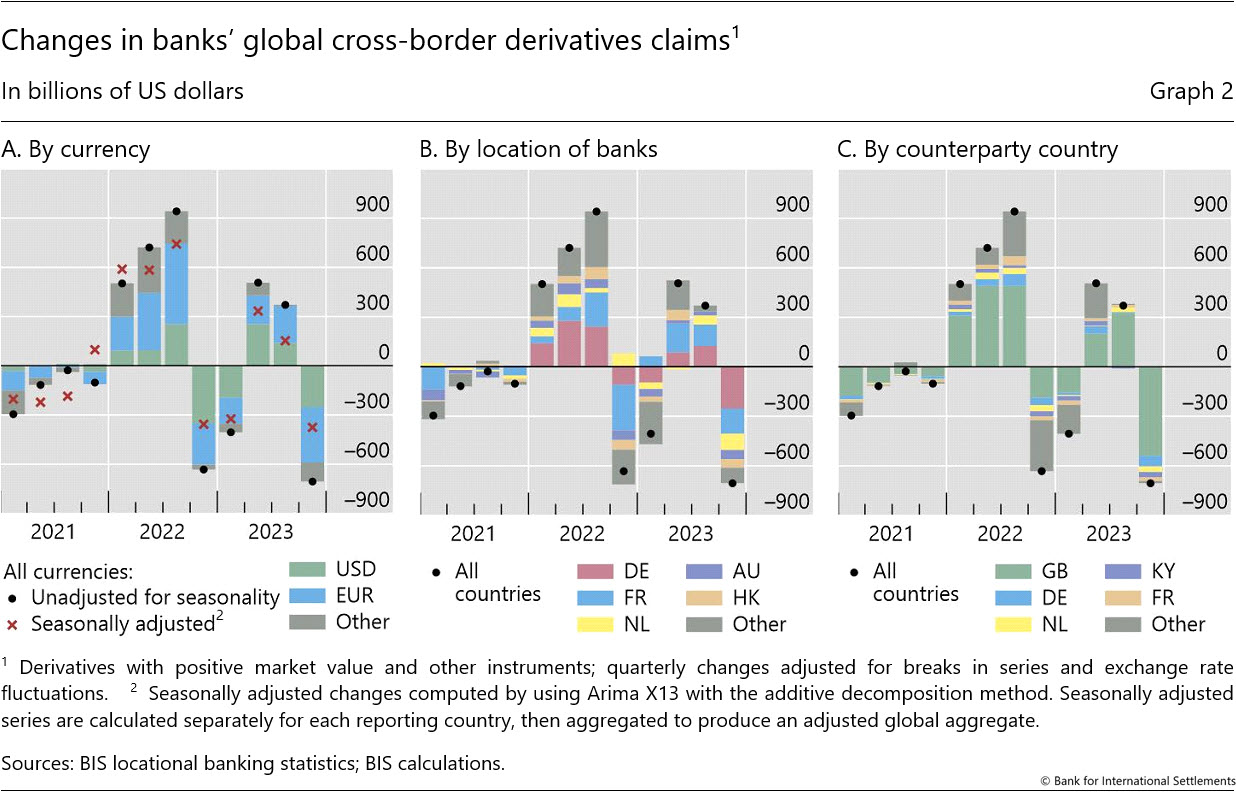
The BIS locational banking statistics (LBS) show that banks' global cross-border claims fell by $377 billion on an FX- and break-adjusted basis in Q4 2023. This pushed the outstanding stock of claims to $39 trillion (Graphs 1.A, 1.E and Annex Graph A.1), up 4% year-on-year (yoy).1 The Q4 drop was due to a $705 billion decline in the market value of derivatives and other instruments (-4% yoy). The drop was also linked to seasonal factors whereby large banks headquartered in several jurisdictions tend to reduce their positions at year-end (Graph 2.A, gap between the black dots and red crosses). Looking across currencies, cross-border dollar- and euro-denominated derivatives claims fell by a combined $590 billion in Q4 2023, as banks in AEs, most notably Germany, France and the Netherlands, reduced their claims on the United Kingdom, a major centre for derivatives clearing (Graphs 2.B and 2.C).
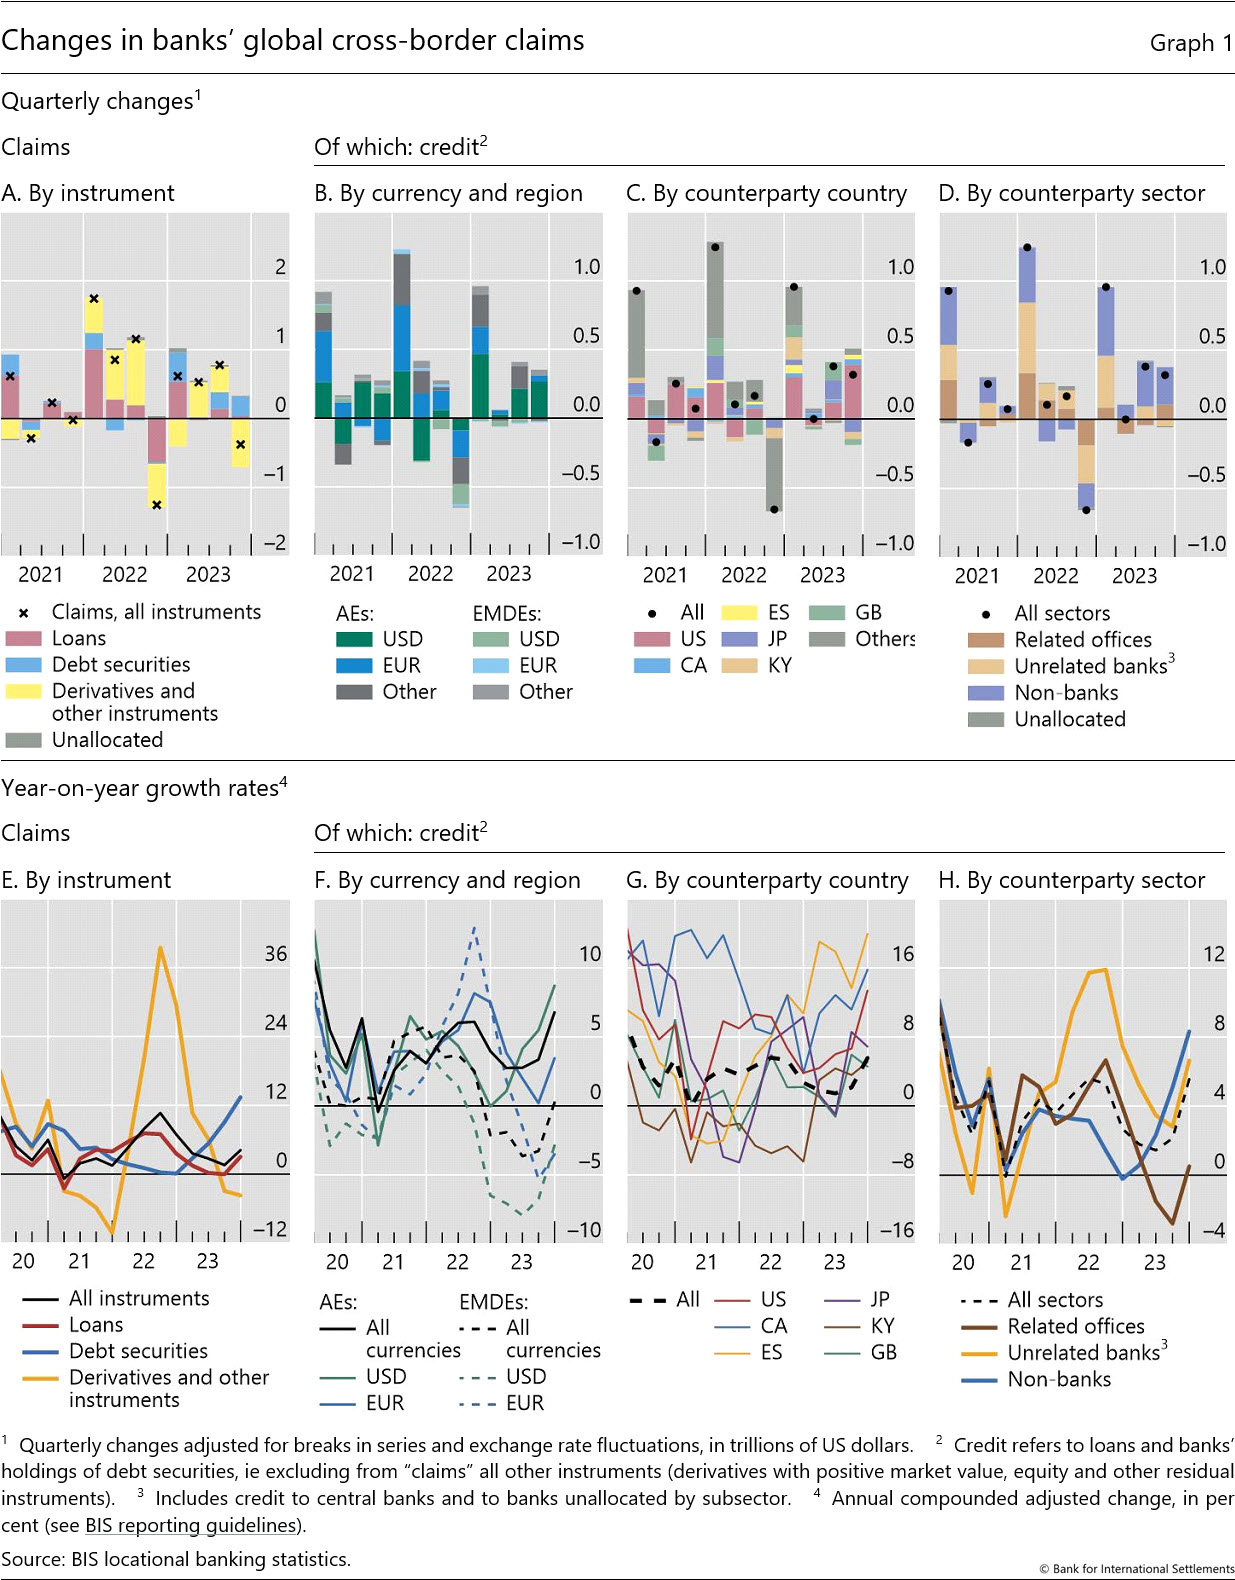
In contrast to overall claims, cross-border bank credit - which includes loans and holdings of debt securities but excludes derivatives - expanded by $319 billion in Q4 2023 (+6% yoy), as banks reported greater debt securities claims (+$284 billion or +13% yoy). Credit to borrowers in the United States, Canada and Spain rose the most, growing at double-digit rates on a year-on-year basis (Graphs 1.C and 1.G). This pushed the growth rate of credit to all AEs to 7% yoy (Graph 1.F, solid black line). Moreover, cross-border bank credit to EMDEs showed signs of recovery in Q4 (+$30 billion), with yoy growth rates turning slightly positive following three quarters of negative growth in 2023 (Graph 1.F, dashed black line).
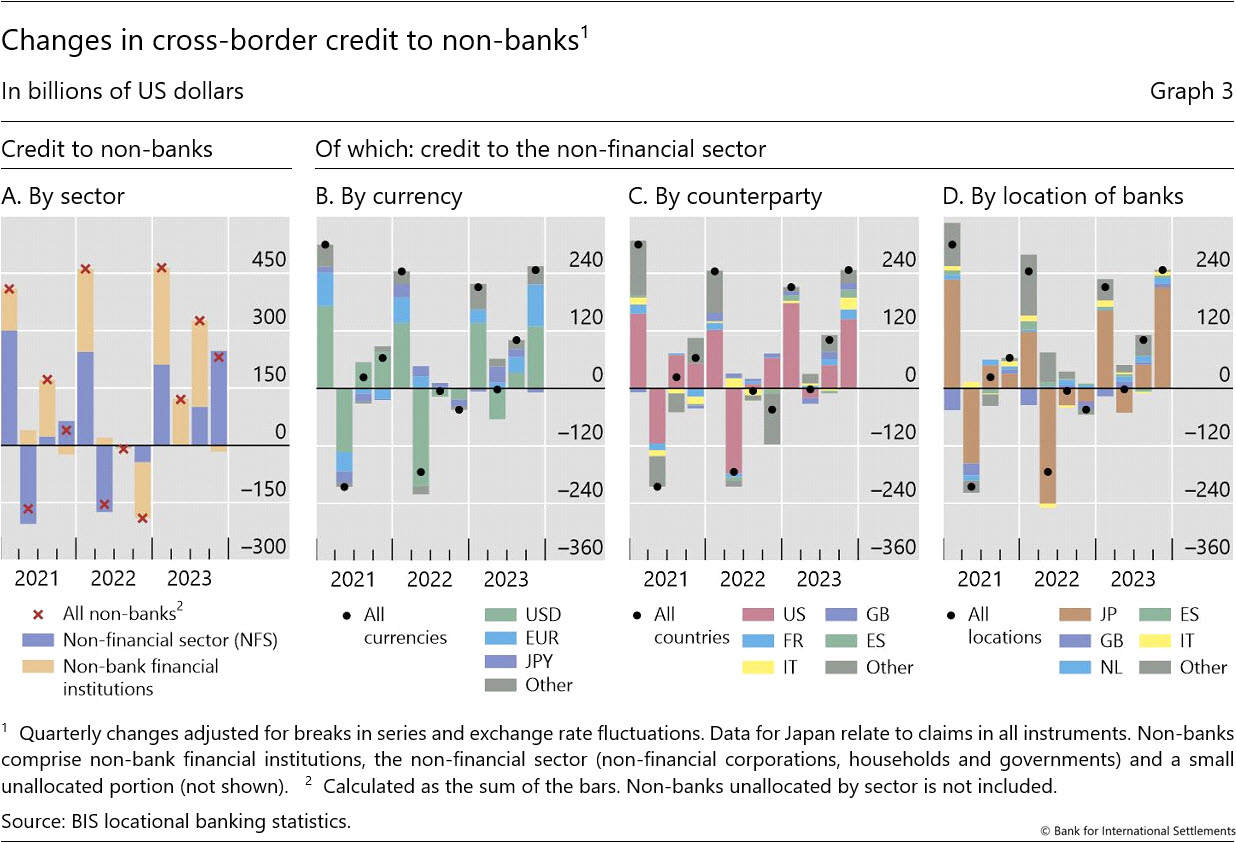
Much of the increase in global cross-border credit was driven by lending to non-bank borrowers. Credit to these borrowers grew by 8% yoy in Q4 2023, an annual rate not seen since early 2020 (Graph 1.H). Within the non-bank sector, credit to the non-financial sector (NFS) rose by a notable $247 billion (Graph 3.A). By contrast, credit to non-bank financial institutions fell by $16 billion, following a surge during the first three quarters of 2023 (+$600 billion) (Graph 3.A).
US dollar- and euro-denominated bank credit drove the growth of credit to NFS borrowers. In Q4, credit denominated in these currencies increased by $130 billion and $87 billion, respectively, while yen-denominated credit edged down (Graph 3.B). The biggest portion of new credit went to borrowers in the United States (+$144 billion), followed by those in Italy and France (Graph 3.C). The bulk of the overall increase was booked by banks located in Japan, mainly as holdings of debt securities issued by the NFS in the United States (Graphs 3.C, 3.D and 4.B).
Cross-border dollar credit amid US policy tightening
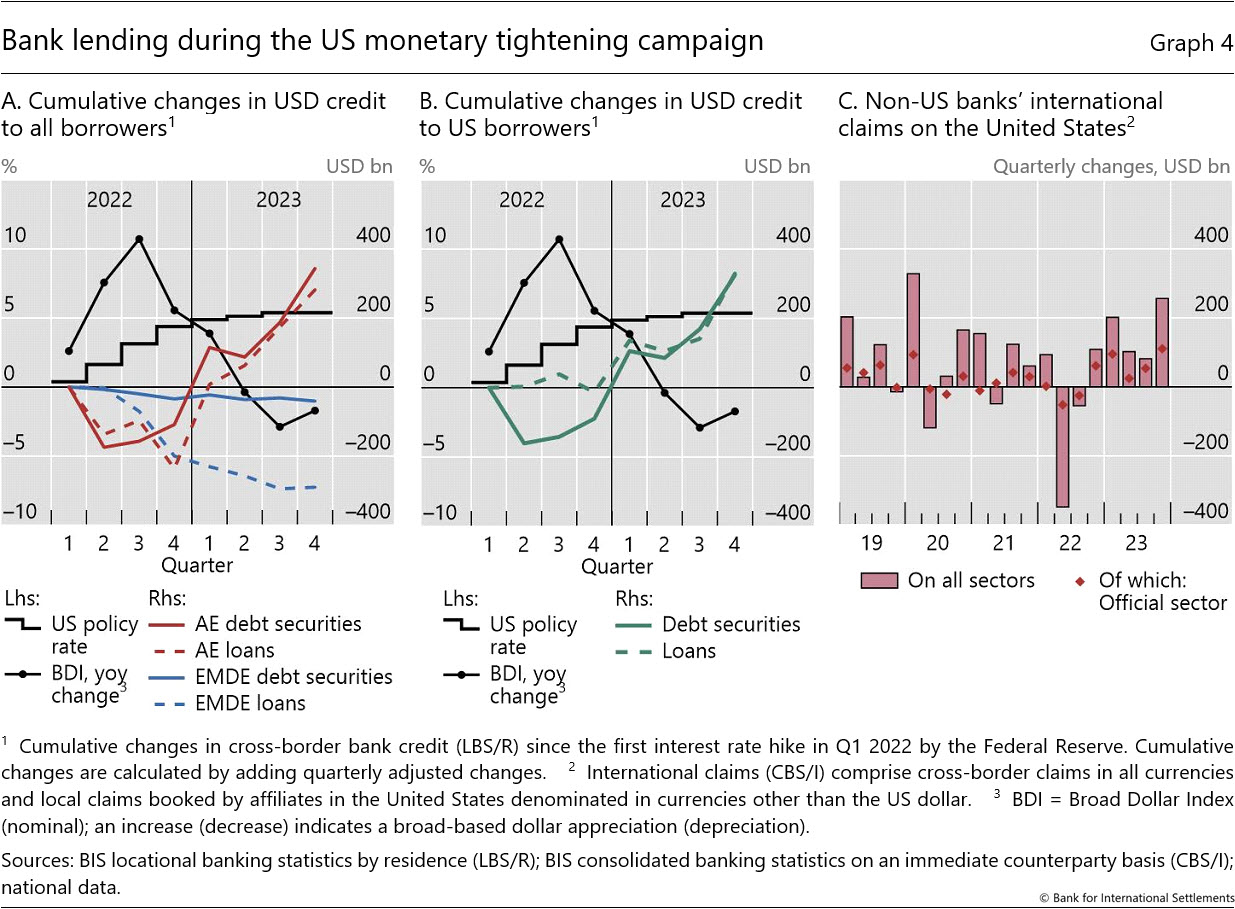
Cross-border bank credit denominated in US dollars recovered in 2023, after having declined during the previous year. The decline in 2022 coincided with a series of rate hikes by the Federal Reserve and a broad-based dollar appreciation (Graph 4.A).2 As the pace of policy tightening slowed in December 2022, the growth in dollar credit to AEs stabilised and returned to positive territory in the course of 2023. At end-2023, outstanding dollar credit to AEs reached $12.1 trillion, nearly $625 billion above Q1 2022 levels (red lines). By contrast, dollar credit to EMDEs remained subdued throughout 2023 (blue lines).
The recovery in cross-border dollar credit to AEs during 2023 reflected higher levels of credit extended to borrowers in the United States (Graph 4.B). Throughout 2022, outstanding cross-border loans barely changed (dashed green line), whereas non-resident banks' reported holdings of dollar-denominated bonds dropped (solid green line).3 In 2023, the rise in cross-border dollar credit was driven by an expansion in both loans and holdings of debt securities; by end-2023, dollar credit to US borrowers had increased by $655 billion since the initial rate hike in Q1 2022. This is reflected in the quarterly changes of banks' consolidated international claims on the United States, which reveal greater claims on the US official sector in 20234 (Graph 4.C).
Cross-border credit flows to EMDEs turn positive
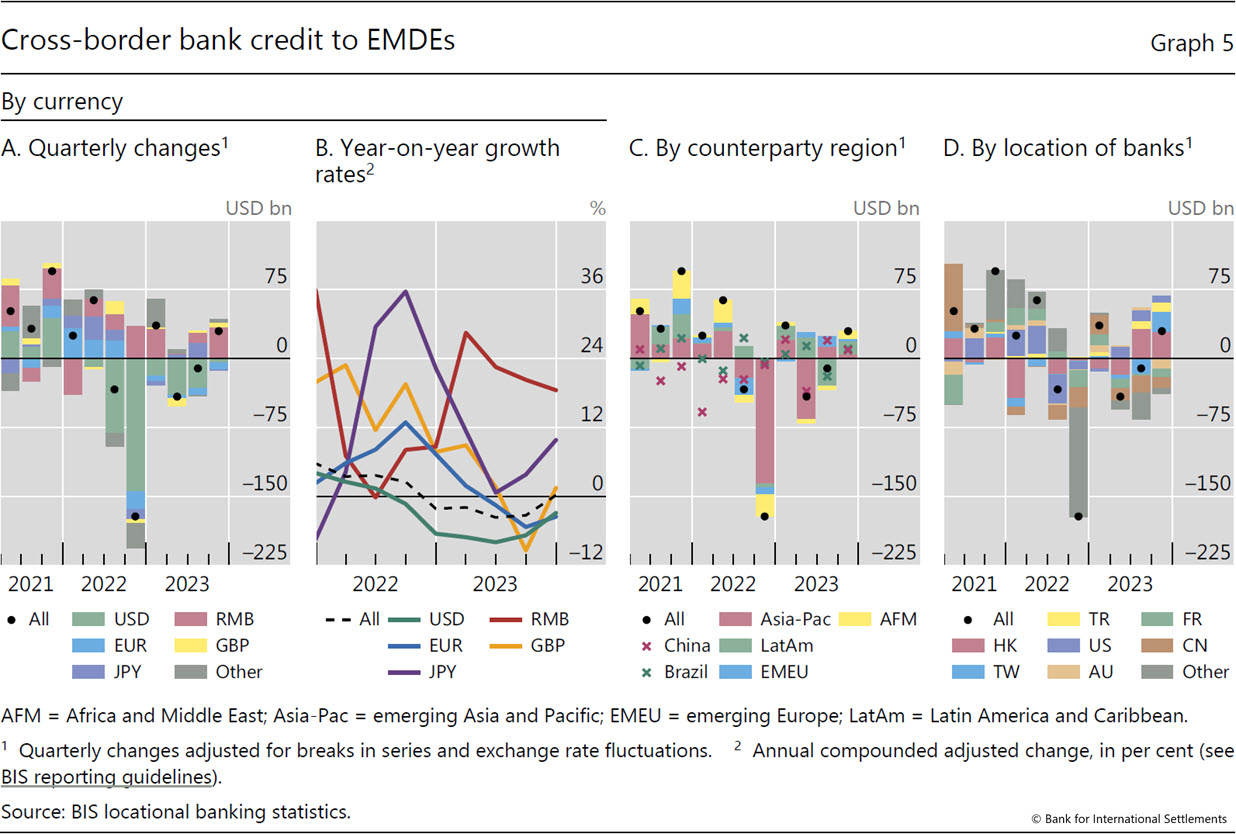
Cross-border bank credit to EMDEs rose by $30 billion in Q4 2023 after two consecutive quarterly declines (Graph 5.A). This pushed the yoy growth rate back into positive territory (Graph 5.B).
Looking across regions, credit to borrowers in Latin America expanded the most (+$15 billion), followed by Africa and the Middle East (Graph 5.C). In Latin America, cross-border credit to Brazil grew by $10 billion, mainly denominated in pound sterling (+$5 billion). Elsewhere in the region, banks channelled funds mainly to Mexico and Peru. In Africa and the Middle East, banks reported greater credit to Saudi Arabia (+$10 billion) and Qatar (+$5 billion). By contrast, credit to borrowers in Israel declined (-$5 billion).
Bank credit to the Asia-Pacific region expanded modestly, by $4 billion (Graph 5.A). Credit denominated in renminbi surged (Graph 5.B), mainly to borrowers in China and Hong Kong SAR (+$29 billion combined). At the same time, dollar-denominated credit to those two economies dropped by $12 billion, and that to Korea dropped by $11 billion.
Global liquidity indicators at end-December 2023
The BIS global liquidity indicators (GLIs) track total credit to non-bank borrowers, covering both loans extended by banks and funding from global bond markets. The latter is captured through the net issuance (gross issuance less redemptions) of international debt securities (IDS). The focus is on foreign currency credit denominated in the three major reserve currencies (US dollars, euros and Japanese yen) to non-residents, ie borrowers outside the respective currency areas.5
Foreign currency credit in US dollars inched down in Q4 2023, while euro- and yen-denominated credit increased. The $87 billion quarterly decline in US dollar-denominated credit to non-banks outside the United States left the outstanding stock just below $13 trillion. Nonetheless, the yoy growth rate turned positive due to base effects (Graph 6.B, red lines). Euro-denominated credit to non-banks outside the euro area increased by €31 billion, which pushed the stock of credit just above €4.1 trillion ($4.6 trillion), or 4% higher than a year earlier (Graph 6.A, blue lines). Following a pause in the previous quarter, yen-denominated credit outside Japan accelerated in Q4 due to a surge in bank loans. The outstanding stock, at ¥64 trillion ($451 billion), was up 16% from a year earlier (Graph 6.B, solid yellow line).
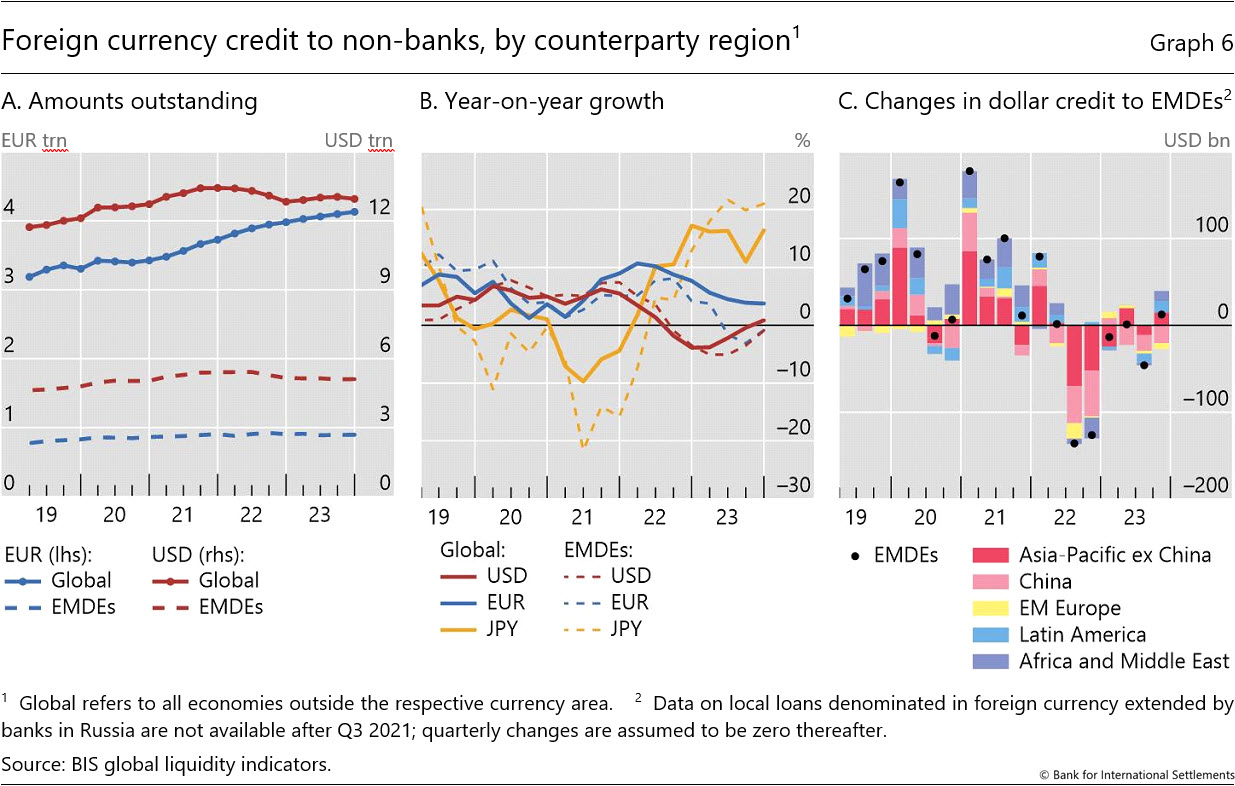
Dollar-denominated foreign currency credit to non-banks in EMDEs showed signs of recovery in Q4 after several quarterly declines since 2022. The $12 billion increase in credit left the amount outstanding at $5.1 trillion (Graph 6.A, dashed red line). Nevertheless, yoy growth remained negative at -0.9% (Graph 6.B, dashed red line). Looking across regions, dollar credit to borrowers in Asia-Pacific excluding China rose the most in Q4 (+$15 billion), followed by credit to those in Latin America (+$13 billion) and Africa and the Middle East (+$12 billion); by contrast, credit to China fell by $20 billion (Graph 6.C).
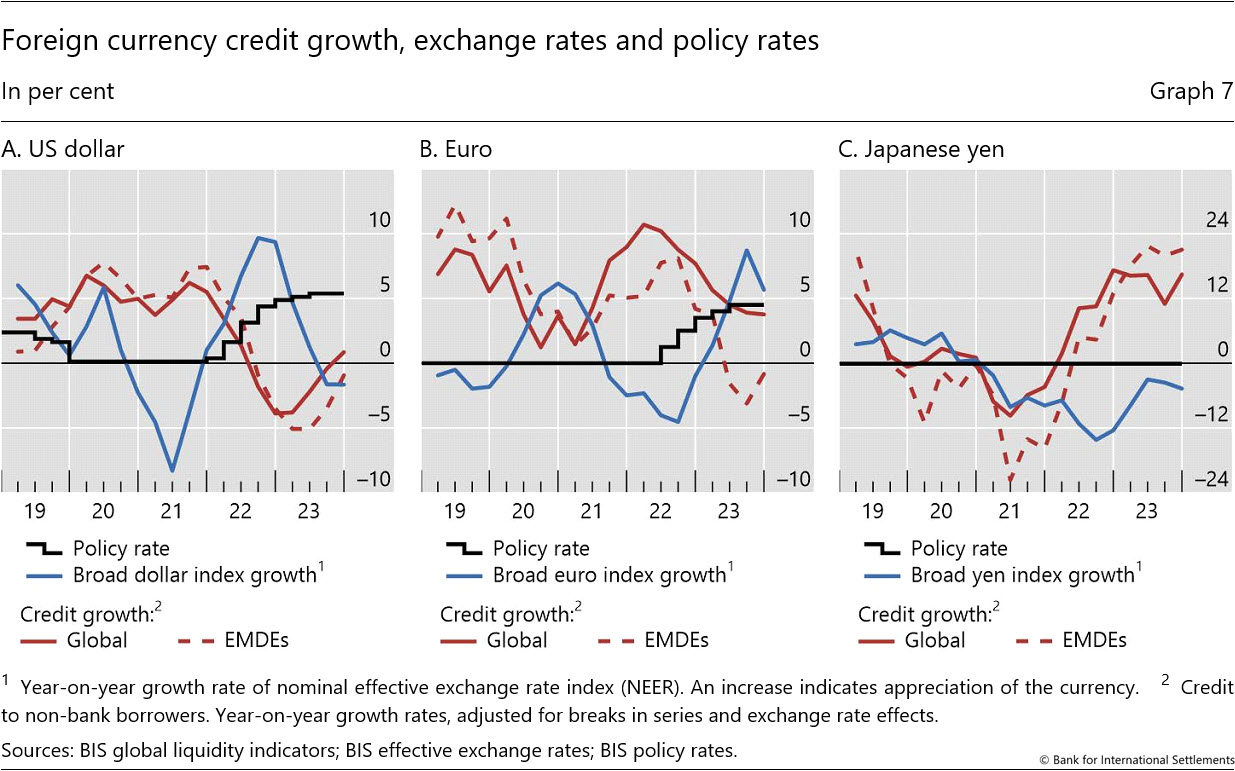
The differences in credit growth across the dollar, euro and yen reflect their respective funding costs and associated exchange rate developments. The negative co-movement between exchange rate indices and credit growth has been salient over the past few years (Graph 7). Monetary policy tightening by the Federal Reserve led to a stronger dollar throughout 2022, weighing on dollar-denominated bank lending and bond issuance. The European Central Bank's policy tightening triggered a similar pattern in euro credit growth from mid-2022 onwards. Moreover, brisk growth in yen credit from early 2022 onwards went hand in hand with sustained yen depreciation as the Bank of Japan kept interest rates below zero.6
The negative co-movement between exchange rates and credit growth was particularly evident for EMDEs. The 0.9% yoy decline in dollar credit to EMDEs at end-Q4 2023 stood in contrast with the 0.9% global increase. The discrepancy was more striking for euro credit. In Q4, euro credit to all borrowers outside the euro area grew by 3.8% yoy, yet euro credit to EMDEs shrank by 0.8% yoy. Finally, yen credit to EMDEs continued to grow at 21% yoy, compared with a global pace of 16% yoy. Nevertheless, as monetary policy tightening slowed in the United States and euro area in 2023, annual growth rates of credit began to converge towards those of the global aggregates.
1 In the BIS LBS, bank claims comprise (i) loans and deposits, (ii) holdings of debt securities, and
(iii) derivatives with a positive market value and other residual instruments (combined). Credit is defined as the sum of (i) and (ii).
2 A similar pattern can be observed for foreign currency credit more broadly (see GLI section below).
3 The drop may have been partly due to lower valuations amid rising yields.
4 In the CBS, the official sector is part of the non-bank sector and includes the US general government as well as the Federal Reserve. In LBS, central banks are included under "banks" instead.
5 For more details, see the GLI methodology: www.bis.org/statistics/gli/gli_methodology.pdf.
6 The Bank of Japan increased its policy rate from -0.1% to between 0% and 0.1% in March 2024. The period under review in this statistical release ends in Q4 2023.