BIS international banking statistics at end-June 2018
- International banking activity was mixed in Q2 2018, slowing vis-à-vis some regions and sectors but continuing to expand vis-à-vis others. Overall, global cross-border bank credit contracted by $130 billion between end-March and end-June 2018, closing at $29 trillion. This left the annual growth rate unchanged at 2% for the third consecutive quarter.
- The fastest growth in cross-border bank credit was again vis-à-vis non-bank financial borrowers, such as investment funds and special purpose vehicles, with an increase of 7% in the year to end-June 2018.
- The annual growth in cross-border bank credit to emerging market and developing economies (EMDEs) slowed from 7% at end-March 2018 to 5% at end-June 2018, largely due to declines in claims on Brazil, India and Mexico.
Growth of cross-border bank credit diverged across countries
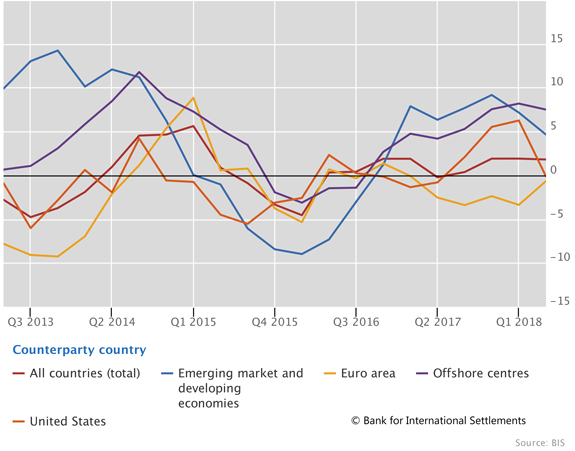
Graph 1: Annual percentage change in banks' cross-border claims (interactive graph).
Source: BIS locational banking statistics (Table A3).
Global cross-border bank credit declined by $130 billion in the second quarter of 2018. Nevertheless, the overall annual growth rate remained unchanged at 2% for the third consecutive quarter (Graph 1, red line).
The overall global figures mask a divergence of international banking activity across borrowing countries in the second quarter of 2018. The annual growth rate of cross-border credit to the United States fell from 6% at end-March 2018 to around 0% at end-June 2018 (Graph 1, orange line) and that of claims on EMDEs slowed to 5%, compared with its most recent peak of 9% at end-2017 (blue line). Meanwhile, the annual growth rate of claims on borrowers in the euro area remained in negative territory, closing at -1% (yellow line). In contrast, claims on Japan and offshore centres (purple line) grew at a rapid annual pace (9% and 8%, respectively).
Credit to non-bank financial borrowers continued to expand rapidly
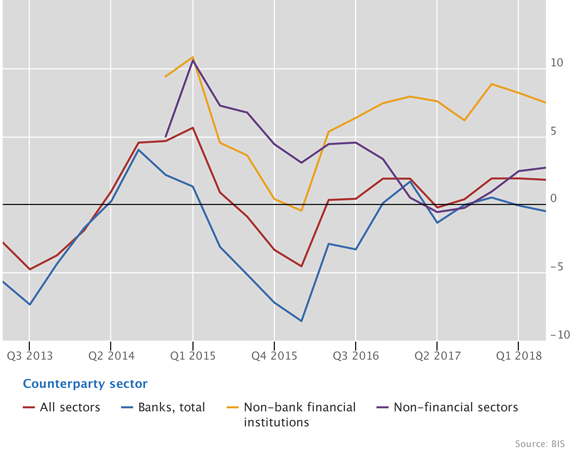
Graph 2: Annual percentage change in banks' cross-border claims (interactive graph).
Source: BIS locational banking statistics (Table A1).
There was also divergence in activity across borrowing sectors. Cross-border lending to banks contracted slightly, down by about 0.5% in the year to end-June 2018 (Graph 2, blue line). Meanwhile, the annual growth rate of cross-border credit to nonfinancial borrowers remained at roughly 3% (purple line). Lending to non-bank financial institutions, such as investment funds and special purpose vehicles, continued to expand rapidly. Cross-border claims on this sector rose by 7%, in line with the average growth rate since mid-2016 (yellow line).
Slowdown in cross-border bank credit to EMDEs
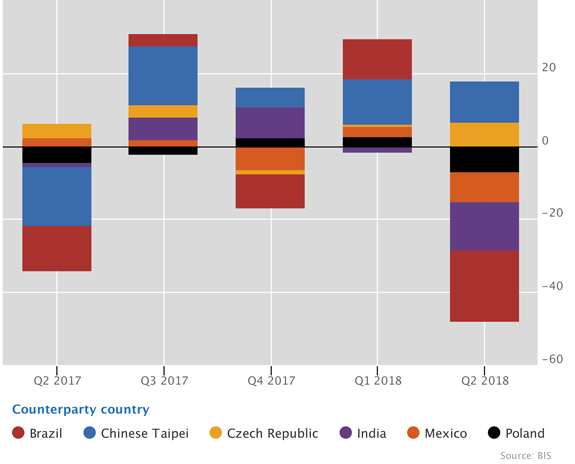
Graph 3: Adjusted changes in banks' cross-border claims on selected EMDEs, USD billions (interactive graph).
Source: BIS locational banking statistics (Table A3).
Cross-border credit to EMDEs contracted by $20 billion in Q2 2018. This was the first quarterly contraction since late 2016, and it saw the annual growth rate slow from 7% at end-March 2018 to below 5% at end-June 2018.
The overall decline in cross-border claims on EMDE borrowers was concentrated in a few borrowing countries. Claims on Brazil declined by $20 billion, which more than reversed the large increase in Q1 2018. Other borrowing countries to experience declines in Q2 2018 included India (-$13 billion), Mexico (-$8 billion), Poland (-$7 billion) and Turkey (-$1 billion). In contrast, cross-border bank credit increased to Chinese Taipei (+$11 billion), the Czech Republic (+$7 billion) and Argentina (+$1 billion).
Exposures to EMDEs vary significantly across foreign banking systems
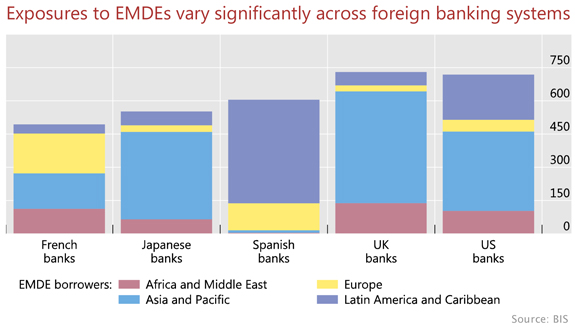
Graph 4: Outstanding consolidated claims on borrowers in EMDEs, by nationality of reporting bank (interactive data). For a list of countries in each EMDE region, see Table A3.
Source: BIS consolidated banking statistics on an ultimate risk basis (Table B4).
Foreign banks' outstanding claims on EMDEs totalled $4.9 trillion at end-June 2018 on a consolidated, ultimate risk basis (which takes into account credit risk transfers). Of this amount, the largest share comprised the local claims of banks' foreign subsidiaries located in EMDEs ($2.8 trillion); the remainder was cross-border claims ($2.1 trillion). On top of these two main types of claim, foreign banks had exposures to EMDEs through three additional items: derivatives contracts, the positive market value of which stood at $122 billion at end-June 2018; credit protection sold against entities in EMDEs and other guarantees extended ($634 billion); and outstanding credit commitments to resident borrowers ($582 billion). At end-June 2018, UK banks had the largest claims on EMDE borrowers at $730 billion (Graph 4). US banks had claims of $718 billion, followed by Spanish banks ($605 billion), Japanese banks ($552 billion) and French banks ($494 billion).
There was considerable heterogeneity in the composition of foreign banks' exposures to EMDEs. Some national banking systems' claims were concentrated in one region (eg UK banks vis-à-vis emerging Asia), while other national banking systems' claims were more dispersed across EMDE regions (eg claims of French banks).
The business models that banks employ when lending to EMDEs are also not uniform. Some banks conduct their international business largely on a cross-border basis out of their home country or in financial centres, such as Japanese banks. Others follow a multinational model and set up foreign subsidiaries, such as Spanish banks. Such differences in business models are relevant to understanding how banks might respond to adverse developments in a borrowing country.
As usual, the latest statistics are subject to revision and are affected by breaks in series - or changes in compilation - over time. Publication dates for revisions and updates are announced in the release calendar.