BIS international banking statistics at end-September 2017
- Cross-border claims rose by $155 billion between end-June and end-September 2017 to $28.9 trillion, reversing the decline in the previous quarter. Lending to non-bank borrowers continued to expand, whereas interbank activity remained subdued.
- Lending to emerging market economies (EMEs) rose for the third consecutive quarter, up by $66 billion between end-June and end-September 2017.
- The Philippines joined the reporting population for the locational banking statistics (LBS), bringing the number of countries reporting these data to 47.
Cross-border credit to non-bank borrowers continues to expand
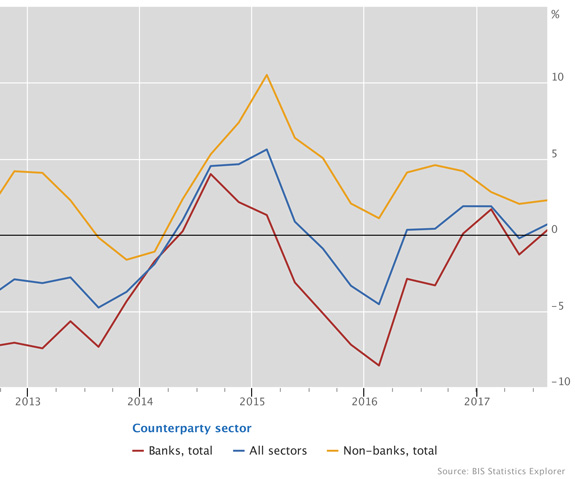
Graph 1: Annual percentage change in banks' cross-border claims (interactive graph).
Source: BIS locational banking statistics (Table A1).
Cross-border claims rose by $155 billion between end-June and end-September 2017 to $28.9 trillion. This reversed the decline in the previous quarter and boosted the annual growth rate from zero to about 1% (Graph 1). Credit to advanced economies again contracted, by 1% at end-September 2017, whereas credit to offshore centres and EMEs rose further, by 5% and 8%, respectively. Banks reported declines in their cross-border claims on the United Kingdom (-$62 billion) and Germany (-$39 billion). By contrast, their cross-border claims increased on Japan (+$112 billion) and the United States (+$75 billion).
The overall increase in Q3 2017 was underpinned by the continued expansion in lending to non-bank borrowers, which grew at an annual pace of about 2%. This was similar to the growth rate observed in the first half of 2017. A further split of the claims on the non-bank sector reveals that, in Q3 2017, credit rose to both non-bank financial institutions (+$107 billion) and the non-financial sector (+$87 billion).
In contrast to lending to non-bank borrowers, interbank activity remained subdued. In Q3 2017, cross-border credit to banks fell by $41 billion. Diverging trends in lending to banks and non-banks have been the dominant pattern in the international banking market since 2011 (Graph 1).
Sustained contraction in derivatives positions since 2015
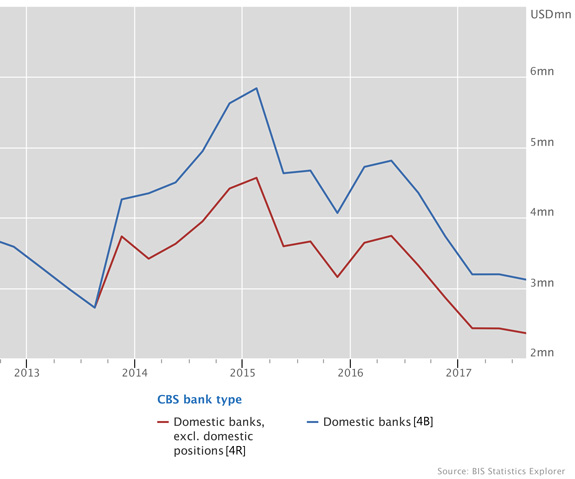
Graph 2: Outstanding consolidated derivatives claims on all counterparties (blue line) and foreign counterparties, excluding claims on residents of banks' home country (red line) (interactive graph).
Source: BIS consolidated banking statistics on an ultimate risk basis (Table B3).
The instrument composition of cross-border claims shows that bank loans rose by $182 billion in Q3 2017, taking their annual growth rate to 3%. Banks' holdings of debt securities were up by $13 billion. However, overall cross-border activity was depressed by a decline in other instruments, which include equities and derivatives. Such other instruments contracted by $46 billion.
The BIS consolidated banking statistics show the derivatives positions of the largest banking systems to have declined substantially since 2015. Banks' consolidated derivatives claims - that is, the sum of the derivatives contracts between reporting banks and counterparties that have a positive market value - fell from $5.8 trillion at end-March 2015 to $3.1 trillion at end September 2017 (Graph 2, blue line). Most of the decline was against foreign counterparties residing outside the home country of the reporting bank (Graph 2, red line). This decline mirrors the fall in market values reported by dealers contributing to the BIS OTC derivatives statistics. The latter statistics indicate that, as of end-June 2017, the gross market value of outstanding OTC derivatives contracts had dropped to its lowest level since 2007, owing to falling notional amounts and changes in market interest rates.
Cross-border lending to EMEs continues to increase
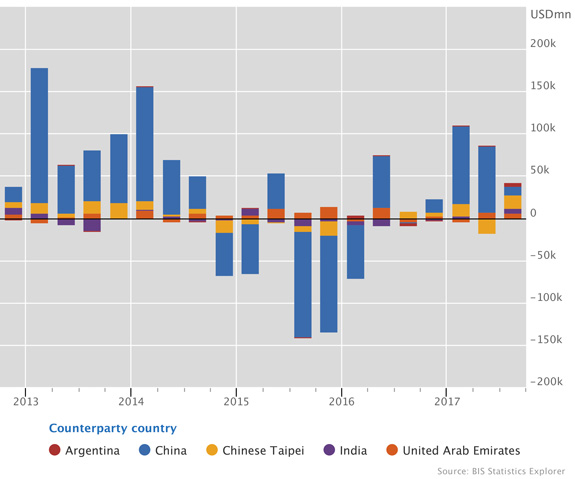
Graph 3: Adjusted changes in banks' cross-border claims (interactive graph).
Source: BIS locational banking statistics (Table A3).
Cross-border claims on EMEs continued to trend upwards in Q3 2017. They expanded for the third consecutive quarter, up by $66 billion. The increase was more broadly based than in previous quarters, when it had been driven mainly by lending to China. Claims on China rose again, up by a modest $10 billion in Q3 2017. Several other EMEs also experienced notable increases, including Chinese Taipei (+$16 billion), India (+$6 billion), the United Arab Emirates (+$6 billion) and Argentina (+$5 billion).
The Philippines starts reporting locational banking statistics
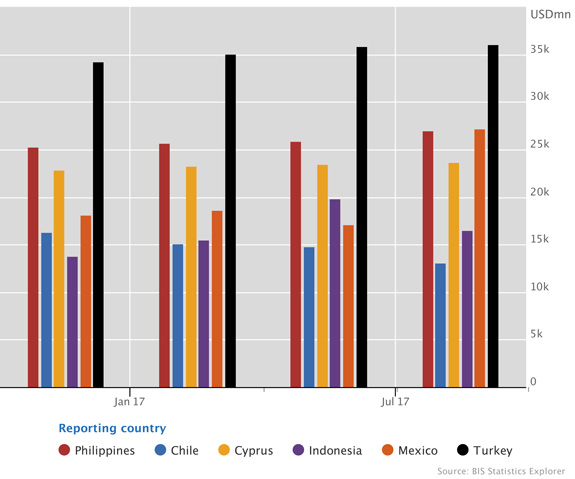
Graph 4: Outstanding cross-border claims of banks in selected LBS-reporting countries (interactive graph).
Source: BIS locational banking statistics (Table A2).
The Philippines joined the population of reporting countries for the locational banking statistics, bringing to 47 the number of jurisdictions reporting these data. At end-September 2017, banks in the Philippines had outstanding cross-border claims of $27 billion and liabilities of $18 billion. The cross-border claims of banks in the Philippines are larger than those of banks located in Chile and Indonesia but smaller than in the case of Turkey (Graph 4).
The largest cross-border claims of banks in the Philippines were on the United States ($8 billion) and neighbouring Asian economies such as Indonesia ($3 billion) and Japan ($3 billion). Banks in the Philippines are net suppliers of US dollar (on-balance sheet) funding in the international banking market. This is because they invest a portion of their local US dollar liabilities abroad. Close to 20% of their local liabilities to Philippine residents are denominated in US dollars.