Foreign exchange turnover in April 2019
Triennial Central Bank Survey
1. BIS Triennial Central Bank Survey
The BIS Triennial Central Bank Survey is the most comprehensive source of information on the size and structure of global foreign exchange (FX) and over-the-counter (OTC) derivatives markets. The Triennial Survey aims to increase the transparency of OTC markets and to help central banks, other authorities and market participants monitor developments in global financial markets. It also helps to inform discussions on reforms to OTC markets.
FX market activity has been surveyed every three years since 1986, and OTC interest rate derivatives market activity since 1995. The Triennial Survey is coordinated by the BIS under the auspices of the Markets Committee (for the FX part) and the Committee on the Global Financial System (for the interest rate derivatives part). It is supported through the Data Gaps Initiative endorsed by the G20.
This statistical release concerns the FX turnover part of the 2019 Triennial Survey, which took place in April and involved central banks and other authorities in 53 jurisdictions (see page 15). They collected data from close to 1,300 banks and other dealers in their jurisdictions and reported national aggregates to the BIS, which then calculated global aggregates. Turnover data are reported by the sales desks of reporting dealers, regardless of where a trade is booked, and are reported on an unconsolidated basis, ie including trades between related entities that are part of the same group.
Data are subject to revision. The final data, as well as several special features that analyse the data, will be released with the BIS Quarterly Review in December 2019.
Highlights
Highlights from the 2019 Triennial Survey of turnover in OTC FX markets:
- Trading in FX markets reached $6.6 trillion per day in April 2019, up from $5.1 trillion three years earlier.1 Growth of FX derivatives trading, especially in FX swaps, outpaced that of spot trading.
- The US dollar retained its dominant currency status, being on one side of 88% of all trades. The share of trades with the euro on one side expanded somewhat, to 32%. By contrast, the share of trades involving the Japanese yen fell some 5 percentage points, although the yen remained the third most actively traded currency (on one side of 17% of all trades).
- As in previous surveys, currencies of emerging market economies (EMEs) again gained market share, reaching 25% of overall global turnover. Turnover in the renminbi, however, grew only slightly faster than the aggregate market, and the renminbi did not climb further in the global rankings. It remained the eighth most traded currency, with a share of 4.3%, ranking just after the Swiss franc.
- While the volume of spot trades increased relative to April 2016, the expansion was less strong compared with other instruments - hence the share of spot trades continued to fall, to 30% in 2019, compared with 33% in 2016. By contrast, FX swaps continued to gain in market share, accounting for 49% of total FX market turnover in April 2019. Trading of outright forwards also picked up, with a large part of the rise due to the segment of non-deliverable forwards (NDFs).
- FX trading with "other financial institutions", ie those other than reporting dealers, again exceeded inter-dealer trading volumes, reaching $3.6 trillion in April 2019, or 55% of global turnover. This was due to a higher share of trading with non-reporting banks as well as with hedge funds and proprietary trading firms (PTFs), while trading with institutional investors declined.
- In April 2019, sales desks in five countries - the United Kingdom, the United States, Hong Kong SAR, Singapore and Japan - facilitated 79% of all foreign exchange trading. Trading activity in the United Kingdom and Hong Kong SAR grew by more than the global average. Mainland China also recorded a significant rise in trading activity, making it the eighth largest FX trading centre (up from 13th in April 2016).
2. Turnover in foreign exchange markets
Turnover by currencies and currency pairs
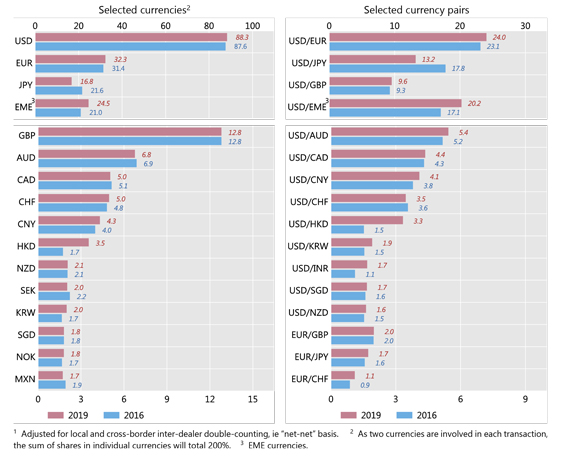
The US dollar remained the world's dominant vehicle currency. It was on one side of 88% of all trades in April 2019 (Graph 1, left-hand panel). The relative ranking of the next seven most liquid currencies did not change from 2016. The global share of EME currencies rose by about 4 percentage points to 25% of total FX turnover in April 2019, continuing the trend observed in previous surveys.
Turnover in the euro, the world's second most traded currency, increased at a somewhat higher rate than did the aggregate market, and its share in global trading edged up to 32% (Table 2). This reflected higher than market average growth in EUR/JPY and EUR/CHF trading.
In contrast, JPY turnover stagnated, and the yen's share in global turnover dropped by 5 percentage points, to 17%. Despite this decline, the yen remained the third most traded currency globally. The fall in JPY turnover was mostly due to a contraction in the important JPY/USD cross amid low volatility. By contrast, trading in other popular JPY crosses, such as EUR/JPY and AUD/JPY, increased over the three-year period. In addition, trading in yen against several high-yielding EME currencies that are attractive for Japanese retail margin traders, albeit small relative to total JPY turnover, grew faster than the global average. Specifically, the combined average daily turnover in JPY/TRY, JPY/ZAR, and JPY/BRL close to doubled, from $7 billion in 2016 to $12 billion in 2019 (Table 3).
The market shares for other heavily traded advanced economy currencies in April 2019 were unchanged from their 2016 values, with the GBP at 13%, the AUD at 7%, the CAD at 5% and the CHF at 5% of global FX turnover.
Renminbi trading increased in line with aggregate market growth, so the Chinese currency did not climb in the global rankings, unlike in past surveys. With $284 billion in turnover (Table 5), the renminbi remained the world's eighth most traded currency and the most traded EME currency. The US dollar was on the other side of 95% of all renminbi transactions (Table 3).
In contrast, several other Asia-Pacific currencies gained market share. Turnover in the Hong Kong dollar more than doubled relative to 2016, and the currency climbed to ninth place in the global ranking (up from 13th in 2016). The Korean won, Indian rupee and Indonesian rupiah also moved higher in the global rankings. Turning to the currencies of other EME regions, the Mexican peso and the Turkish lira were among the currencies which dropped several places in global rankings.
Graph 1: Foreign exchange market turnover by currency and currency pairs1
Net-net basis, daily averages in April, in per cent
Source: BIS Triennial Central Bank Survey. For additional data by currency and currency pairs, see Table 2 and Table 3 on pages 10 and 11, respectively. See our Statistics Explorer for access to the full set of published data.
Turnover by instrument and maturity
Turnover in FX spot markets rose in the 2019 survey, but declined as a share in global FX activity. At $2.0 trillion per day, the volume of spot trades in April 2019 was some 20% greater than in April 2016, but still below the level recorded in the April 2013 Triennial Survey (Table 1). Spot turnover accounted for 30% of global turnover in April 2019, down from 33% in 2016 and 38% in 2013 (Graph 2).
By contrast, trading in FX swaps and outright forwards gained in market share. Turnover in FX swaps, the most heavily traded instrument, which is primarily used by market participants for the management of funding liquidity and hedging of currency risk, rose by more than a third to $3.2 trillion per day and accounted for almost half of global FX trading. The US dollar was on one side of 91% of all FX swap transactions (ie somewhat higher than its share across all instruments), while the euro was on one side of more than a third of FX swap transactions. The bulk of turnover in FX swaps was in short-maturity instruments (overnight up to seven days) in April 2019, although trading in longer tenors expanded over the past three years (Table 4).
Trading in outright forwards rose by a notable 43% to $999 billion per day. Trading in medium-term tenors for outright forwards is more common than for FX swaps, and 61% of the turnover in outright forwards was in maturities of over seven days and up to three months (Table 4). The US dollar was on one side of 88% of outright forwards transactions (Table 5). Within the various instrument categories within outright forwards, NDFs accounted for a significant share of the increase in trading between 2016 and 2019, reflecting in particular the strong activity in Korean won, Indian rupee and Brazilian real NDF markets.
Trading in OTC FX options grew at a slower pace than did overall FX turnover, with a rise of 16%, to $294 billion per day in April 2019 (representing 4% of total FX turnover; Graph 2). Trading volumes in currency swaps increased by almost a third between 2016 and 2019, to $108 billion per day. The typically long maturity of currency swaps means their average daily turnover is naturally lower than that for other instruments.
Graph 2: Foreign exchange market turnover by instrument1
Net-net basis, daily averages in April
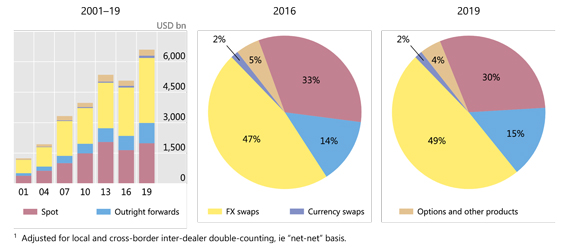
Source: BIS Triennial Central Bank Survey. For additional data by instrument, see Table 1 on page 9.
Turnover by counterparty
Trading in the inter-dealer market did not keep pace with overall market growth, and thus inter-dealer trades dipped below 40% of total FX market turnover in April 2019 (Graph 3). Inter-dealer spot turnover actually declined slightly in absolute terms relative to 2016, whereas inter-dealer turnover in FX swaps, outright forwards and currency swaps expanded noticeably (Table 4).
Reporting dealers' trading with "other financial institutions" - a category that includes non-reporting banks, hedge funds and PTFs, institutional investors, and official sector financial institutions - grew notably from 2016, to $3.6 trillion per day in April 2019, or 55% of global trading volume (Graph 3, centre panel). Non-reporting banks - typically smaller, regional banks that serve as clients of the large FX dealer banks but do not engage in FX market-making - remained the largest counterparty category within other financial institutions (Graph 3, right-hand panel): they accounted for $1.6 trillion (Table 5), or 24%, of total FX market turnover. Trading with hedge funds and PTFs also increased, to $593 billion (9% of total turnover). Prime-brokered turnover rose to $1.5 trillion in April 2019, a 68% increase compared with the 2016 survey (Table 5), in line with the above-mentioned rise in activity conducted by the typical prime brokerage clients, such as smaller banks, hedge funds and PTFs. By contrast, trading with institutional investors declined in both absolute and relative terms, with their share in global FX turnover falling to 12% in April 2019 (from 16% in the previous survey). The relative importance of trading with non-financial customers also fell slightly, to 7% of total FX market turnover.
Changes in the composition of counterparties went alongside shifts in the mix of traded FX instruments. For instance, the increase in trading with non-reporting banks reflected primarily their stronger activity in FX swaps, which amounted to $966 billion in April 2019 (Table 5), a notable increase of more than two thirds compared with April 2016. Trading in currency swaps with non-reporting banks increased by 20%. The rise in trading with hedge funds and PTFs was mainly attributable to greater activity in outright forwards, but their trading in other instruments also increased.
Graph 3: Foreign exchange market turnover by counterparty1
Net-net basis, daily averages in April
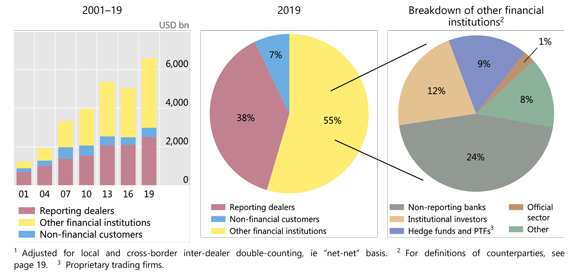
Source: BIS Triennial Central Bank Survey. For additional data by counterparty, see Table 4 and Table 5 on pages 12 and 13, respectively.
Geographical distribution of turnover
FX trading continues to be concentrated in the largest financial centres. In April 2019, sales desks in five locations - the United Kingdom, the United States, Singapore, Hong Kong SAR, and Japan - intermediated 79% of all foreign exchange trading (Table 6). While the ranking of these trading hubs remained unchanged from 2016, there were changes in their relative shares in global turnover. The share of trading taking place in the United States declined to 17% in 2019, from 20% in 2016. In contrast, the share of FX trading in the United Kingdom rose by 6 percentage points to 43% of global FX activity in April 2019.
The share of FX trading in the leading Asian financial centres, namely Hong Kong SAR, Singapore, and Tokyo, declined slightly to 20% in April 2019. This was mainly driven by relatively slower growth of activity in Singapore and Tokyo. Turnover in Hong Kong SAR grew at a higher rate than the global aggregate, raising its share in global turnover by one percentage point.
Several other FX trading centres also gained in prominence. In particular, mainland China recorded a significant rise in trading activity, to $136 billion in 2019, or an 87% increase since 2016. Mainland China thus climbed several places in the global ranking to become the eighth largest FX trading centre (up from 13th place three years previously).
The share of cross-border trading in total FX turnover dropped significantly, to just 56% in 2019, down from 65% in 2016 - the lowest level observed since 2001. Among reporting dealers, the bulk (68%) of the $2.5 trillion per day in inter-dealer trading remained cross-border (Table 5).
1 Growth in FX turnover between April 2016 and 2019 was similar to the growth that can be derived from more frequent regional surveys run by local foreign exchange committees (FXCs). These semiannual surveys by FXCs in Australia, Canada, Hong Kong SAR, London, New York, Singapore and Tokyo focus on the structure of local FX markets, and there are some methodological differences compared with the Triennial Survey. In particular, the Triennial Survey collects data based on the location of the sales desk, whereas some regional surveys are based on the location of the trading desk.