Statistical release: BIS international banking statistics and global liquidity indicators at end-June 2025

Key takeaways
- Global cross-border bank credit expanded by $917 billion in the second quarter of 2025, reaching $37 trillion.
- The increase was driven by lending to financial sector borrowers ($773 billion), mainly lending to banks ($540 billion).
- Cross-border bank credit to the United States grew by $112 billion against a backdrop of tariff developments and a depreciating dollar.
- The BIS global liquidity indicators show that foreign currency credit in dollars, euros and yen grew by 6%, 13% and 0% year-on-year at end-Q2 2025, respectively.
- Malaysia joins the BIS consolidated banking statistics reporting list of countries. Malaysian banks operate in at least eight foreign countries, with foreign claims just under $200 billion.
Cross-border bank credit continues to expand
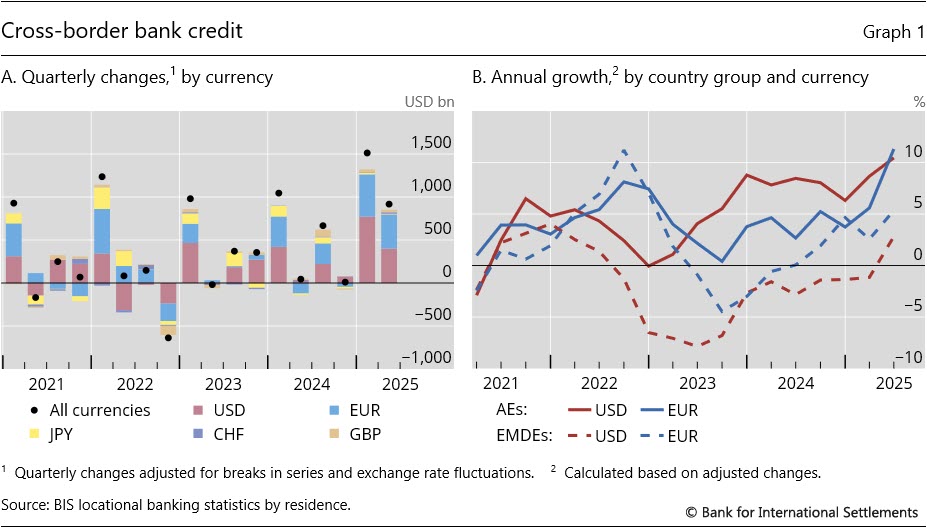
The BIS locational banking statistics (LBS) reveal that global cross-border bank credit1 expanded by $917 billion on an exchange rate- and break-adjusted basis in Q2 2025, reaching $37 trillion (Graph 1.A). This was driven roughly in equal measure by dollar- and euro-denominated credit. This increase pushed the growth rate in cross-border bank credit up to 10% year on year (yoy). The fastest growth was in credit to counterparties in advanced economies (AEs), for which growth in euro-denominated credit rose from 6% yoy in Q1 2025 up to 11% in Q2 2025, just eclipsing dollar-denominated credit, which grew at 10% (Graph 1.B). Cross-border credit growth to emerging market and developing economies (EMDEs) also saw solid growth, with euro credit growing at 5% yoy and dollar credit rising to 3% from –1% in Q1 2025.
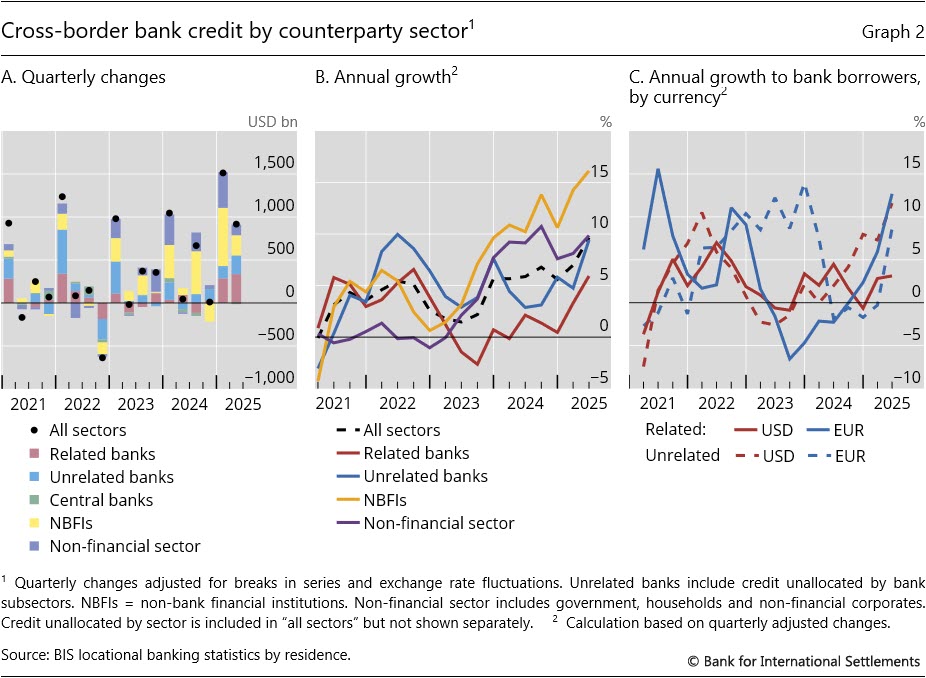
Most of the Q2 2025 increase in cross-border bank credit was driven by lending to counterparties in the financial sector (+$773 billion), especially banks (+$540 billion). Credit to related banks accounted for $335 billion, while that to unrelated banks grew by $218 billion. Credit to non-bank financial institutions (NBFIs), in turn, saw a $233 billion expansion (Graph 2.A). The Q2 2025 increase boosted the yoy growth rate of bank credit to each of these sectors, following an even larger Q1 increase. The yoy growth in credit to NBFIs rose from 11% in Q4 2024 to 16% in Q2 2025, while that to unrelated banks rose from 6% up to 9% in the same interval (Graph 2.B). The rise in the growth rate of credit to bank counterparties was led by faster dollar-denominated lending to unrelated banks, as well as a quicker pace of euro-denominated lending to both related and unrelated banks (Graph 2.C).
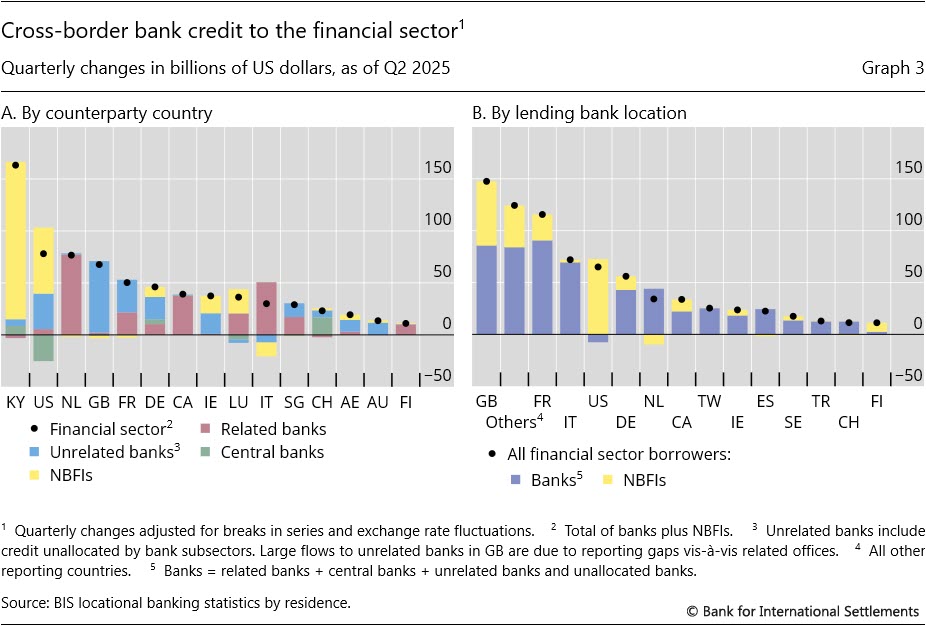
Cross-border bank credit to the financial sector was concentrated among borrowers in a few locations. Borrowers in the Cayman Islands, the United States, the Netherlands and the United Kingdom accounted for $386 billion of the $773 billion rise in cross-border credit to this sector (Graph 3.A). NBFIs accounted for the lion s share for the Cayman Islands and the United States, whereas banks were the dominant counterparty in most other jurisdictions. The expansion of cross-border bank credit to the financial sector was led by banks located in the United Kingdom (+$148 billion) and France (+$116 billion; Graph 3.B). Banks in the United States and the United Kingdom provided the bulk of cross-border bank credit to NBFI counterparties.
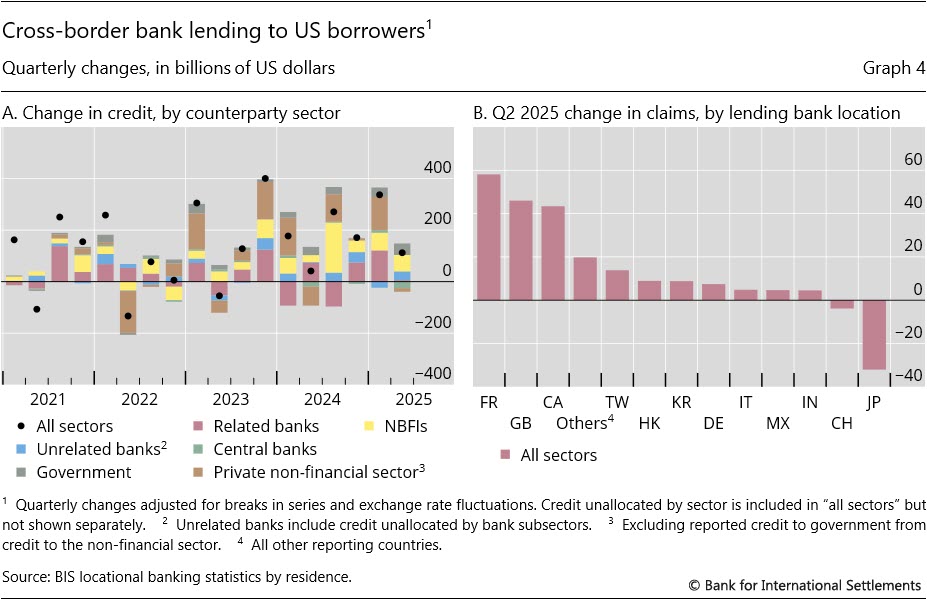
Cross-border bank credit to borrowers in the United States increased in Q2 2025 against a backdrop of tariff developments and a depreciating dollar. Most of the $112 billion expansion was due to lending to US-domiciled NBFIs (Graph 4.A). Lending to the US government rose by $44 billion, whereas bank credit to other non-financial sector borrowers declined by $14 billion.2 Most of the increase in bank claims3 on borrowers in the United States (all sectors) was due to banks in three locations: France, the United Kingdom and Canada (Graph 4.B). Claims of banks in Japan on borrowers in the United States declined, driven by non-financial borrowers, reflecting a general seasonal pattern for claims of banks in Japan.4
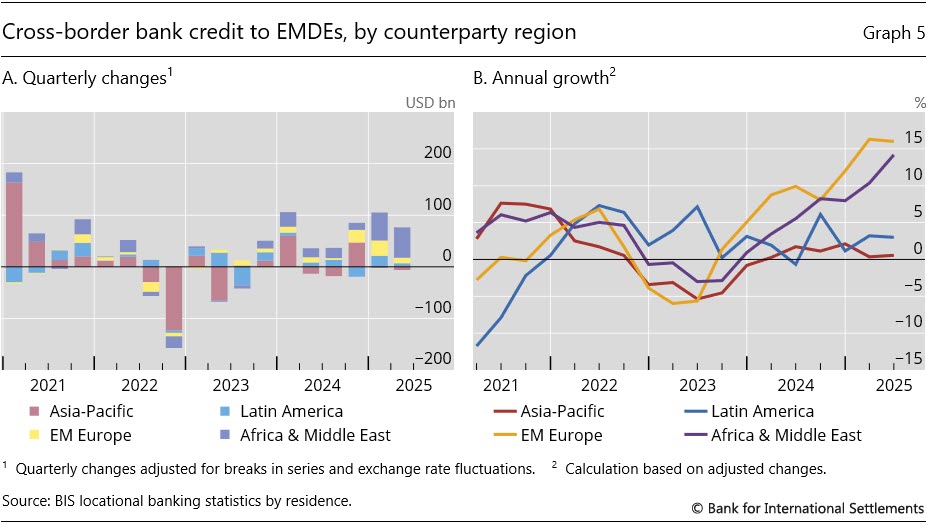
Bank credit to EMDEs expanded by $70 billion in Q2 2025. The increase was driven almost entirely by lending to borrowers in Africa and the Middle East (AFME), with the United Arab Emirates (+$28 billion) and Saudi Arabia (+$10 billion) seeing the largest expansions (Graph 5.A). Bank credit to emerging Asia-Pacific contracted by $6 billion, mainly as a result of a decline in credit to borrowers in China (– $36 billion). Year-on-year credit growth followed similar patterns (+14% for borrowers in AFME and +1% for those in emerging Asia-Pacific; Graph 5.B). Finally, bank credit to emerging Europe expanded for a ninth consecutive quarter, keeping the yoy growth rate elevated at 16% at end-Q2 2025.
Global liquidity indicators at end-June 2025
The BIS global liquidity indicators (GLIs) track total credit to non-bank borrowers, covering both loans extended by banks and funding from international bond markets.5 The latter is captured through the net issuance (gross issuance less redemptions) of international debt securities (IDS). The focus is on foreign currency credit denominated in the three major reserve currencies (US dollar, euro and Japanese yen) to non-residents, ie borrowers outside the respective currency areas.
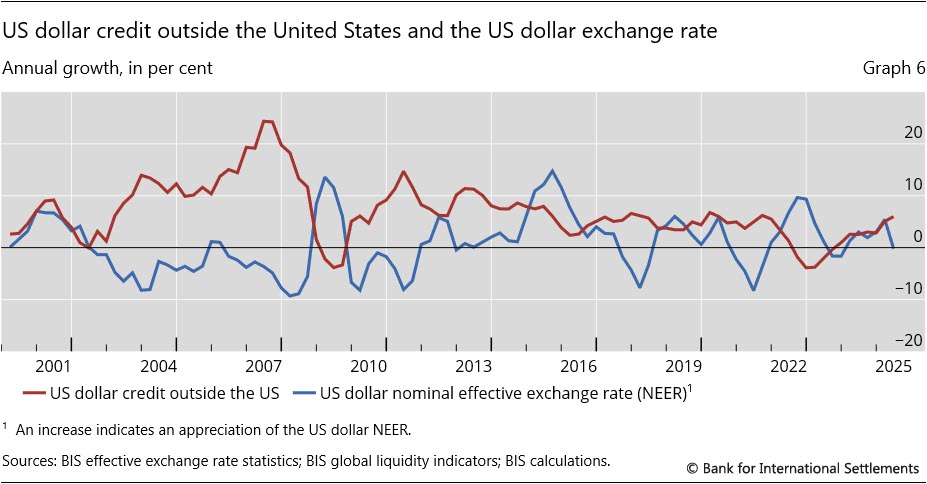
Dollar credit growth to non-bank borrowers outside the United States accelerated to 6% yoy in Q2 2025 from 3% in Q4 2024 (Graph 6, red line). This came on the back of a steady depreciation of the US dollar (blue line) through the first half of 2025 and expectations of a faster pace of monetary policy easing in the United States.
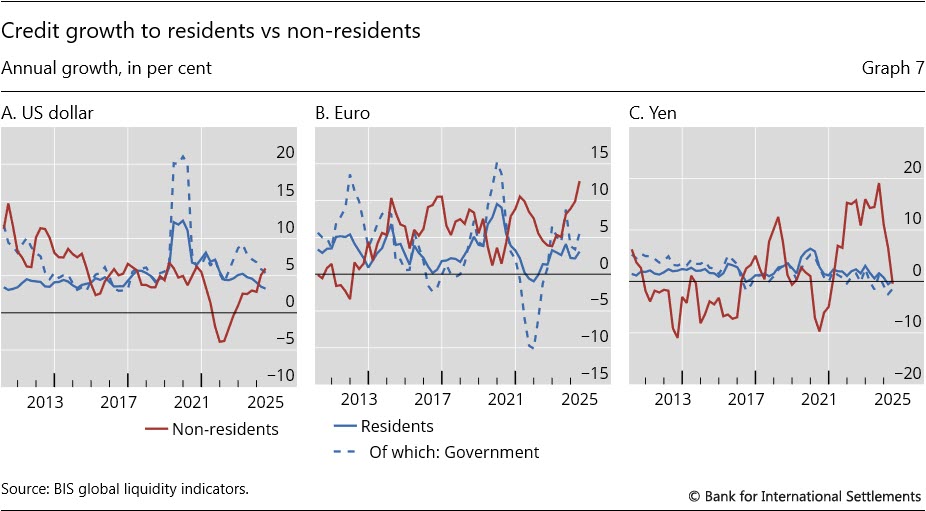
A useful comparison for foreign currency credit to non-banks outside the currency area is credit to non-financial sector borrowers located within the currency area, also available from the BIS GLIs. From Q2 2020 to Q4 2024, dollar credit growth to US residents outpaced that to non-residents (Graph 7.A). Starting in Q1 2025, this trend reversed, and residents saw a 3% yoy growth rate compared to 6% for non-residents as of end-Q2 2025. Meanwhile, dollar credit growth to the US government declined from 9% yoy at end-Q1 2024 to 5% at end-Q2 2025.
Euro-denominated credit similarly saw faster growth for non-resident borrowers compared to borrowers in the euro area. Growth outside the euro area expanded rapidly, reaching 13% yoy at end-Q2 2025 (Graph 7.B). Credit growth to residents stood at a lower 3%, led by stronger credit growth to the public sector (+6%).
Yen credit growth to borrowers both in and outside of Japan stalled. For non-residents, the 0% yoy growth in Q2 2025 followed several years of rapid growth over 10% yoy (Graph 7.C). Growth in credit to residents also stood around 0% yoy amid contracting credit to the public sector.
Malaysia reports to the consolidated banking statistics
Malaysia joined the BIS consolidated banking statistics (CBS) collection, with data made available with this statistical release. This is the first new CBS reporting country since Korea joined in Q3 2012 (with data from Q4 2011). Data for Malaysian banks extend back to Q1 2024. The addition of Malaysia brings the number of countries contributing to the CBS on an immediate borrower basis up to 32 and on a guarantor basis up to 27.
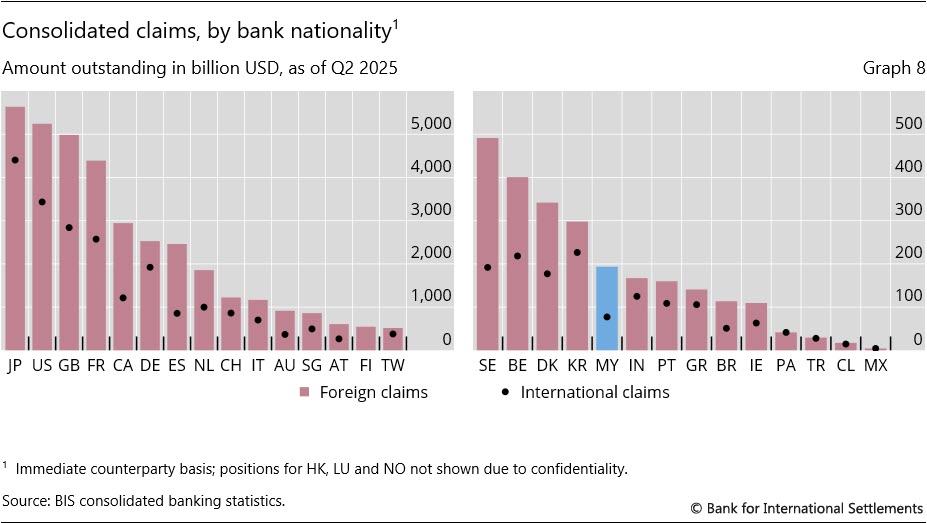
Malaysian banks foreign claims – ie claims on counterparties outside Malaysia, including those extended by affiliates of Malaysian banks located abroad – stood at $193 billion as of Q2 2025, above those of Indian banks ($167 billion) and Portuguese banks ($160 billion; Graph 8). Their international claims – a subset of foreign claims comprising cross-border claims and local claims denominated in currencies foreign to the borrower – stood at $77 billion. Malaysian banks operate in at least eight other countries; in turn, Malaysia hosts foreign banks from more than ten countries.6
1 In the BIS LBS, bank credit comprises: (i) loans and deposits; and (ii) holdings of debt securities. Bank claims further include: (iii) derivatives with a positive market value and other residual instruments (combined), which expanded by $271 billion in Q2 2025, primarily driven by banks in Canada, France and Ireland.
2 This decline is concentrated in positions unallocated by non-financial subsector.
3 For confidentiality reasons, total claims on all sectors are shown instead of credit to specific sectors.
4 The decline of cross-border claims by banks in Japan in Q2 2025 follows an increase during the previous quarter. This pattern, which straddles the (end-March) fiscal year-end in Japan and often features an outsize increase in Q1, has been evident for several years.
5 The GLIs cover total foreign currency credit denominated in US dollars, euros or Japanese yen, which includes loans from banks plus outstanding international bonds. This is broader than the bank credit covered in previous sections, which captures banks loans and their holdings of debt securities.
6 The country counts are based on the BIS locational banking statistics by nationality.