BIS residential property price statistics, Q4 2022

Key takeaways
- At the end of 2022, global house prices fell in real terms for the first time in 12 years, by 2% year on year (yoy) in aggregate. This reflected a moderation in nominal house prices, which are now growing less rapidly (+6% yoy) than consumer prices.
- The decline in real house prices was particularly marked in advanced economies (AEs) (–2.7% yoy), contrasting with the previous quarter's increase. Prices continued to fall in emerging market economies (EMEs) (–1.5%).
- Important differences remain across major economies. For instance, real house prices surged in Türkiye (51%) and grew more modestly in Japan (+4%), but were flat in the United States and declined by 10% or more in Germany, Australia and Canada.
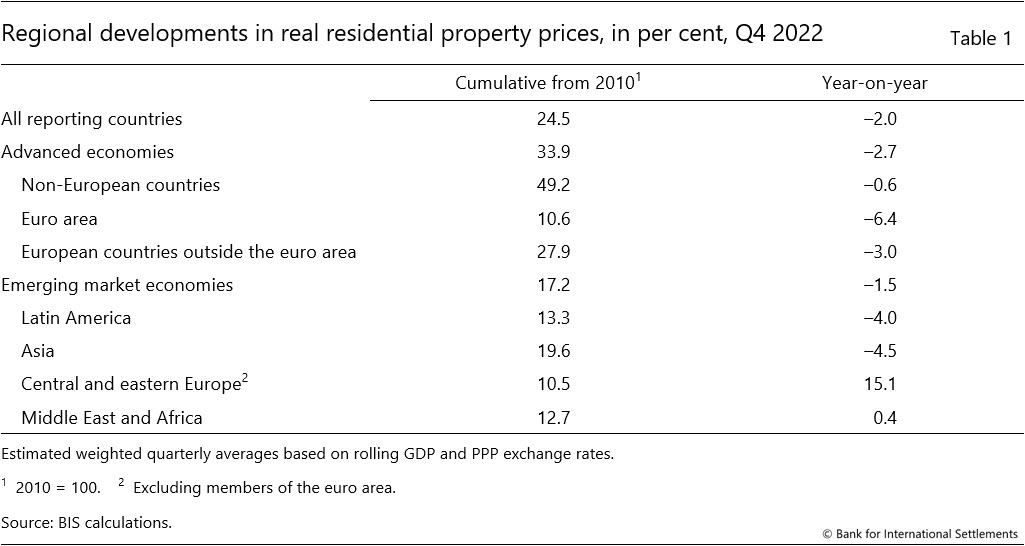
- In real terms, global house prices remain a solid 24% above the average posted after the Great Financial Crisis, by 34% in AEs and 17% in EMEs.
- The BIS commercial property price data set has continued to expand, now including data for Argentina, France, Slovenia and Spain for the first time.
Summary of latest developments
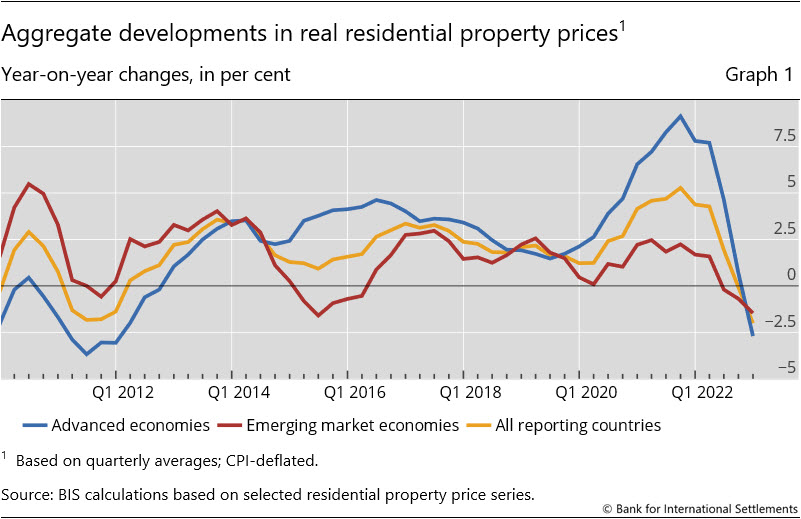
In the last quarter of 2022, global real house prices started to fall by 2% yoy after more than a decade of uninterrupted positive growth.1 This development reflected a slowdown in nominal price increases, to 6.0%, combined with continued strong growth in consumer prices.2
Real house prices fell for the first time in AEs since 2012, falling by 2.7% yoy, in sharp contrast to the 0.7% increase recorded in Q3 2022. In EMEs, prices fell further, by 1.5% after a 0.7% decline in the previous quarter (Graph 1), driven by decreases in Asia and Latin America (–4.5% and –4.0%, respectively).
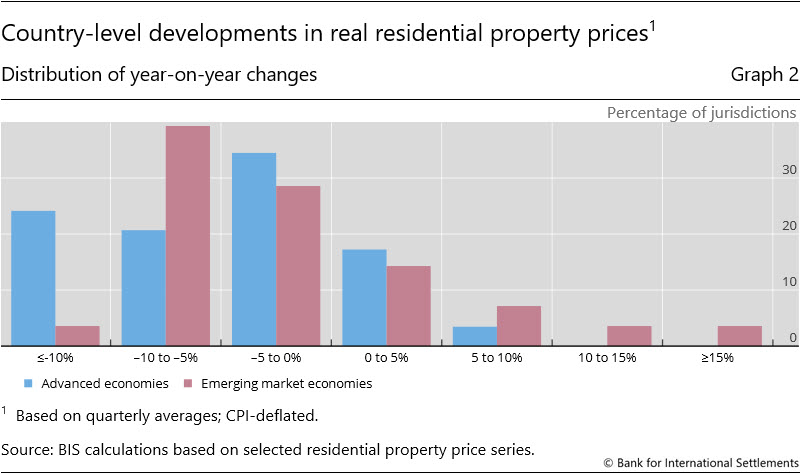
Country-level data show that the decline in real house prices has been spreading across jurisdictions, affecting 80% of AEs and 70% of EMEs. Moreover, four out of 10 countries are now registering price declines of more than 5% (Graph 2).3
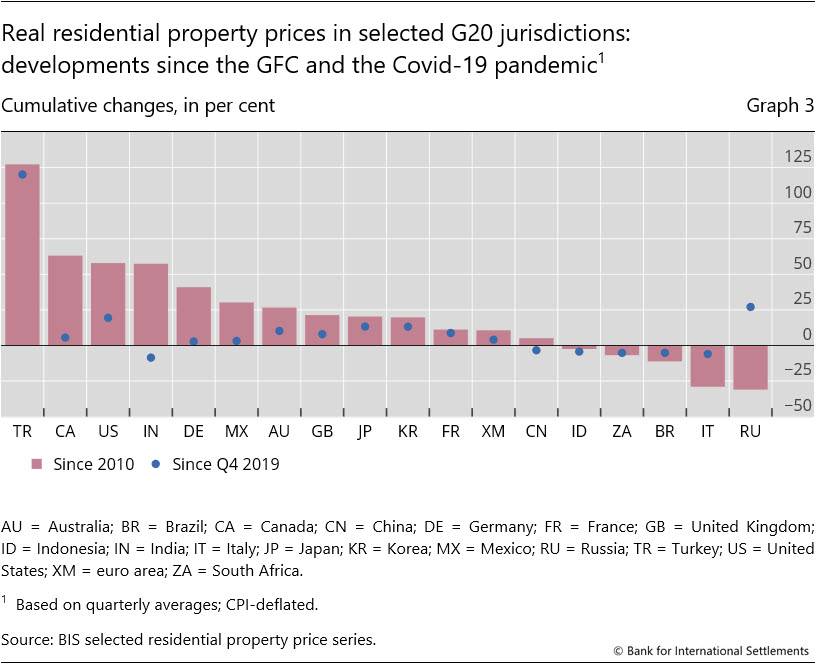
Despite their very recent fall, global real residential prices still remain well above their pre-Covid-19 pandemic levels (by 7% in aggregate). Compared with Q4 2019, they have increased by 120% in Türkiye, close to 20% in the United States, and between 10 and 15% in Australia, Japan and Korea. In contrast, real prices have fallen by 9% in India, and between 4 and 6% in Brazil, Indonesia, Italy and South Africa since the end of 2019 (Graph 3).
From a longer-term perspective, global house prices now exceed (in real terms) their immediate post-Great Financial Crisis (GFC) average by 24% (34% for AEs and 17% for EMEs) (Table 1). Among the G20 economies, real prices have more than doubled since 2010 in Türkiye (+127%) and they have risen by around 60% in Canada, India and the United States. At the other end of the scale, they remain well below their post-GFC levels in Italy, by 29%.
Advanced economies
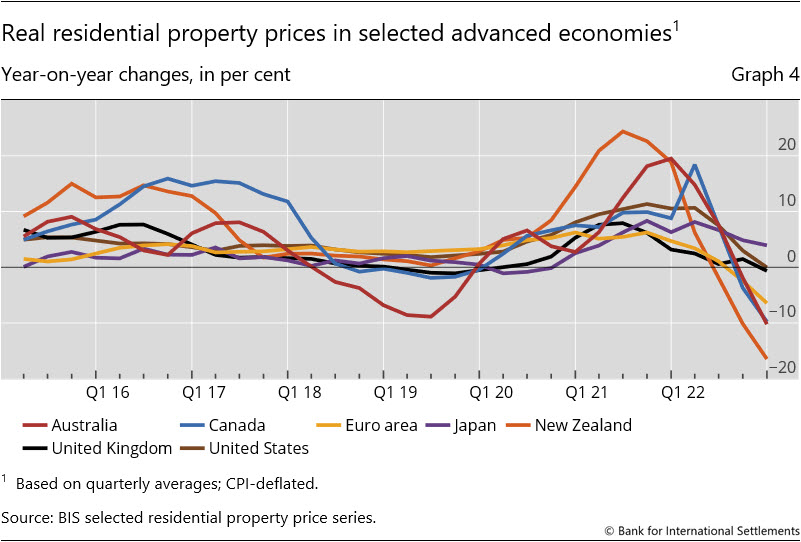
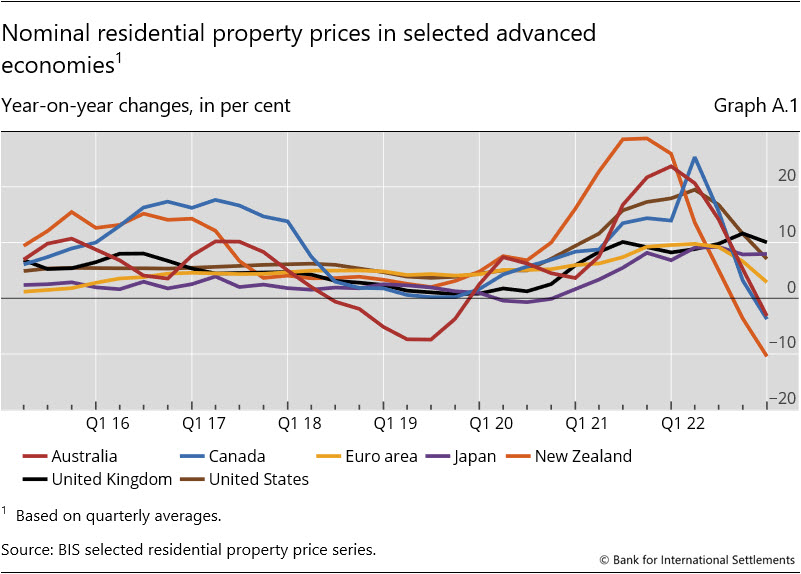
In aggregate for the group of AEs, real residential property prices declined by 2.7% in Q4 2022, marking a sharp reversal from the 0.7% increase observed the quarter before (Q3 2022). They rose by 4% in Japan and were broadly stable in the United States (0%) and the United Kingdom (–1%). Double-digit declines were recorded in Australia (10%), Canada (10%) and New Zealand (16%) (Graph 4).
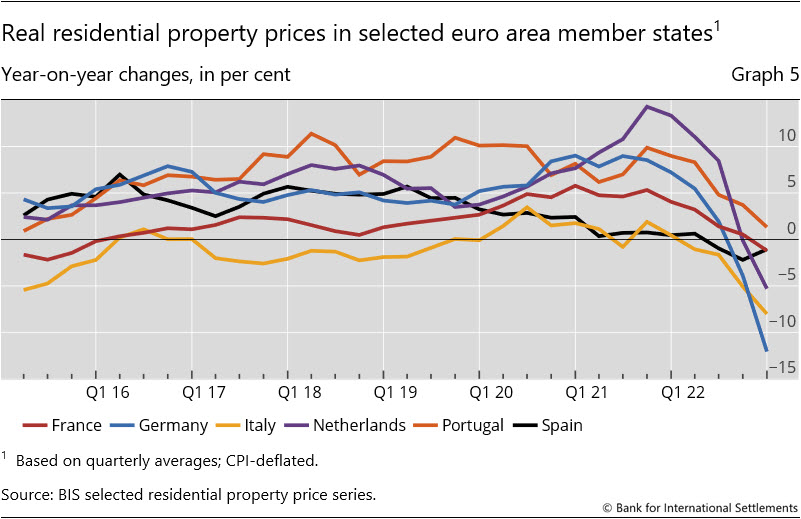
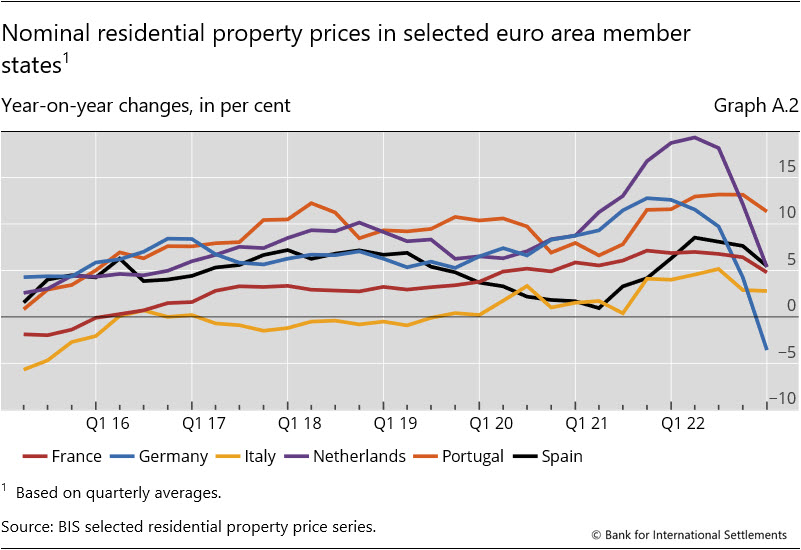
Real house prices fell further in the euro area (–6%), where developments continued to vary significantly among member states. Prices were stable in Portugal (+1%) and in France and Spain (both –1%). They declined by 5% in the Netherlands, 8% in Italy and, notably, by 12% in Germany (Graph 5).
Emerging market economies
Real residential property prices continued to fall in EMEs during the fourth quarter of 2022, by 1.5% yoy (versus –0.7% in Q3 2022).
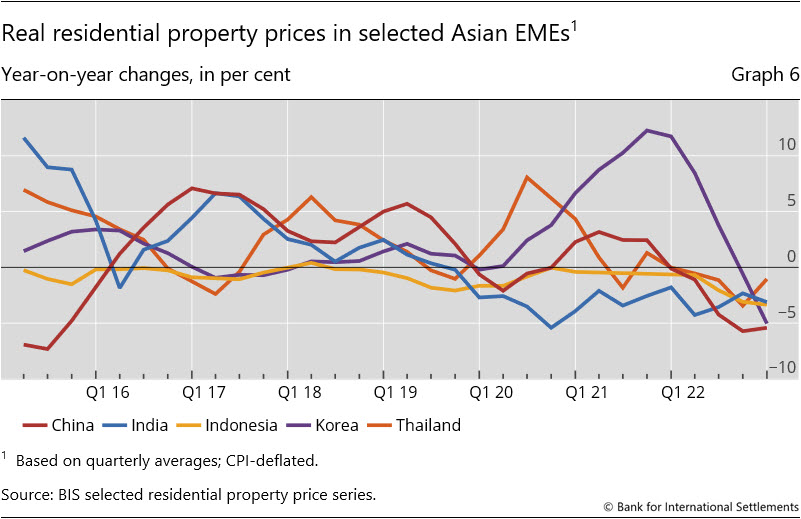
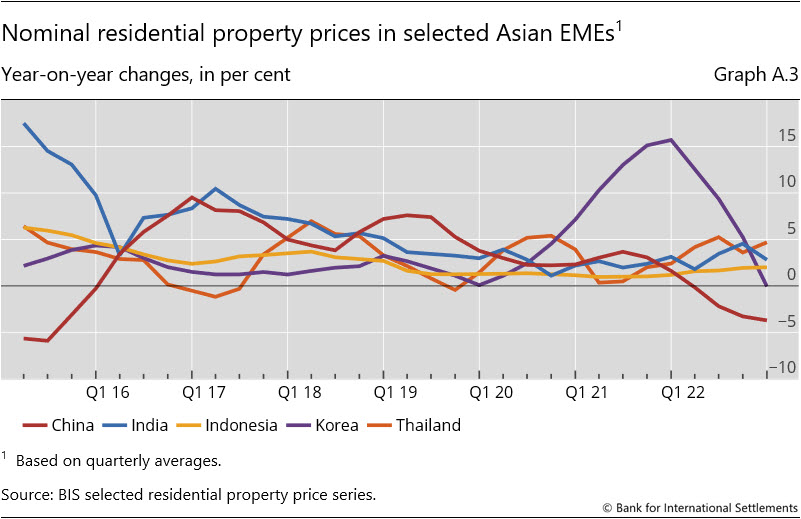
Prices declined in all major Asian economies, by 4.5% in aggregate. They fell by 1% in Thailand, 3% in India and Indonesia, and 5% in China and Korea (Graph 6).
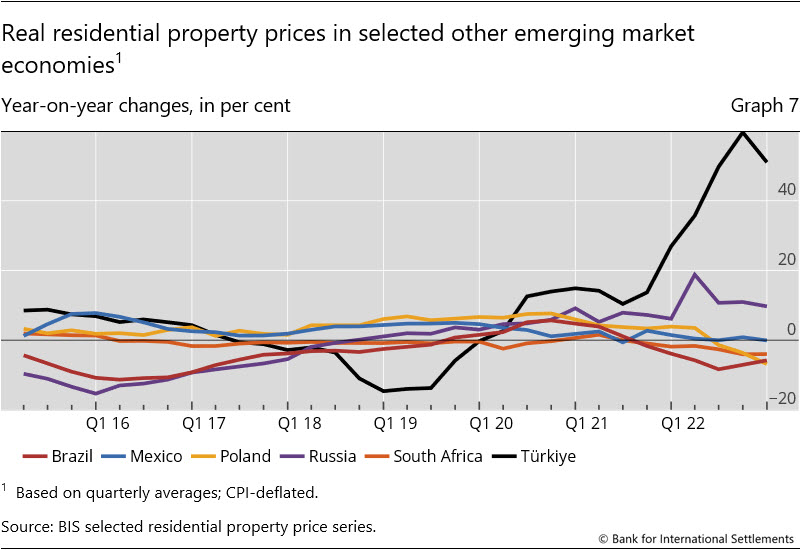
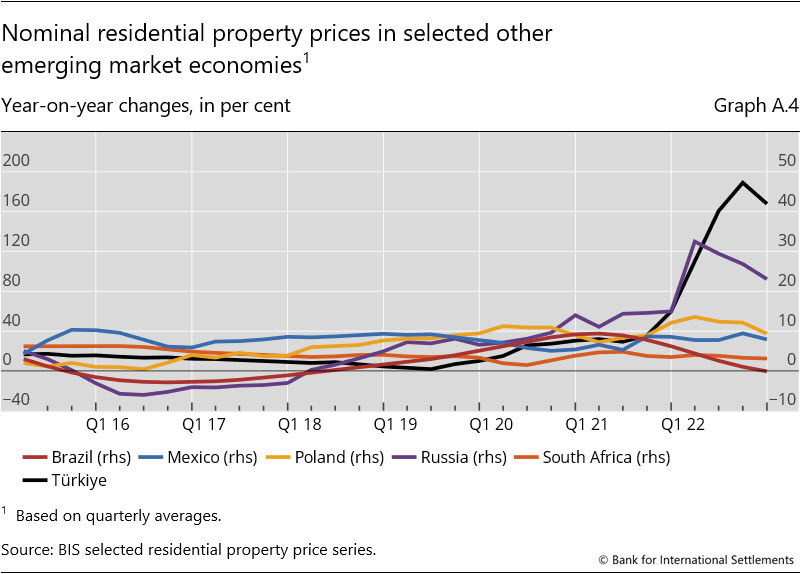
Real prices also sagged in Latin America (–4.0% in aggregate), driven mainly by the large decline in Brazil (–6%), while prices remained stable in Mexico. Among central and eastern European countries (+15.1% in aggregate), real property prices surged by 51% in Türkiye and declined in Poland (–7%). Lastly, prices fell by 4% in South Africa (Graph 7).
Annex: Nominal house price developments
1 Real residential property prices refer to nominal residential property price indicators deflated by the consumer price index. Global figures are weighted aggregates of selected AEs (Australia, Canada, Denmark, the euro area, Iceland, Japan, New Zealand, Norway, Sweden, Switzerland, the United Kingdom and the United States) and EMEs (Brazil, Bulgaria, Chile, China, Colombia, Croatia, Czechia, Hong Kong SAR, Hungary, India, Indonesia, Israel, Korea, Malaysia, Mexico, Morocco, North Macedonia, Peru, the Philippines, Poland, Romania, Russia, Singapore, South Africa, Thailand, Türkiye and the United Arab Emirates), based on PPP exchange rates. Regional aggregates have been available since 2007.
2 Residential property price developments in nominal terms are shown in the annex.
3 As regional aggregate developments are driven mainly by property price changes in major economies, they can mask detailed country-level features presented in the histogram.