BIS global liquidity indicators at end-December 2024

Key takeaways
- The BIS global liquidity indicators reveal that the share of Africa and the Middle East in dollar and euro credit to EMDEs has risen considerably over the past decade.
Global liquidity indicators at end-December 2024
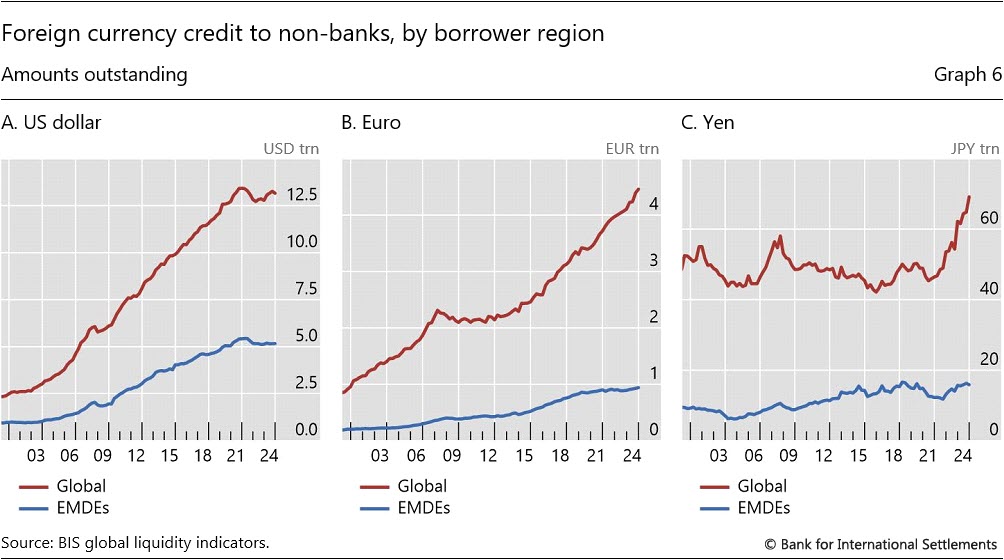
The BIS global liquidity indicators (GLIs) track total credit to non-bank borrowers, covering both loans extended by banks and funding from international bond markets.3 The latter is captured through the net issuance (gross issuance less redemptions) of international debt securities (IDS). The focus is on foreign currency credit denominated in the three major reserve currencies (US dollar, euro and Japanese yen) to non-residents, ie borrowers outside the respective currency areas.
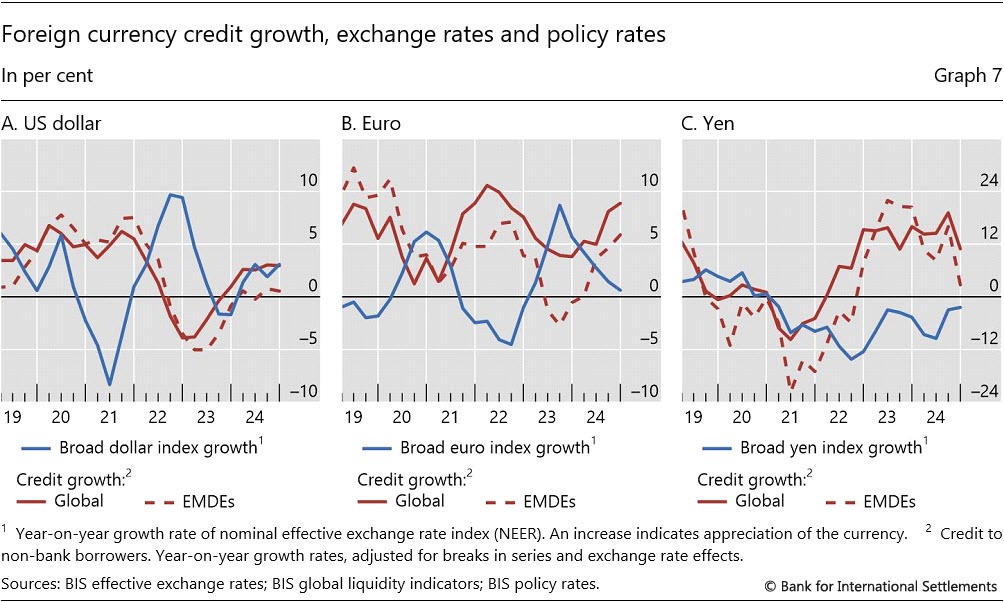
During Q4 2024, global foreign currency credit denominated in US dollars declined while that in euro and yen credit saw modest increases. A $103 billion fall in dollar credit to non-banks outside the United States brought its annual growth rate down to 3% and its outstanding stock to $13.2 trillion (Graphs 6.A and 7.A, red lines). Euro credit to non-banks outside the euro area expanded by €67 billion (8.9% year on year) and reached €4.5 trillion ($4.6 trillion) (Graphs 6.B and 7.B, red lines). Yen credit to non-banks outside Japan rose by ¥4.4 trillion. This brought its annual growth rate to 11% and its outstanding stock to ¥69.2 trillion ($441 billion) (Graphs 6.C and 7.C, red lines).
The growth rates of dollar, euro and yen credit to EMDEs continued to move inversely to their respective exchange rate indices. Against the backdrop of a broad dollar appreciation, dollar credit to EMDEs remained stagnant (growing by only 0.5%) in 2024 (Graph 7.A, blue line and dashed red line). By contrast, the slowdown in the appreciation of the euro coincided with a rise in the growth rate of euro credit to EMDEs, which expanded by 5.9% in 2024 (Graph 7.B, blue line and dashed red line). As the yen depreciation slowed towards the end of 2024, the growth rate of yen credit to EMDEs fell considerably (Graph 7.C, blue line and dashed red line).
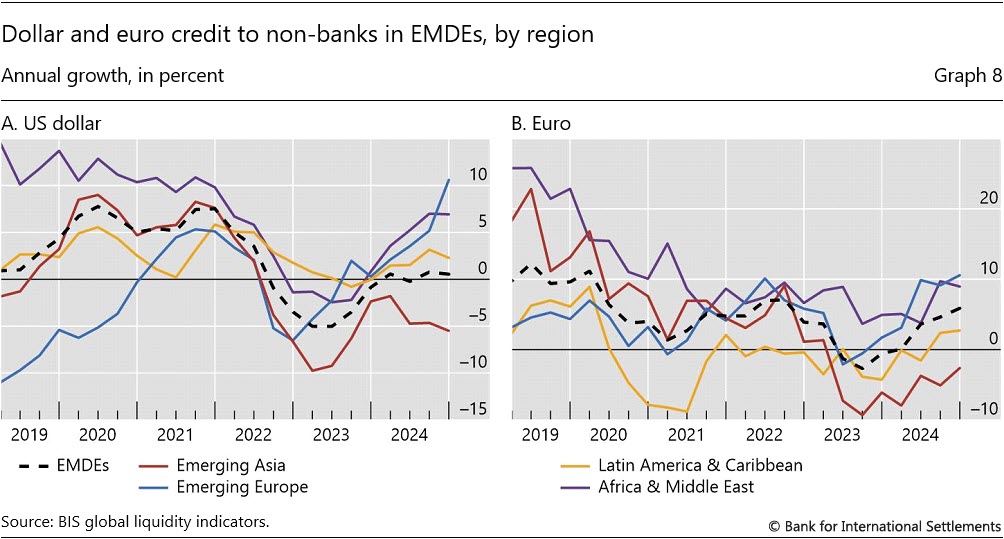
There were considerable divergences in dollar and euro credit across EMDE regions in 2024. Emerging Asia saw annual contractions in both dollar and euro credit ( 5.5% and 2.6%, respectively) (Graph 8, red lines). By contrast, dollar and euro credit to the other three EMDE regions expanded in 2024. Dollar credit grew by 11% in emerging Europe, by 6.9% in AME and by 2.3% in Latin America (Graph 8.A). Euro credit grew at an annual rate of 9% in AME, 11% in emerging Europe and 2.7% in Latin America (Graph 8.B).
The above divergences in foreign currency credit across EMDE regions are part of a longer pattern. Dollar credit to AME expanded considerably over the past decade. As a consequence, the AME share of dollar credit to EMDEs rose from 14% in 2014 to 27% in 2024 (Graph 9.A, purple line), surpassing the respective share for Latin America, which remained relatively flat (yellow line). Roughly two thirds of the expansion in dollar credit to AME over the past decade was attributable to lending to the Gulf Cooperation Council (GCC) countries.4 In the meantime, the dollar shares of emerging Asia and emerging Europe fell.
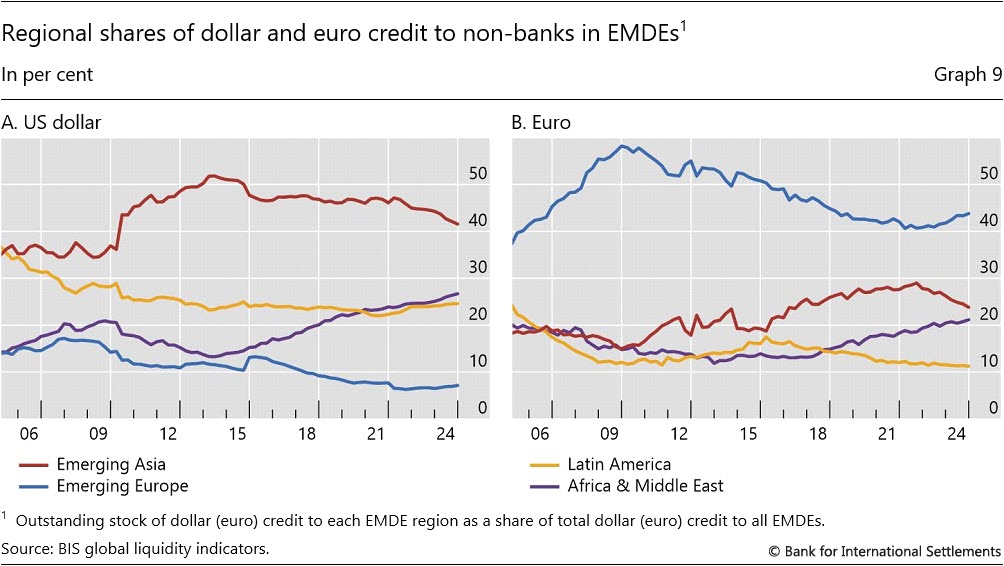
The trends in euro credit to EMDEs were similar. The AME share of euro credit to EMDEs rose from 14% in 2014 to 21% in 2024 (Graph 9.B, purple line). It is now close to surpassing the respective share for emerging Asia, which rose from 19% to 29% between 2014 and 2022, before falling to 24% in 2024 (red line). The past decade also saw contractions in the euro credit shares for emerging Europe (blue line) and Latin America (yellow line).
3 The GLIs cover total foreign currency credit denominated in US dollars, euros or Japanese yen, which includes loans from banks plus outstanding international bonds. This is broader than bank credit covered in previous sections, which captures banks loans and their holdings of debt securities.
4 The GCC countries are Bahrain, Kuwait, Oman, Qatar, Saudi Arabia and the United Arab Emirates.