BIS global liquidity indicators at end-September 2023

Key takeaways
- The BIS global liquidity indicators (GLIs) show an uptick in US dollar-denominated foreign currency credit in Q3 2023; US dollar credit to EMDEs, however, continued to decline.
Global liquidity indicators at end-September 2023
The BIS global liquidity indicators (GLIs) track total credit to non-bank borrowers, covering both loans extended by banks and funding from global bond markets. The latter is captured through the net issuance (gross issuance less redemptions) of international debt securities (IDS). The main focus is on foreign currency credit denominated in the three major reserve currencies (US dollars, euros and Japanese yen) to non-residents, ie borrowers outside the respective currency areas.8
Foreign currency credit in US dollars and euros rose slightly in Q3 2023, while yen-denominated credit inched down. The quarterly increase of $41 billion in US dollar credit to non-banks outside the United States left the outstanding stock at $13 trillion (Graph 6.A, solid red line). Nonetheless, the yoy growth rate remained negative (Graph 6.B, solid red line). Euro-denominated credit to non-banks outside the euro area remained near €4 trillion ($4.3 trillion) (Graph 6.A, solid blue line), 4% higher than a year earlier. After two years of rapid expansion, yen credit outside Japan lost momentum due to a decline in bank loans. The outstanding stock, at ¥56 trillion ($390 billion), was still up 11% from a year earlier (Graph 6.B, solid yellow line).
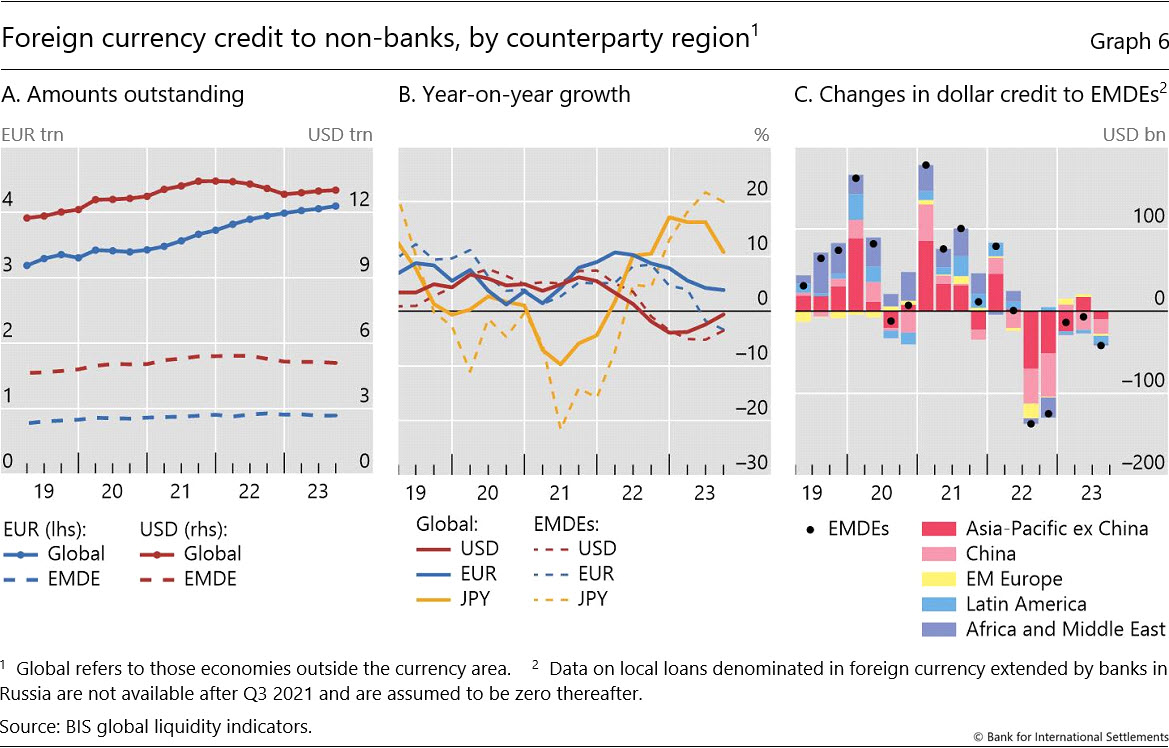
Dollar-denominated foreign currency credit to non-banks in EMDEs fell by $42 billion in Q3 due to weaker bank lending, leaving the amount outstanding at $5.1 trillion (Graph 6.A). As a result, the yoy growth remained firmly negative at -3.5% (Graph 6.B, dashed red line). Looking across regions, dollar credit to borrowers in the Asia-Pacific region fell the most in Q3 (-$27 billion), followed by credit to those in Latin America (-$9 billion) (Graph 6.C).
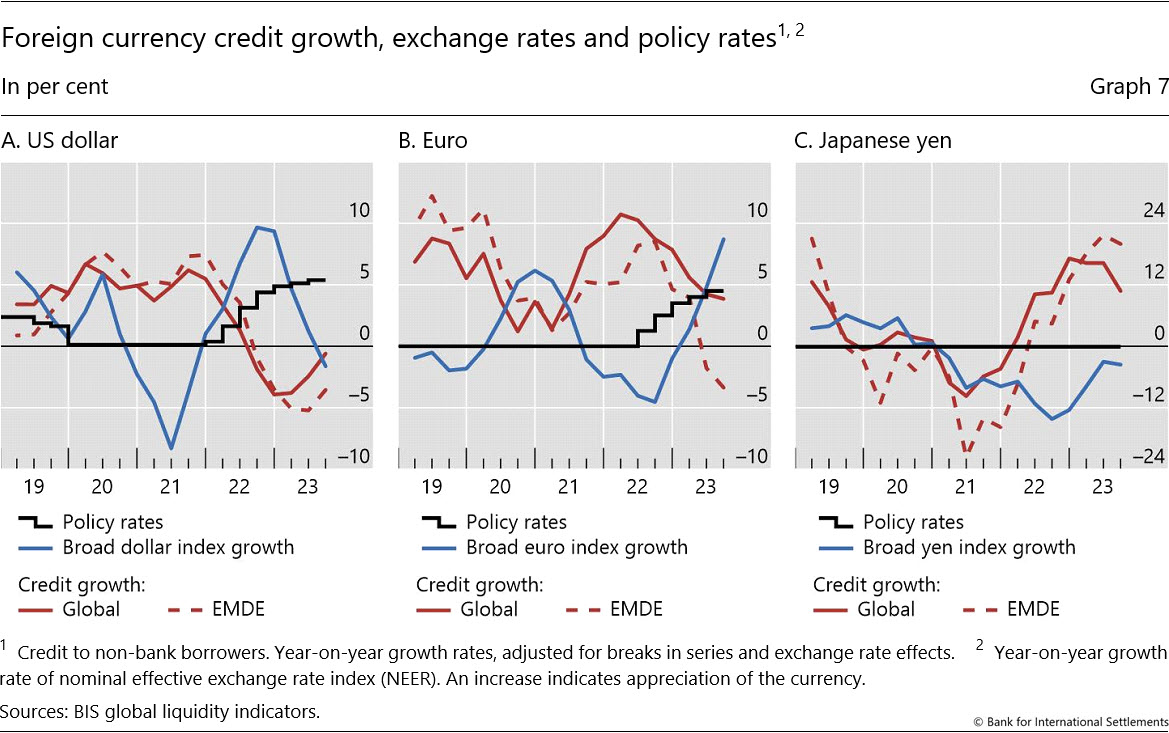
The differences in credit growth across the dollar, euro and yen reflect their respective funding costs and associated exchange rate movements. The negative co-movement between exchange rate indices and credit growth has been salient over the past few years (Graph 7). Monetary policy tightening by the Federal Reserve in response to the surge in inflation led to a stronger dollar from early 2022 onward, weighing on dollar-denominated bank lending and bond issuance. The European Central Bank followed suit, triggering a similar pattern in euro credit growth. Moreover, brisk growth in yen credit between early 2022 and mid-2023 went hand in hand with sustained yen depreciation as the Bank of Japan kept interest rates below zero.
The negative co-movement between exchange rates and credit growth was particularly evident for EMDEs. The 3.5% yoy decline in dollar credit to EMDEs at end-Q3 2023 was notable compared with the 0.6% global decline. The discrepancy was even more striking for euro credit. In Q3, euro credit to all borrowers outside the euro area grew by 3.9% yoy, but euro credit to EMDEs shrank by 3.4% yoy. Finally, yen credit to EMDEs continued to grow at 20% yoy, compared with a global figure of 11% yoy.
8 For more details, see the GLI methodology: www.bis.org/statistics/gli/gli_methodology.pdf.