BIS global liquidity indicators at end-September 2021
Key takeaways
- The global liquidity indicators (GLIs) show that financing through the bond market now accounts for as much dollar credit to EMDEs as lending from internationally active banks.
- For the first time since the start of the Covid-19 pandemic, growth in dollar- and euro-denominated foreign currency credit outpaced domestic credit in the respective currency areas.
The BIS global liquidity indicators (GLIs) track credit to non-bank borrowers, covering both loans extended by banks and funding from bond markets. The main focus is on foreign currency credit denominated in three major reserve currencies (US dollar, euro and Japanese yen) to non-residents, ie borrowers outside the respective currency areas. The GLIs monitor growth in these aggregates and compare them with the evolution of credit (denominated in the same currencies) to residents within these currency areas, as reported in national financial accounts.
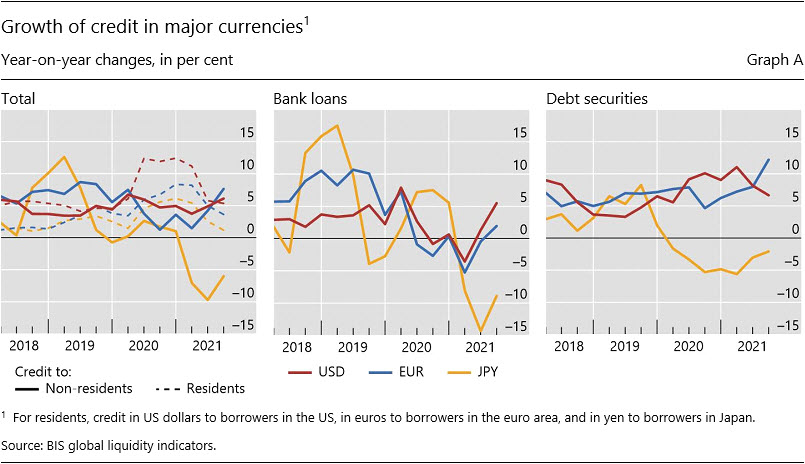
In the third quarter of 2021, foreign currency credit in dollars, euros and yen increased modestly, pulling up the respective year-on-year (yoy) growth rates (Graph A, left-hand panel). Dollar credit to borrowers outside the United States stood at $13.4 trillion at end-Q3, up 6% yoy. Growth in euro credit to borrowers outside the euro area gathered pace compared with previous quarters: the 8% yoy expansion brought the stock to €3.7 trillion ($4.3 trillion). Meanwhile, yen credit to borrowers outside Japan continued to fall, but at a slightly reduced pace of –6% yoy, bringing the amount outstanding to ¥46 trillion ($0.4 trillion).
Further reading
Bank loans in dollars and euros rebounded in Q3 2021, while credit from bond markets in the same currencies continued to expand (Graph A, centre and right-hand panels). Bank loans to non-residents jumped in the third quarter, pushing the yoy growth rates in dollar and euro lending to 5% and 2%, respectively (centre panel). Over the same period, bond issuance in dollars and euros grew strongly at 7% and 12% yoy, respectively (right-hand panel). In contrast, net bond issuance in yen continued to contract (–2% yoy), though less than bank lending in that currency (–9%). As a result of these developments, the share of foreign currency credit provided through bond markets continued to increase in all three currencies.
For the first time since the start of the pandemic in early 2020, growth in dollar- and euro-denominated foreign currency credit outpaced domestic credit in the respective currency areas (Graph A, left-hand panel). After brisk growth in domestic credit in 2020 and 2021, yoy growth fell back to rates prevailing before the pandemic (dashed lines). Meanwhile, dollar and euro credit to non-residents of these currency areas accelerated (solid lines). Yen credit, on the other hand, has remained weak by comparison, both to non-residents and residents of Japan.
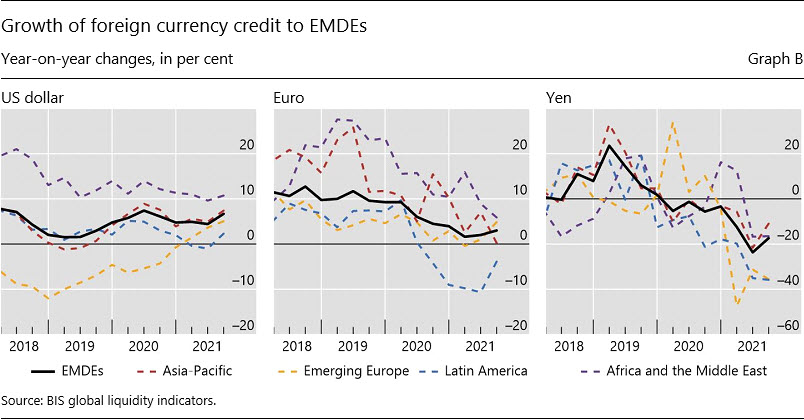
Foreign currency credit towards EMDEs has continued to hold up (Graph B, left-hand and centre panels). Dollar credit to EMDEs reached $4.2 trillion (Annex Graph C.4, right-hand panel), while that denominated in euros reached €0.8 trillion (Table E2-EUR). For both currencies, this reflects continued expansion vis-à-vis most regions, except for euro credit in Latin America (–4% yoy, centre panel), with Brazil and Mexico accounting for the largest declines over the past year. Albeit small, yen-denominated credit to EMDEs continued to decline, reaching ¥7 trillion ($62 billion).
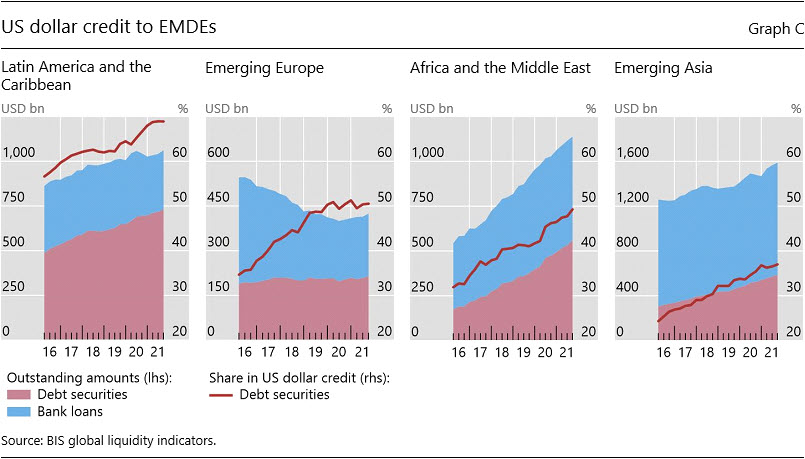
EMDEs are approaching a similar reliance on bond markets for dollar funding to that observed for advanced economies. Bond markets now provide as much dollar credit to EMDEs as internationally active banks do (Annex Graph C.4, right-hand panel). The share of debt securities in dollar credit has trended up since the Great Financial Crisis (GFC) to reach 50% in the latest quarter; an earlier run-up towards 50% ended in 2003, when international bank lending outpaced bond market finance to emerging market economies until the GFC hit. The trend towards bond financing is shared across EMDE regions (Graph C). Latin America and the Caribbean rely on bonds the most, with nearly 69% of total dollar credit raised in bond markets (first panel). In emerging Europe, 51% of total dollar credit comes from bond markets, with the stock of debt securities reaching a peak of $214 billion in Q3 2021 (second panel). In Africa and the Middle East, bond financing has been growing steadily since 2016, pushing its share towards 50% in the latest quarter (third panel). In emerging Asia, bank loans still account for 63% of total dollar credit to the region; however, the bond share and amounts outstanding have been rising consistently, bringing the stock in Q3 2021 to $588 billion (or 37% of total dollar credit; fourth panel).
 For more details, see the GLI methodology