BIS international banking statistics and global liquidity indicators at end-September 2021

Key takeaways
- Banks' cross-border claims increased by $228 billion in the third quarter of 2021, pushing their year-on-year (yoy) growth rate to 3%. Claims on non-bank financial institutions accounted for more than half of the quarterly increase.
- Non-US banks increased their US dollar funding to their affiliates in the United States and, in turn, expanded their claims on the US official sector through greater holdings of US Treasury securities and reserves at the Federal Reserve.
- Claims on emerging market and developing economies (EMDEs) fell modestly in the third quarter, driven by a contraction in claims on China. By contrast, claims on Latin America and Africa and the Middle East grew.
- The global liquidity indicators (GLIs) show that financing through the bond market now accounts for as much dollar credit to EMDEs as lending from internationally active banks.
- For the first time since the start of the Covid-19 pandemic, growth in dollar- and euro-denominated foreign currency credit outpaced domestic credit in the respective currency areas.
Cross-border claims rise, particularly on the United States
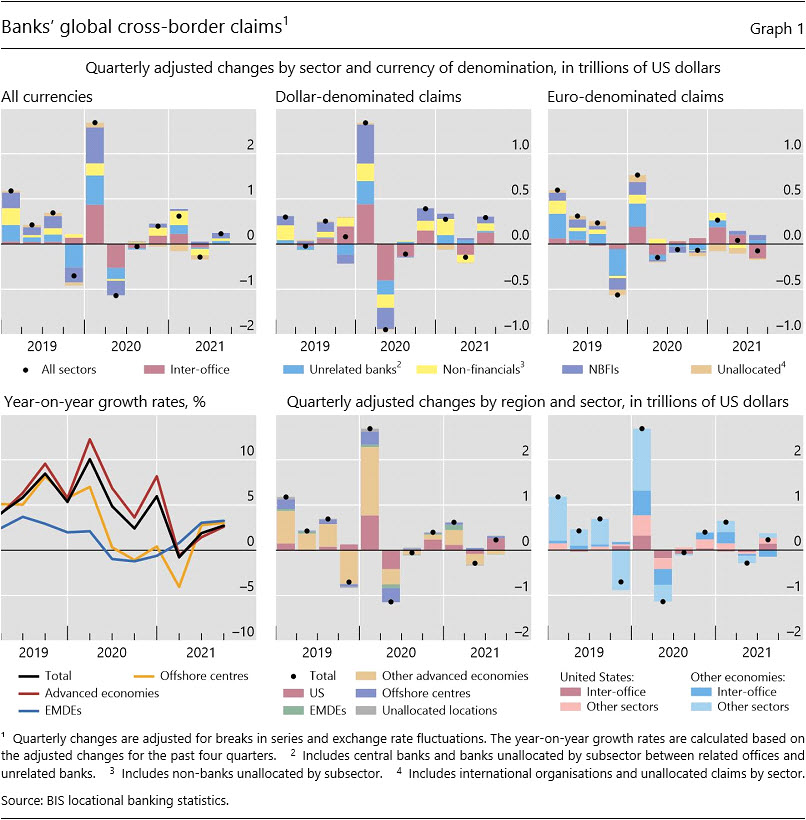
The BIS locational banking statistics (LBS) show that internationally active banks' cross-border claims rose by $228billion (to $35 trillion) during the third quarter of 2021 (Graph 1, top left-hand panel).1 On a year-on-year (yoy) basis, claims on all regions rose by about 3% (bottom left-hand panel). Over half of the quarterly increase reflected greater claims on non-bank financial institutions (NBFIs), which went up by $119 billion. Claims on unrelated banks and non-financials also expanded, by $71 billion and $55 billion, respectively.2 Meanwhile, inter-office claims fell by $4 billion.
These figures, however, mask large differences across counterparty countries and the currencies in which the claims are denominated. Claims in euros fell by $76 billion overall, due to lower inter-office claims (Graph 1, top right-hand panel) among major European countries. Euro claims on other sectors expanded, mostly on NBFIs and unrelated banks. In contrast, claims denominated in US dollars jumped by $293 billion, reflecting greater inter-office positions ($128 billion) and lending to non-financials ($83 billion) and NBFIs ($74 billion) (top centre panel).
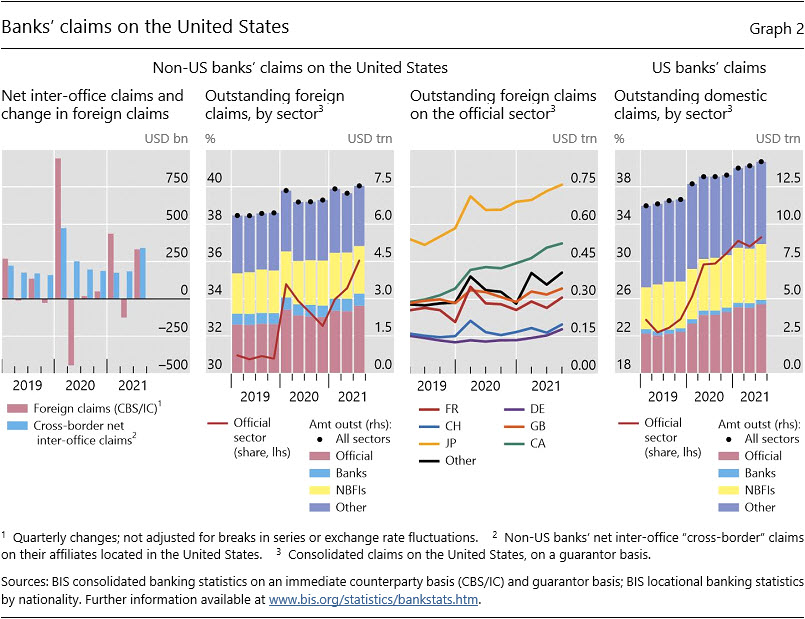
Most of the increase in claims was on borrowers in the United States (+$268 billion, +9% yoy) (Graph 1, bottom centre and right-hand panels). Inter-office claims on the United States jumped by $143 billion (bottom right-hand panel) as non-US banks channelled funds to their affiliates operating in the United States (Graph 2, first panel). The first quarter of 2020 saw similar developments on a larger scale.
Greater inter-office claims on the United States went hand in hand with increased claims on the official sector in particular. The BIS consolidated banking statistics (CBS), which track the globally consolidated positions of banks headquartered in a country, show that non-US banks' foreign claims3 on the US official sector grew by $215 billion to reach $2.7 trillion in Q3 (Graph 2, second panel). Claims on the US official sector include claims on the Federal Reserve, notably reserves.4
Claims on the US official sector rose to 36% of non-US banks' total claims on the United States at end-Q3 2021, up from 31% at end-2019 (Graph 2, second panel). Several major banking systems increased their consolidated claims on the US official sector (third panel). A similar expansion was observed among US banks: their claims on the official sector reached $4.6 trillion at end-Q3 2021 (fourth panel), a full 67% higher than at end-2019.5 These trends have taken place against the backdrop of asset purchases and quantitative easing operations by the Federal Reserve.
Cross-border claims on EMDEs dropped, reflecting lower claims on China
Banks' cross-border claims on EMDEs fell slightly in Q3 2021, by $7 billion (Graph 3, left-hand panel). On a yoy basis, their growth rate remained positive overall (3%, for all EMDE regions combined), with higher rates of growth vis-à-vis the Asia and Pacific and Africa and the Middle East regions (+5% in both cases). Yearly growth in lending to Latin America (–4%) and emerging Europe (–1%) remained negative (centre panel).
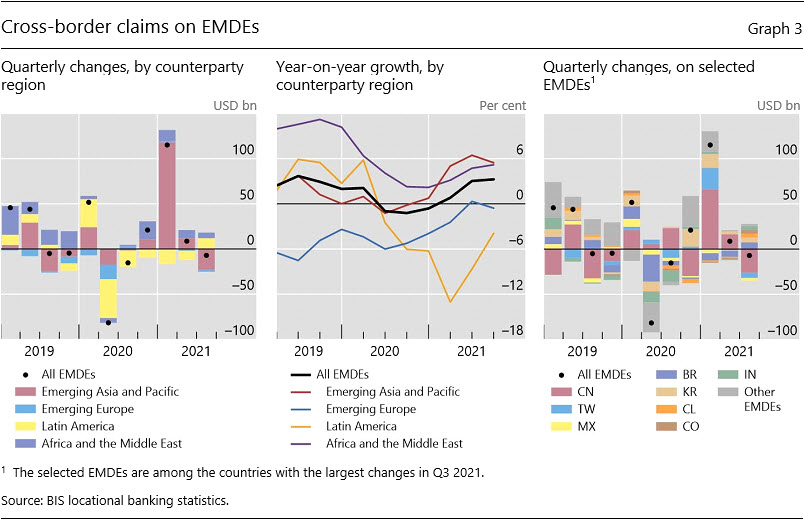
The quarterly decline in global claims on EMDEs in Q3 2021 was due to reduced lending to borrowers in Asia and Pacific. Claims on the region dropped noticeably (–$23 billion), especially vis-à-vis China (–$26 billion) (Graph 3, red bars). Banks in Hong Kong SAR and Macao SAR reported the largest reductions in claims on China (–$17 billion), after increasing their claims on the mainland by $46 billion over the previous two quarters. Elsewhere in the Asian region, claims on Chinese Taipei dropped (–$6 billion) while those on Korea ($5 billion) and India ($4 billion) grew.
By contrast, claims on Latin America picked up ($12 billion) in Q3 2021, for the first time since Q1 2020 (Graph 3, left-hand panel), with significant increases vis-à-vis Brazil ($7 billion), Chile ($4 billion) and Colombia ($4 billion). Banks located in the United States, Luxembourg and Panama were the main lenders to the region.
Elsewhere, claims on Africa and the Middle East continued to rise ($6 billion), although at a slower pace than previously, while those on emerging Europe fell (–$2 billion). Banks reported greater claims on Eswatini, Liberia and Saudi Arabia (+$2 billion each), but lower claims on South Africa and Qatar (-$2 billion each). For South Africa, this was the 10th consecutive quarterly decline. Among the emerging European countries, claims on Croatia and Poland fell by a combined $3 billion.
1 In the LBS, claims comprise loans, holdings of debt securities and derivatives with a positive market value.
2 The sector total for non-financials includes non-banks unallocated by subsector.
3 Foreign claims on a guarantor basis comprise cross-border claims and local claims of banks' foreign affiliates. They exclude inter-office positions. In the CBS, the official sector includes the central bank, and thus differs from the general government sector in the System of National Accounts.
4 Data published by the Federal Reserve show that the reserves of non-US banks' branches and agencies in the United States increased by almost $170 billion in Q3 2021, to $970 billion. Meanwhile, their holdings of US Treasury securities and agency- and GSE-backed securities edged up by a combined $2.2 billion, to reach $145 billion.
5 Data published by the Federal Reserve show that the reserves of US-chartered banks' depository institutions increased by $184 billion in Q3, to $2.7 trillion. They also increased their holdings of US Treasury securities by $100 billion to $1.3 trillion, while those in agency- and GSE-backed securities also went up by $100 billion to $3.5 trillion.