BIS global liquidity indicators at end-March 2021
Key takeaways
- Foreign currency credit growth, an indicator of global liquidity, held up for credit dominated in US dollars, but weakened for euro- and yen-denominated credit.
- Bank lending declined for all three currencies against the backdrop of strong bond issuance in dollars and euros.
The BIS global liquidity indicators (GLIs) track credit to non-bank borrowers, covering both bank lending and bond market financing. The main focus is on foreign currency credit, ie credit denominated in the three main reserve currencies (US dollar, euro and Japanese yen) to non-residents, ie borrowers resident outside the respective currency area. The GLIs also track credit denominated in those same currencies to residents within these currency areas.
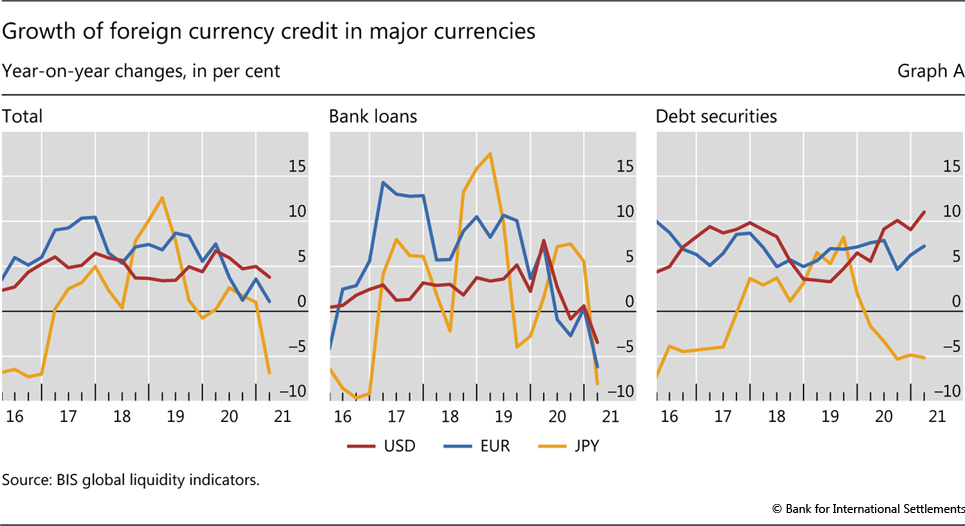
Developments in credit in the three major currencies over the past four quarters have been mixed. Dollar credit to borrowers outside the United States reached $13 trillion at end-Q1 2021, up 4% yoy (Graph A, left-hand panel). The growth in euro credit to borrowers outside the euro area remained weak by comparison, up 1% yoy to reach €3.5 trillion (equivalent to $4.1 trillion). And the growth in Japanese yen credit to borrowers outside Japan was -7% yoy, pushing the amounts outstanding down to ¥47 trillion ($0.4 trillion).
Further reading
These growth rates are lower than in the years before the pandemic, and weaker than those for credit to residents in these three currency areas. In each of the main currencies, credit to resident non-bank borrowers has grown faster than credit to non-residents since the start of the pandemic; in the most recent quarter, it expanded by 11%, 8% and 5% yoy, for the dollar, euro and yen, respectively (Annex Graphs C.3 and C.6). The surge in credit to residents during this period was fuelled by increased government borrowing, reflecting the pandemic's impact on government finances and efforts to mitigate its economic effects.
The yoy growth in bank lending dipped noticeably in Q1 2021, leaving borrowers to raise foreign currency funding in bond markets. After trending downwards since early 2020 (Graph A, centre panel), the yoy growth in US dollar, euro and yen loans to non-residents turned negative in Q1 2021, to reach -3%, -6% and -8%, respectively. By contrast, bond financing in US dollars and euros continued to grow, by 11% and 7% yoy (right-hand panel).
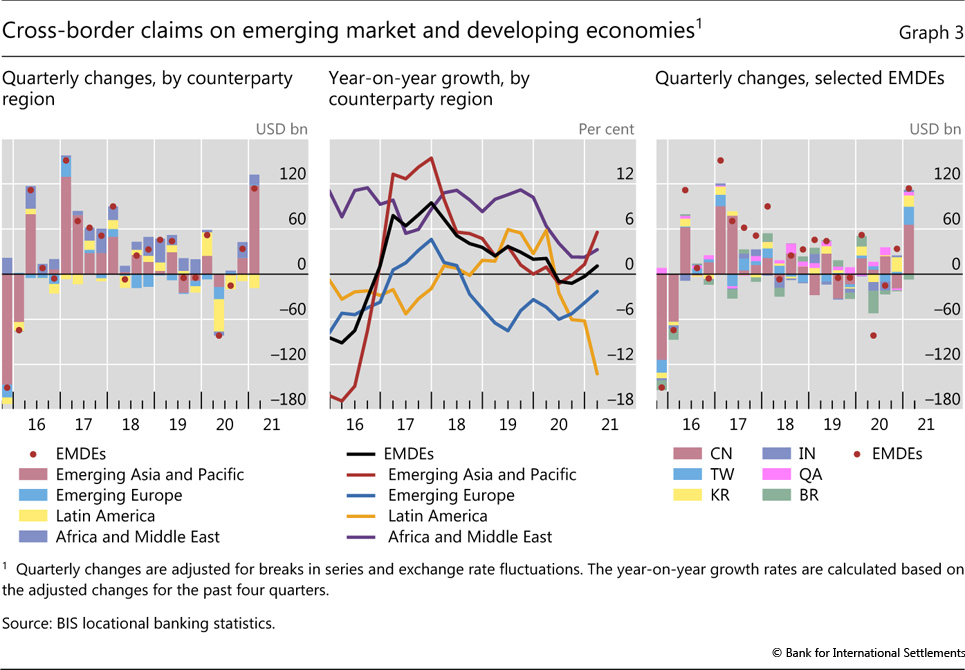
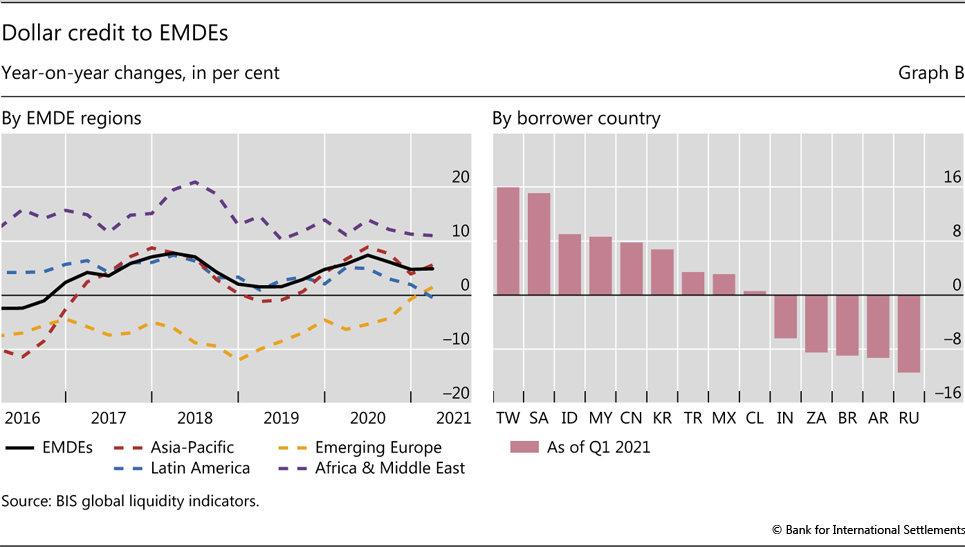
The growth in dollar credit to emerging market and developing economies (EMDEs) remained stable overall, but with considerable heterogeneity across regions (Graph B, left-hand panel). Dollar credit to borrowers in Africa and the Middle East grew at 11% yoy, continuing the strong trend evident since 2014. Within this region, credit to borrowers in Saudi Arabia grew robustly (15% yoy), whereas credit to those in South Africa contracted (-8% yoy) (Graph B, right-hand panel). Dollar credit borrowers in emerging Asia-Pacific grew more moderately at 6% yoy, exceeding the 1% average annual growth observed in the four years prior to the pandemic. Credit to China grew over the past four quarters (8% yoy), whereas credit to India contracted (-6% yoy). Dollar credit to Latin America ground to a halt in the most recent quarter, down from an average 4% yoy growth rate over the past five years. While Mexico attracted dollar credit at the rate of 3% yoy, credit to both Argentina and Brazil dropped sharply by 9% each. Lastly, dollar credit to emerging Europe grew marginally, by 1% yoy, following six years of negative growth rates. Modest growth in dollar credit to Turkey (3%) contrasted with a rapid decline in that to Russia (-11%).
The divergence in dollar credit across individual EMDEs was mainly due to the developments in bank lending, contrasting with strong bond issuance overall. Graph 3 in the main text above illustrates the evolution of bank lending to EMDEs.
 Among the 14 economies for which GLI data are published (listed in Graph B, right-hand panel), only three saw a contraction in bond issuance in the four quarters up to Q1 2021. By contrast, bank lending contracted in 10 out of these 14 economies over the same period. In Asia-Pacific, China, Chinese Taipei and Korea registered strong increases in bank lending, ranging from 6% to 16% yoy. As a result, bank lending to the region as a whole saw a modest growth of 2% yoy. This, coupled with vigorous bond issuance in the region overall (14% yoy), contributed to robust growth in overall dollar credit to Asia-Pacific. By contrast, bank lending to the major economies in Latin America dropped in the year to Q1 2021, resulting in a decline of 13% for the region as a whole. This, together with moderate bond issuance (7%), resulted in flat credit growth overall.
The average growth in credit in the five years up to Q1 2020 has been 5%, 7% and 1% for the dollar, euro and yen, respectively. Within the non-bank sector, dollar bond issuance of EMDEs as a whole was dominated by issuance of the general government, extending the trend since 2016. Graph 3 in this release refers to BIS reporting banks' cross-border claims (all instruments) on all sectors denominated in all currencies, from the BIS locational banking statistics by residence (LBSR). Bank lending in the GLI covers banks' cross-border and local claims (loans only) on the non-bank sector denominated in US dollars, sourced from the LBSR and national data. For more details, see the GLI methodology.