BIS global liquidity indicators at end-December 2020
Key takeaways
- Foreign currency credit growth, an indicator of global liquidity, held up in 2020.
- Issuance of debt securities, rather than loans, continued to be the main driver of dollar credit outside the United States.
The BIS global liquidity indicators (GLIs) track credit to non-bank borrowers, covering both bank lending and bond market financing. The main focus is on foreign currency credit, ie credit denominated in the three main reserve currencies (US dollar, euro and Japanese yen) to residents outside a currency area. GLIs also track the respective credit denominated in those same currencies to residents within their respective currency areas.
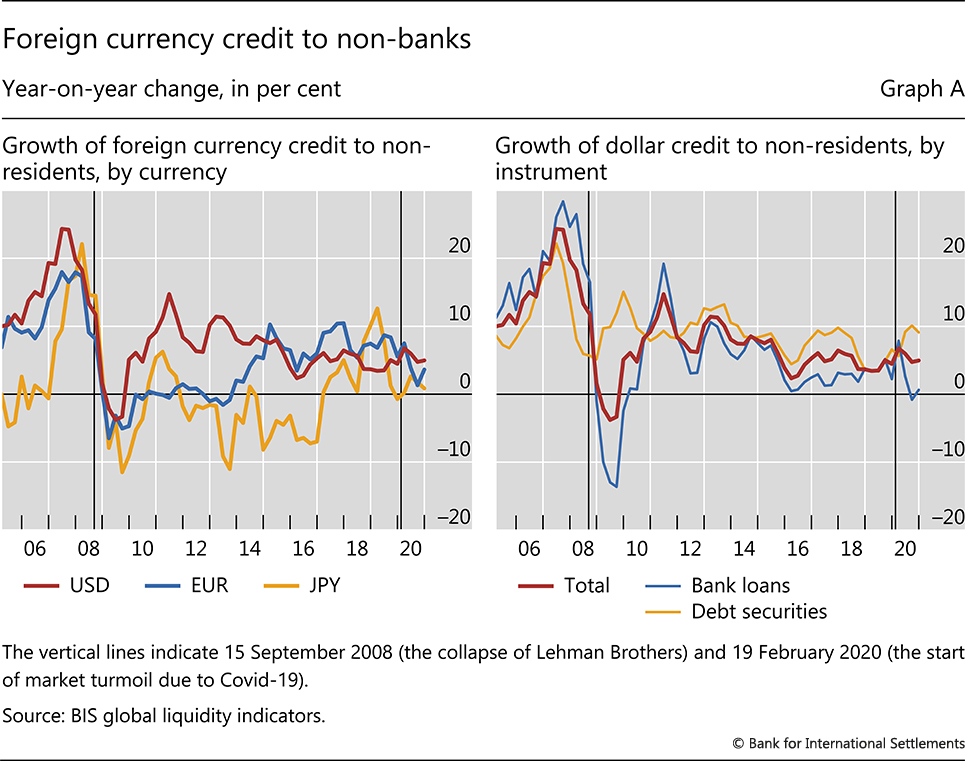
Growth in foreign currency credit to non-residents held up during the Covid-19 pandemic. By end-2020, US dollar-denominated credit to non-banks outside the United States had grown by 5% year-on-year (yoy), reaching $12.7 trillion. Meanwhile, euro credit to non-banks outside the euro area grew by 4%, to reach €3.7 trillion (equivalent to $4.5 trillion). And yen credit to non-banks outside Japan grew by 1%, to reach ¥49 trillion (or $0.5 trillion). These positive growth rates during the Covid-19 pandemic stand in stark contrast to the sharp contractions observed during the Great Financial Crisis (GFC) of 2008–09 (Graph A, left-hand panel).
Further reading
Yet credit to non-residents was less strong than credit to residents. In each of the main currencies, credit to resident non-bank borrowers grew faster than credit to non-residents since the start of the pandemic (Annex Graph C.3). The surge in credit to residents in 2020 was fuelled by increased government borrowing, reflecting the pandemic's impact on government finances and efforts to mitigate its economic effects. Dollar credit to the US government grew by 21% yoy in Q4 2020, while euro credit to euro area governments increased by 15% – comparable to the growth rates seen following the GFC in both cases (Annex Graph C.6, dashed lines).
Dollar credit to emerging market and developing economies (EMDEs) showed a similar pattern as credit to all borrowers outside the United States. For most EMDEs, the US dollar accounts for the largest share in foreign currency credit (Annex Graph C.5). As of end-2020, dollar credit grew by a robust 5% yoy, only slightly below the 7% average over the past decade (Graph B, left-hand panel). As a result, dollar credit to EMDEs reached $4 trillion at end-2020, more than twice the amount outstanding at the time of the GFC, and about a third of the global dollar debt owed by all non-bank borrowers outside the United States.
Dollar credit expanded in all but one EMDE region by end-2020. Credit to Africa and the Middle East, which has been growing at double-digit rates since mid-2015, rose by 11% in 2020. Credit to emerging Asia-Pacific and Latin America and Caribbean also expanded, by 4% and 2%, respectively. By contrast, dollar credit to emerging Europe remained weak, although contracting by less in 2020 (–1% yoy) than the average over the past five years (–7%).
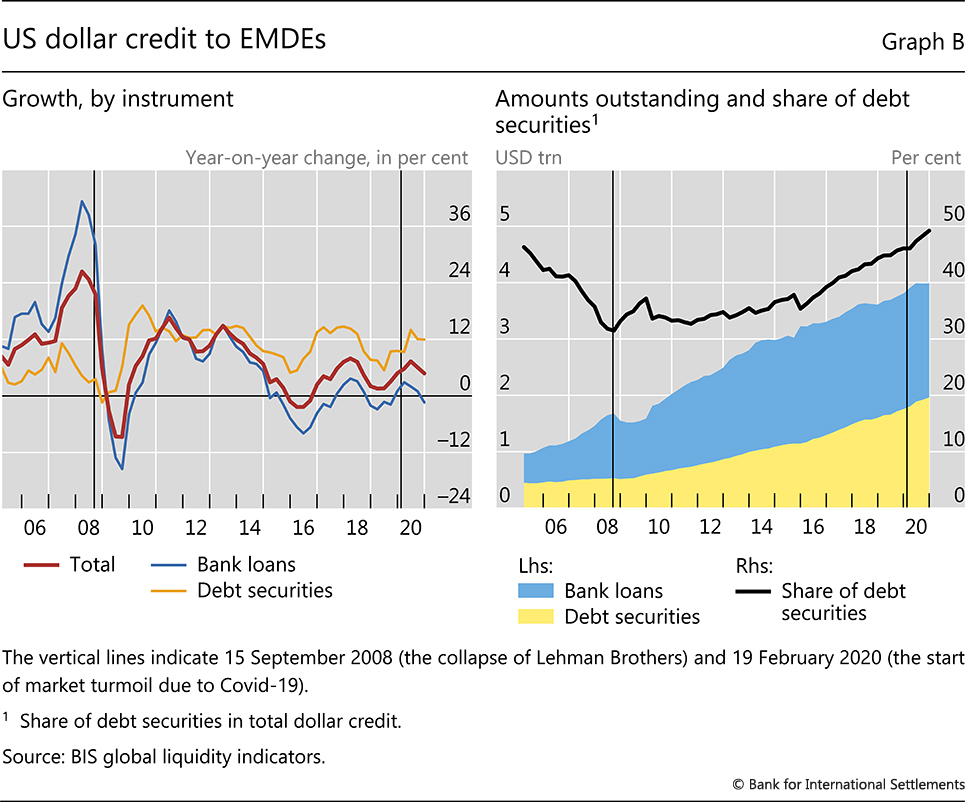
Developments in bank lending explain the stark difference between dollar credit growth during the GFC and Covid-19 pandemic. Although loan growth slowed in the course of 2020 – a period characterised by an even deeper recession than in 2009 – it remained well above that seen during the GFC. In 2009, bank loans had declined sharply (–14% yoy in Q3 2009), but held up over 2020 at 0.6% yoy (Graph A, right-hand panel, blue line). Similarly, dollar loan growth to EMDEs dipped (–1% yoy), a smaller contraction than during the GFC (–15% yoy at its worst) (Graph B, left-hand panel). The GFC was primarily a financial crisis centred on banks, which scaled back their lending. By contrast, banks could be more supportive in 2020 when the pandemic afflicted the real economy, after the post-GFC regulatory reforms had strengthened their financial condition.
Debt securities issuance in US dollars continued to be the main driver of dollar credit outside the United States (Graph A, right-hand panel, yellow line). By end-2020, debt securities outstanding had grown by 9% yoy, similar to the average pace over the past decade (+8% yoy), and considerably higher than the 1% growth in bank loans. Likewise for EMDEs, continued issuance during the pandemic raised bond funding by 12% by end-2020, extending the average growth rate over the past decade. As a result, the share of debt securities in total dollar credit to non-US residents overall, and to EMDEs in particular, has increased by about 15 percentage points since the GFC (Annex Graph C.4 and Graph B, right-hand panel).
In addition to these indicators, the BIS GLIs show data on banks' total and international claims. For more details, see the GLI methodology and tables E1 and E2.