BIS international banking statistics and global liquidity indicators at end-December 2020
Key takeaways
- Cross-border claims increased in Q4 2020 by $431 billion, up 6% year on year. Dollar claims rose by $418 billion during the quarter, whereas euro- and yen-denominated claims declined.
- Cross-border claims on advanced economies overall grew in Q4, but those on the euro area and Japan contracted. Claims on emerging market and developing economies expanded, but with dispersion across countries.
- Banks' balance sheets expanded noticeably in 2020, with increased credit to the official sector on the assets side and greater deposits from households and non-financial corporates on the liabilities side.
- Foreign currency credit growth, an indicator of global liquidity, held up in 2020. Issuance of debt securities, rather than loans, continued to be the main driver of dollar credit outside the United States.
Cross-border claims on advanced economies rise
The BIS locational banking statistics (LBS) for Q4 2020 show that banks' cross-border claims expanded by $431 billion (+6% year-on-year (yoy)) on an FX- and break-adjusted basis (Graph 1, left-hand panel). This brought the outstanding stock to $35.6 trillion at end-2020.1 Claims denominated in US dollars grew by $418 billion, while euro and Japanese yen claims fell by $66 and $75 billion, respectively (Annex Graph A.1).
The Q4 rise in cross-border claims was concentrated on borrowers resident in a number of advanced economies (AEs), especially Canada (+20% yoy), the United Kingdom (+13% yoy) and the United States (+11% yoy). At the same time, claims on the euro area and Japan declined during the quarter, by almost $80 billion in both cases. Overall, the yoy growth in cross-border claims on most major AEs remained positive (Annex Graphs A.2/A.3).
Cross-border claims on offshore centres edged up in Q4 (+$16 billion; +0.6% yoy), but the aggregate concealed large offsetting movements vis-à-vis particular centres. While claims on the Cayman Islands declined by $60 billion, those on Asian offshore centres – notably Hong Kong SAR and Singapore – rose by $36 and $43 billion respectively (Annex Graph A.3).
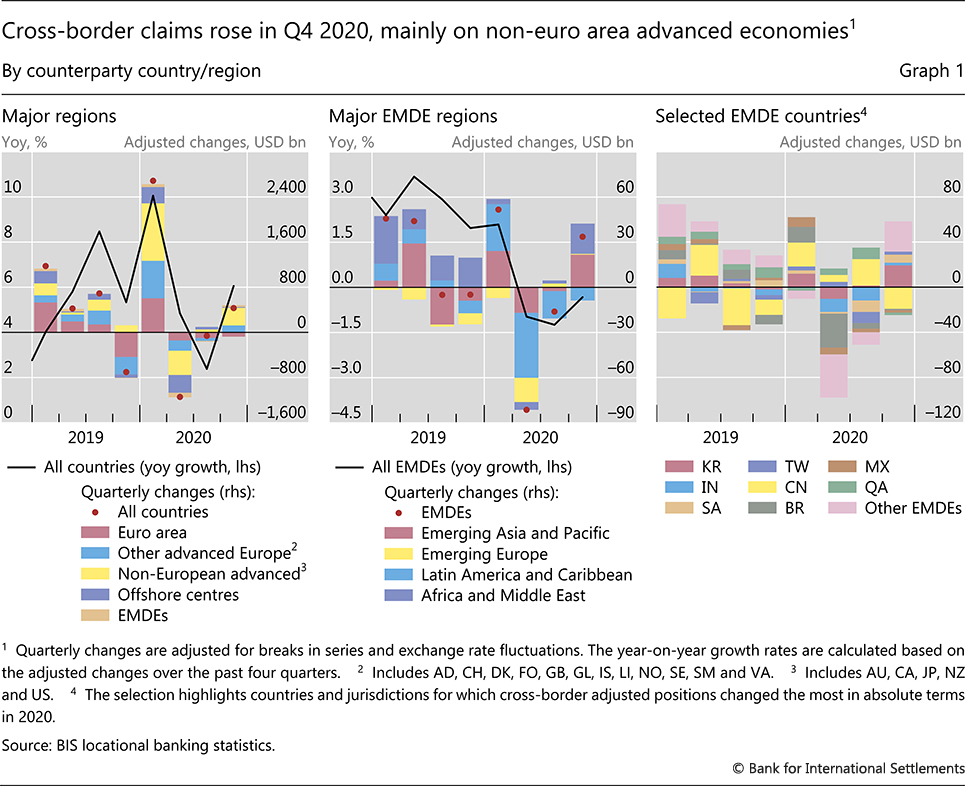
Cross-border claims on emerging market and developing economies (EMDEs) returned to positive growth in Q4 with a $34 billion increase, after two quarters of decline (Graph 1, centre panel). The yoy rate of contraction was thus a moderate –0.3% (black line). Claims on emerging Asia and Pacific rose the most (+$22 billion; +1% yoy). Claims on Africa and the Middle East closely followed, expanding by $20 billion, the largest quarterly increase in 2020. The region's yoy growth rate of 2% was also the highest among all EMDE regions (Annex Graph A.2). Claims on emerging Europe dipped (–4% yoy), while those on Latin America and Caribbean continued to fall (–6% yoy).2 Claims on EMDEs were more volatile in 2020 than in previous years, with a jump in Q1 followed by contractions in Q2 and Q3. There was considerable dispersion across EMDEs in Q4, with expansions in cross-border claims on Korea (+$19 billion) and Saudi Arabia (+$7 billion) and a contraction in claims on China (–$19 billion, after an increase of $23 billion in Q3)3 (right-hand panel).
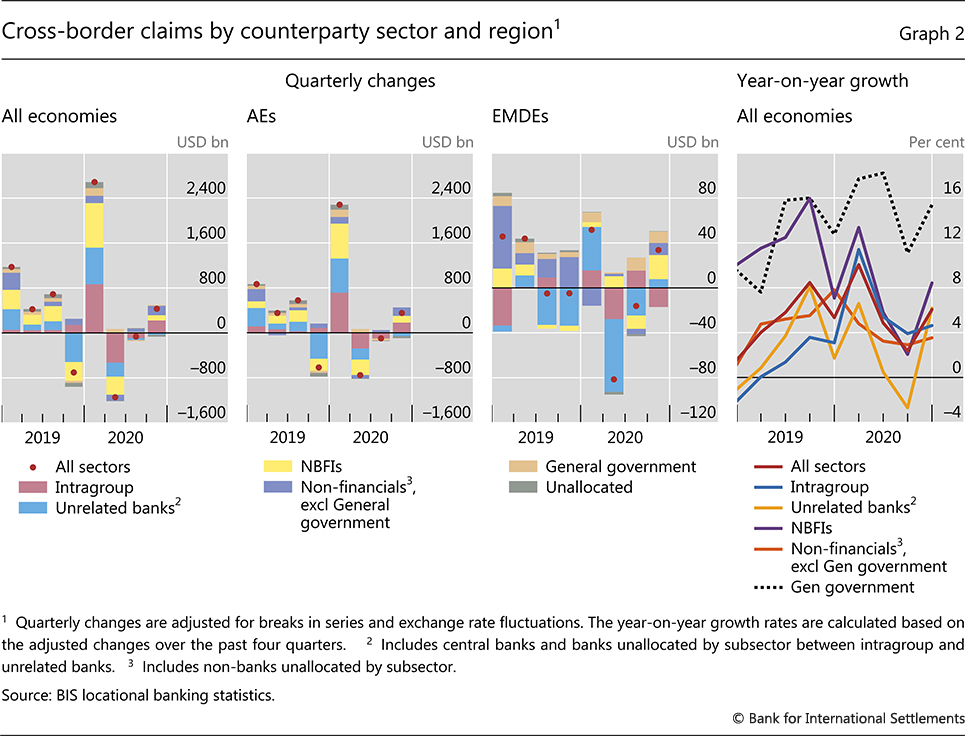
Banks' intragroup positions contributed the most to the increase in cross-border claims observed in Q4 ($224 billion), and were centred on AEs ($183 billion) (Graph 2, first and second panels).4 At the same time, intragroup claims on EMDEs declined by $17 billion (third panel).5 For their part, lending to non-financial borrowers (excluding the general government sector) in all countries increased by 4% yoy (fourth panel), adding $166 billion to the Q4 expansion. Claims on the government sector contributed an additional $17 billion, for a 15% yoy growth rate (see next section).
Policy response shores up bank deposits
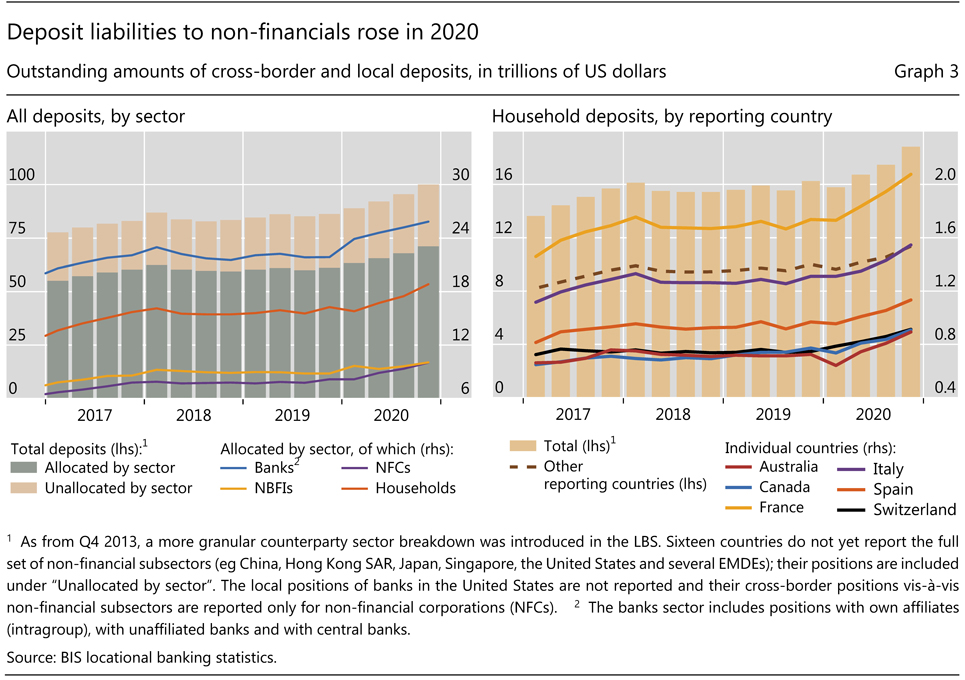
The LBS, which track banks' local and cross-border deposit liabilities, show that banks' total deposit liabilities surged from $86 trillion at end-2019 to $100 trillion at end-2020 (Graph 3, left-hand panel).6 This development, observed across many economies, took place in the context of accommodative policy responses to alleviate the negative effects of the pandemic.
Total deposits from non-financials7 – mainly households and non-financial companies (NFCs) – grew most consistently in 2020. Deposits by NFCs reached $10 trillion, up 23% (unadjusted) from end-2019. And those by households also grew strongly (+16% yoy, unadjusted) to reach $19 trillion. Of the 33 BIS reporting countries that break out household deposits, 25 recorded double-digit annual growth rates in Q4 2020. Some countries, including Australia, France and Switzerland, reported yoy increases of around 20% (unadjusted) (right-hand panel).
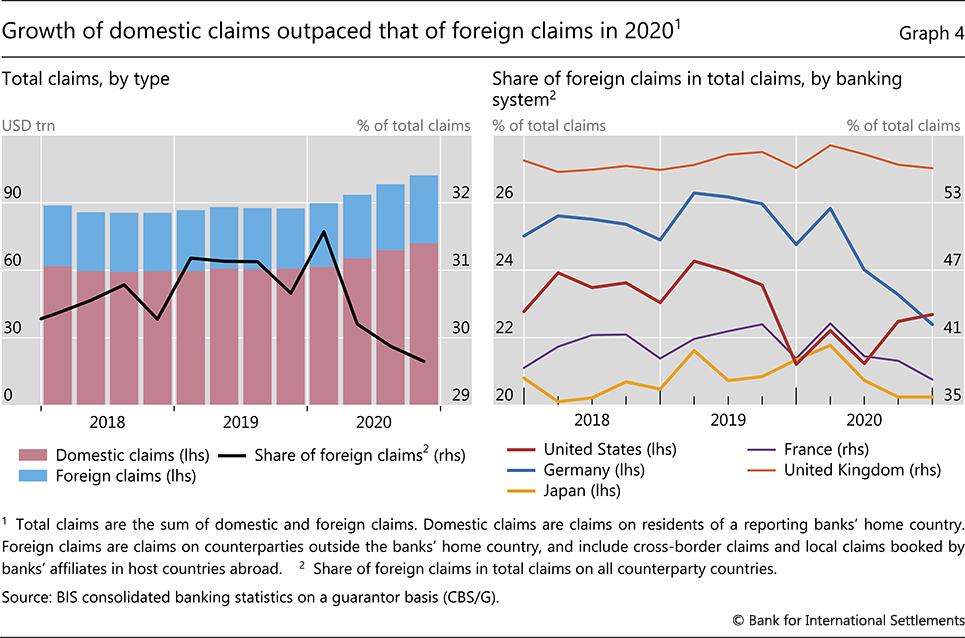
The counterpart to these deposits on the asset side of banks' balance sheets mainly consisted of domestic claims, ie increased credit to residents of the reporting banks' home country. The BIS consolidated banking statistics (CBS), which track the globally consolidated positions of banks headquartered in a given country (net of intragroup positions), show that banks' total claims grew by $15 trillion in aggregate in 2020, with $12 trillion of that increase occurring since end-Q1 2020. Three quarters of the rise in 2020 was booked against borrowers in their home country (Graph 4, left-hand panel). As a result, the share of foreign claims in total claims fell noticeably in 2020, a pattern observed across several banking systems (Graph 4, right-hand panel).8 Bond markets also reflected the expansion in domestic borrowing, mainly as a result of government bond issuance (see Box on global liquidity indicators).
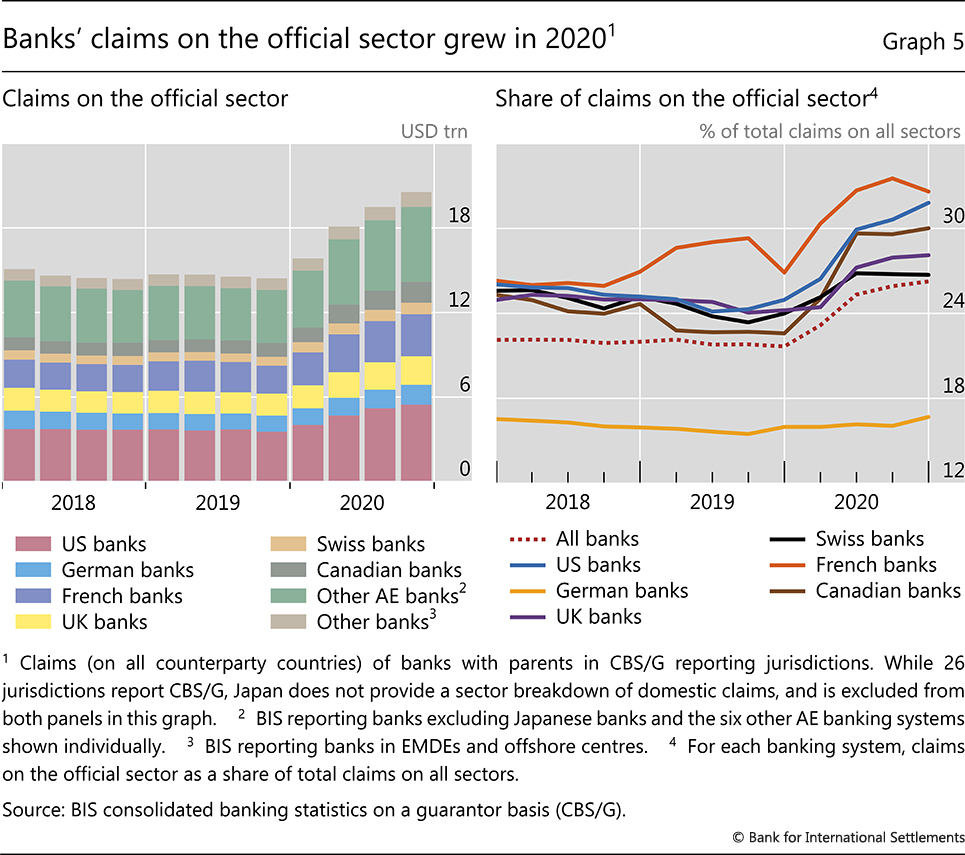
The rise in banks' assets was mainly concentrated in claims on the official sector, comprising governments and central banks (Graph 5, left-hand panel).9 Global banks' claims on this sector – mainly in the form of holdings of government bonds and reserves at central banks – stood at $21 trillion at end-Q4 2020, up from $14 trillion a year before, a substantial increase of 42% in unadjusted stocks.10 Over that period, the share of claims on the official sector in total claims reported by BIS-reporting banks (excluding Japanese banks) rose by almost 5 percentage points to reach 26% at end-2020 (right-hand panel). Canadian and US banks' shares rose by roughly 7 percentage points, while all other banks' shares rose by an average of 4 percentage points.
1 The outstanding stock of claims jumped by $1.3 trillion in Q3 2020 due to a break in series reported by France, which started reporting derivatives positions on a gross rather than net basis, in line with the IBS reporting guidelines.
2 One quarter of the claims on Latin America and Caribbean were held by banks in the United States who cut their lending by 11% yoy.
3 The $19 billion contraction in claims on China in the LBS was mainly the result of reduced intragroup positions. The BIS consolidated statistics, which track banks' worldwide consolidated claims excluding intragroup positions, show a relatively robust expansion in banks' international claims on China (international claims include cross-border claims in all currencies and foreign currency claims booked by banks' local affiliates located in China). See Annex Graph B.2.
4 Intragroup claims on the United Kingdom swelled by $170 billion, with $157 billion booked by US and Canadian banks, and UK banks themselves accounting for $50 billion. Meanwhile, intragroup claims on Japan dropped by almost $150 billion, led by French, German and US banks.
5 Intragroup claims on China and Brazil fell by $18.6 billion and $5.2 billion respectively, while they increased on Korea and Poland by $8.5 billion and $2.3 billion respectively.
6 As from Q4 2013, a more granular counterparty sector breakdown was introduced in the LBS. Reporting jurisdictions are required to separately report positions vis-à-vis banks, non-bank financials and non-financials, and, for the latter, are encouraged to separately report positions vis-à-vis households, non-financial corporates (NFCs) and governments. While 32 of 48 jurisdictions currently report most non-financial subsectors, several do not, most importantly China, Finland, Hong Kong SAR, Japan, Singapore, the United States (reports only NFCs) and several EMDEs.
7 The non-financial sector includes the general government, non-financial corporations and households (including non-profit institutions serving households).
8 Foreign claims are claims on residents of countries other than the country where the controlling parent is located. They comprise local claims of the bank's offices abroad as well as cross-border claims of the bank's offices worldwide.
9 Note that, in the CBS, the official sector includes the central bank, and thus differs from the general government sector in the System of National Accounts.
10 These figures do not include Japanese banks' claims on the official sector because Japan does not report domestic claims on the official sector.