Annual Economic Report 2019 - Statistics associated with the graphs
Download all statistics (zipped XLSX, 860 KB)
Graphs |
||
| Chapter I: data behind the graphs (xlsx) | ||
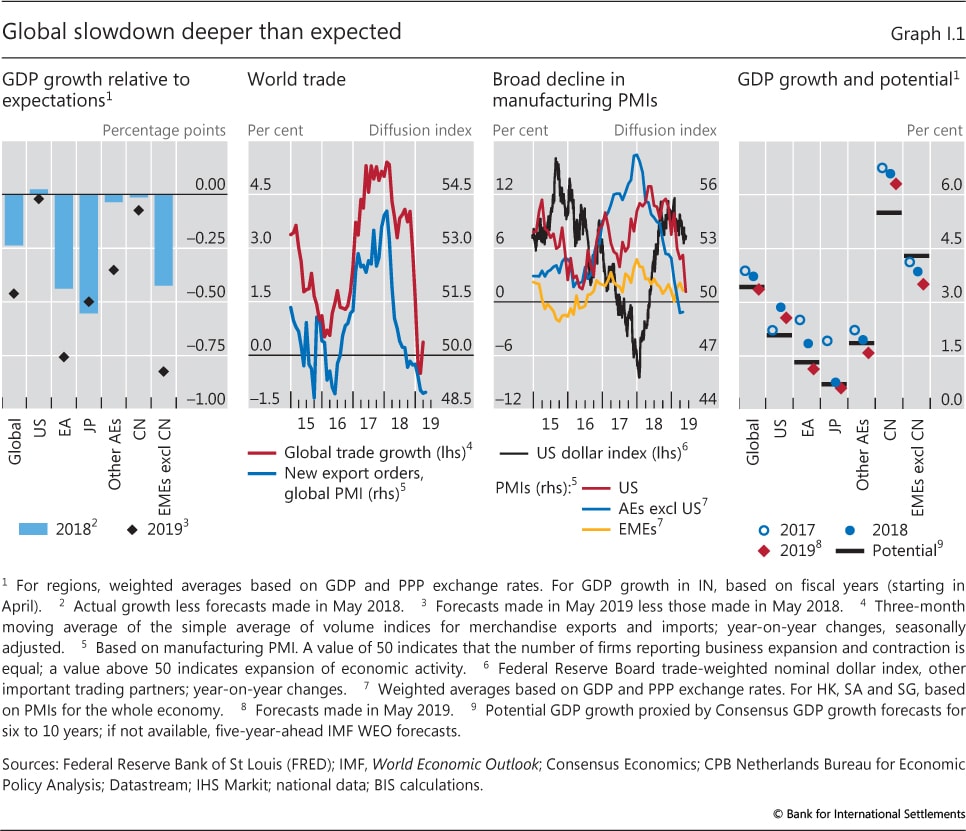
| I.1 | Global slowdown deeper than expected | p 3 |
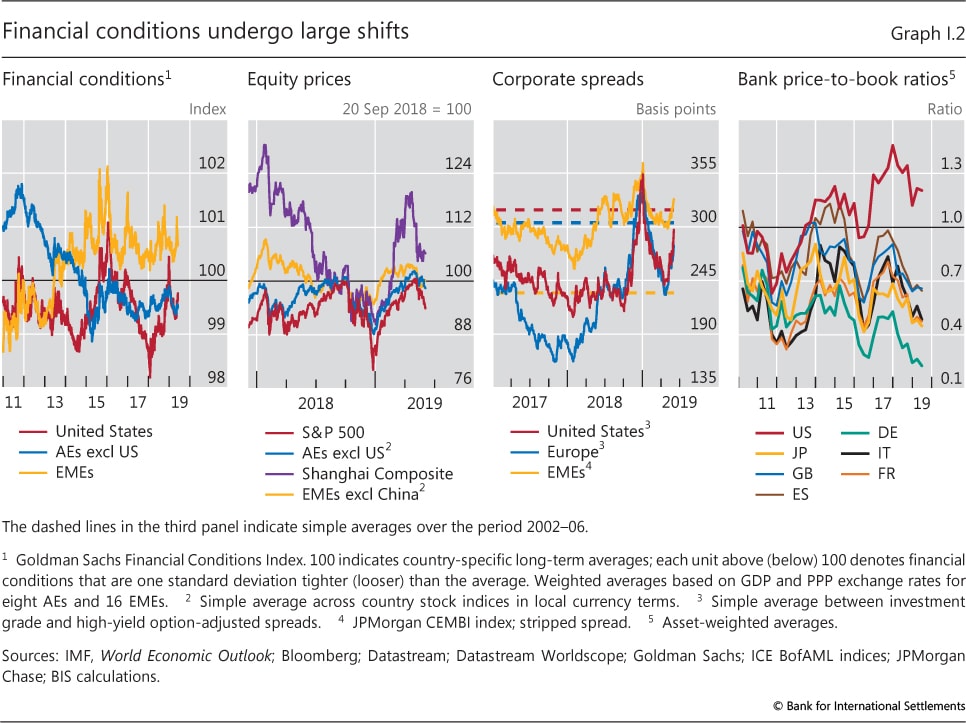
| I.2 | Financial conditions undergo large shifts | p 4 |
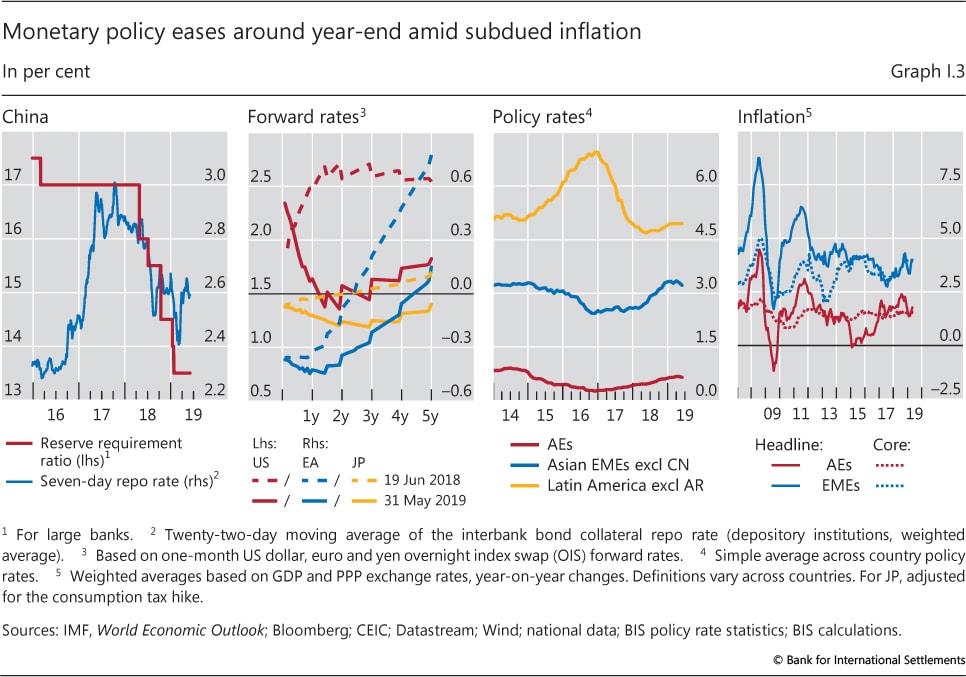
| I.3 | Monetary policy eases around year-end amid subdued inflation | p 5 |
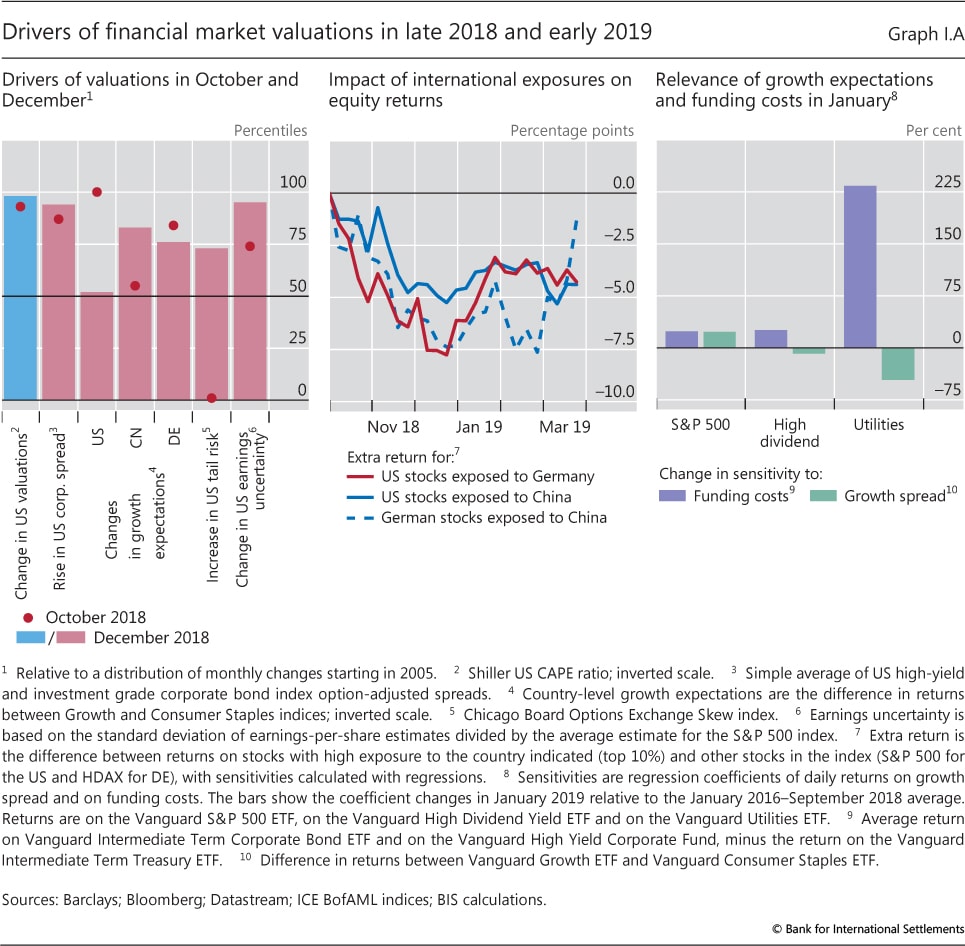
| I.A | Drivers of financial market valuations in late 2018 and early 2019 | p 6 |
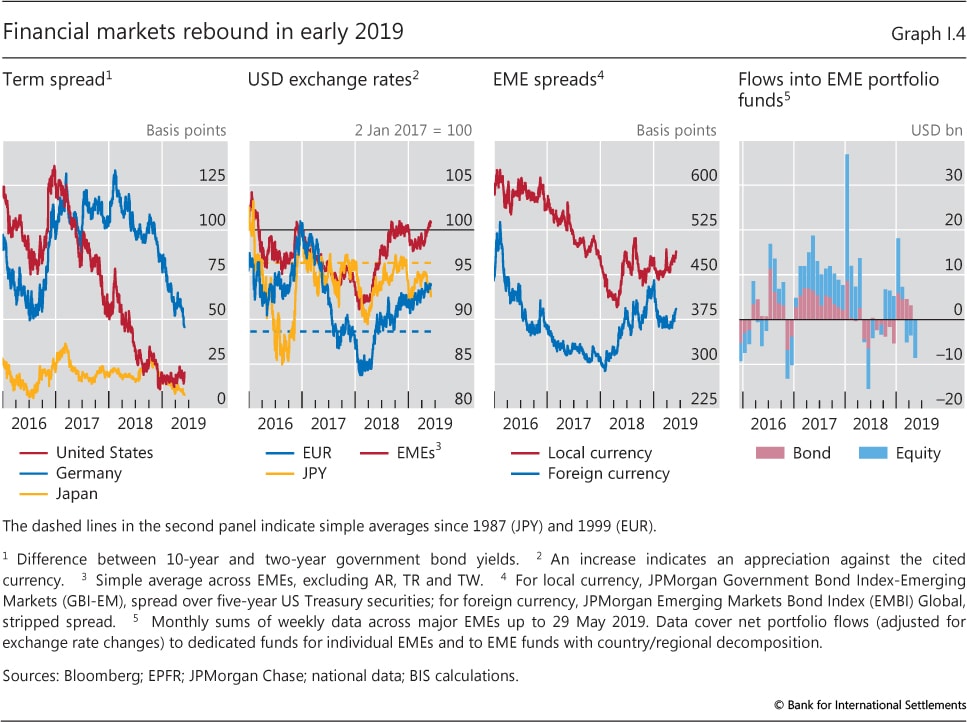
| I.4 | Financial markets rebound in early 2019 | p 8 |
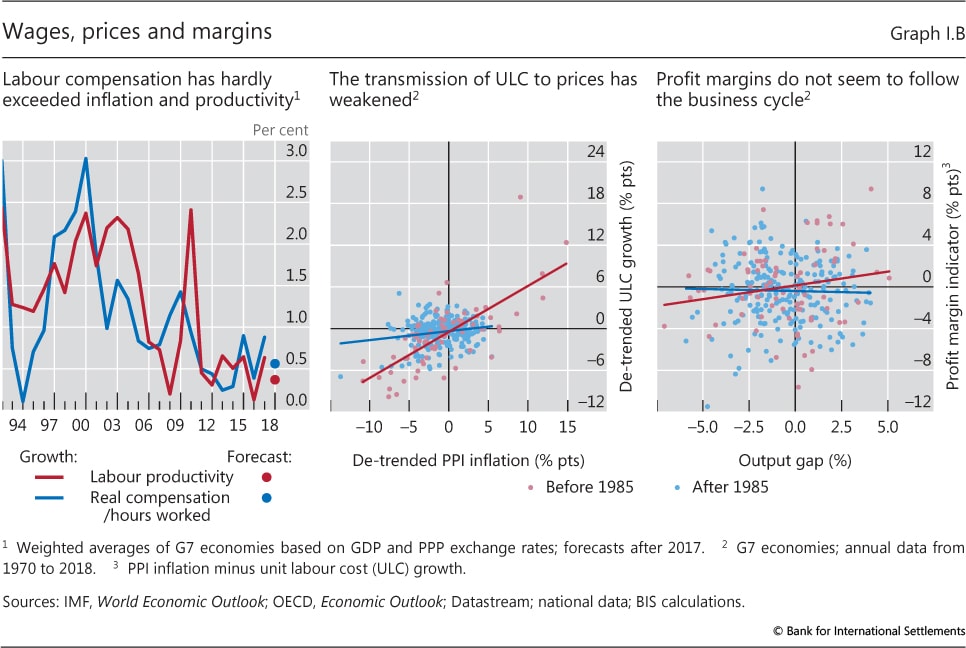
| I.B | Wages, prices and margins | p 9 |
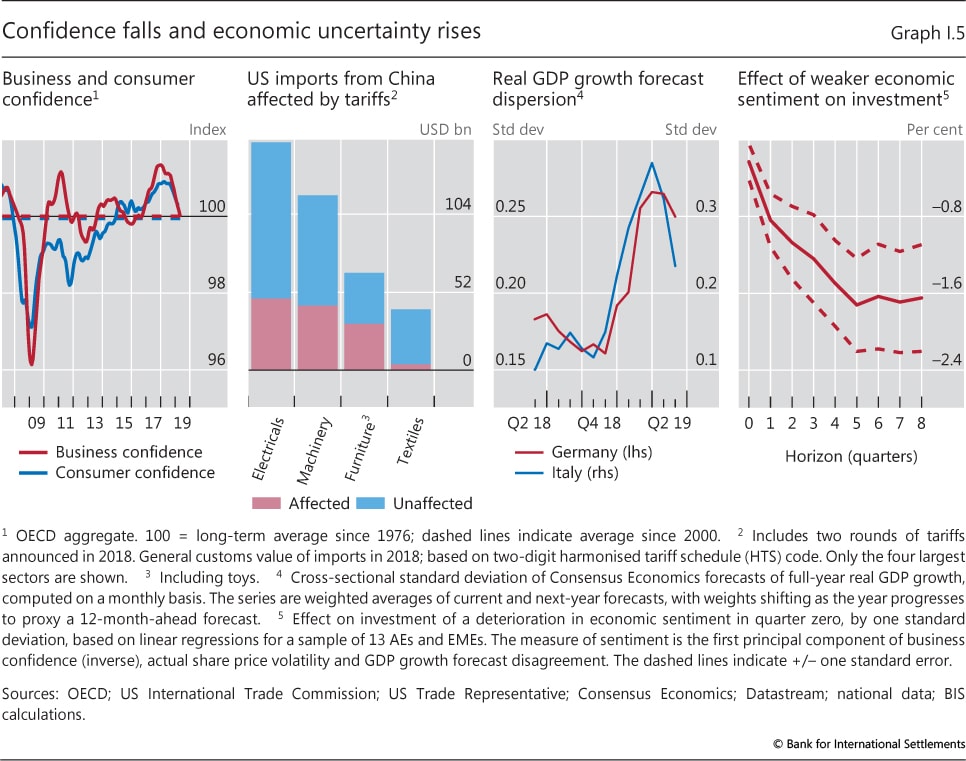
| I.5 | Confidence falls and economic uncertainty rises | p 11 |
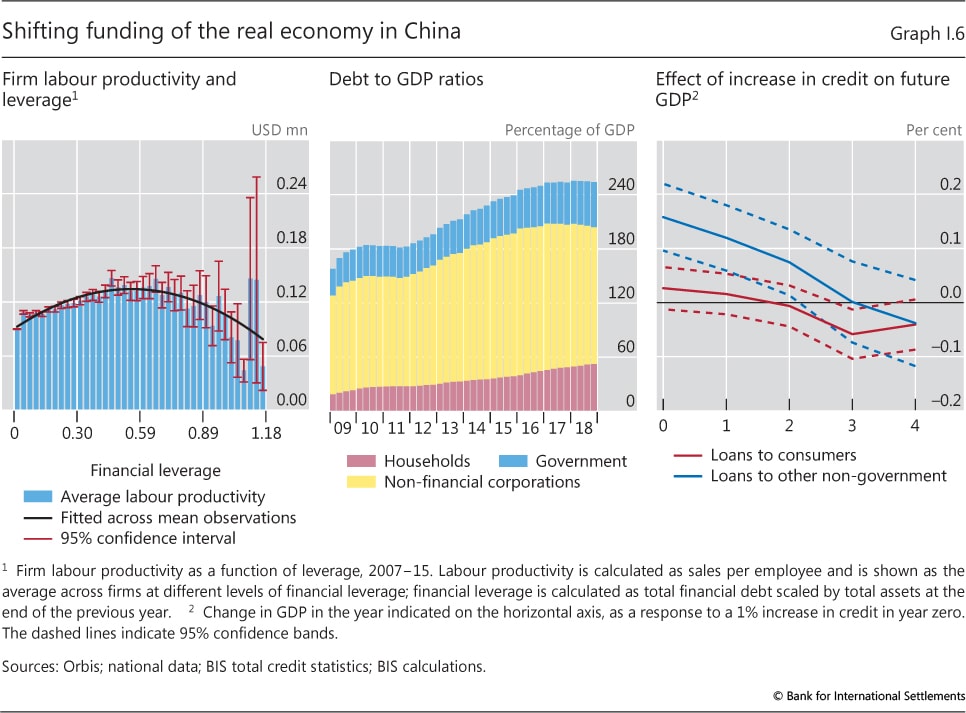
| I.6 | Shifting funding of the real economy in China | p 12 |
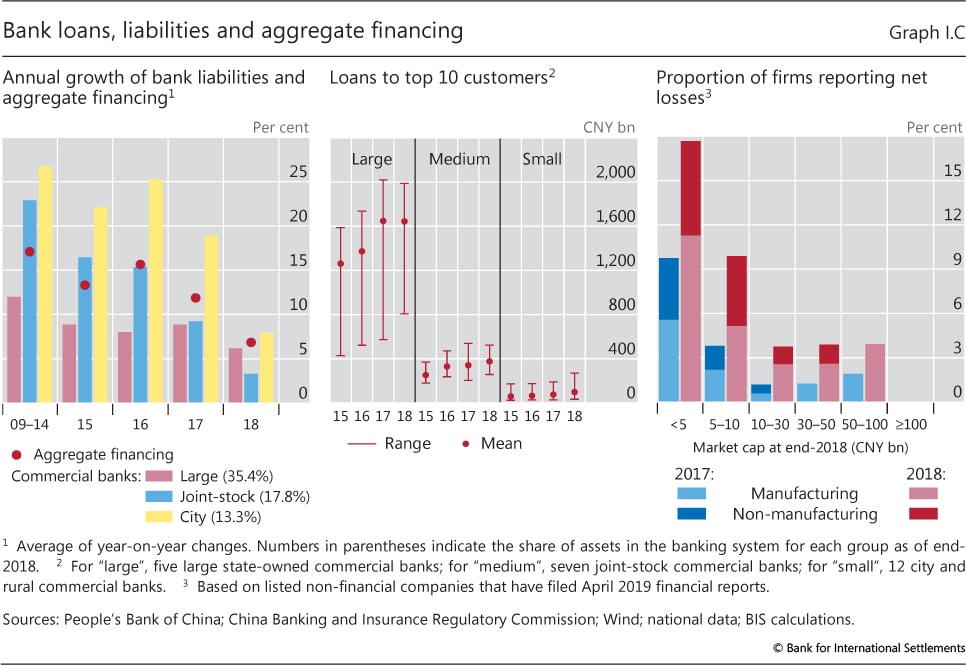
| I.C | Bank loans, liabilities and aggregate financing | p 13 |
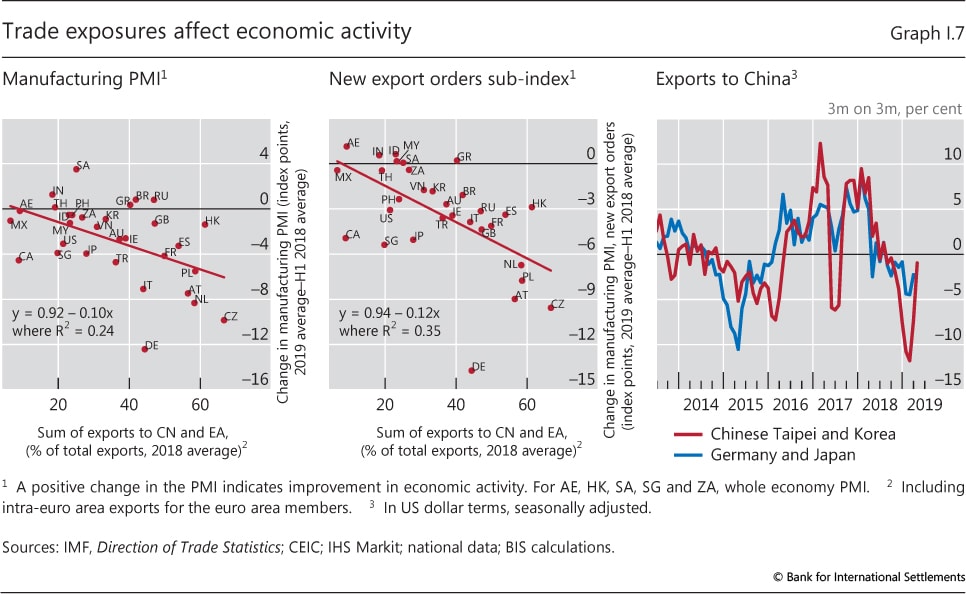
| I.7 | Trade exposures affect economic activity | p 14 |
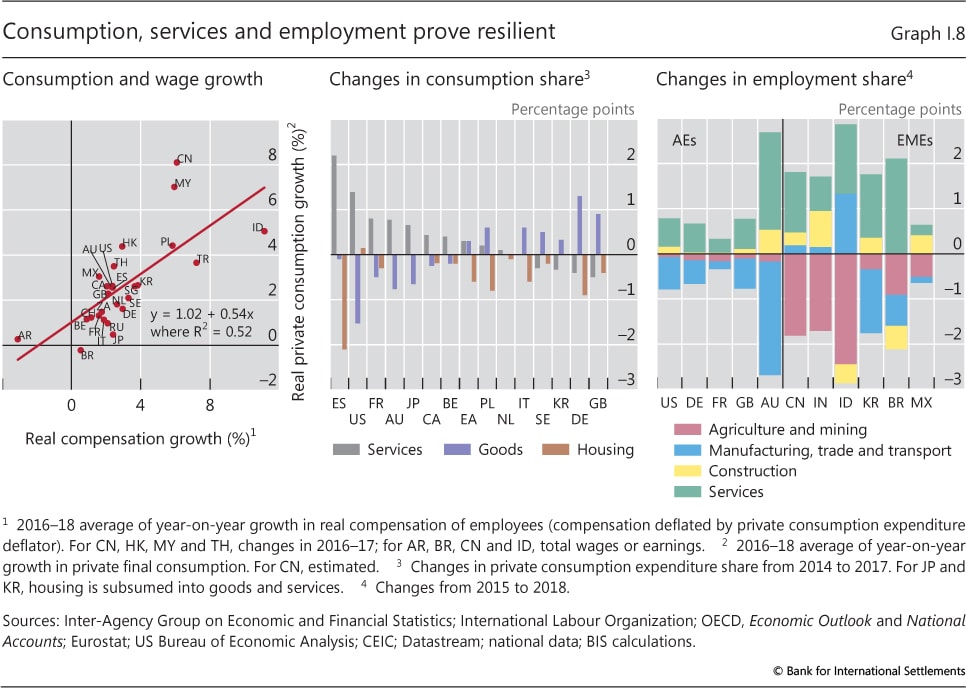
| I.8 | Consumption, services and employment prove resilient | p 15 |
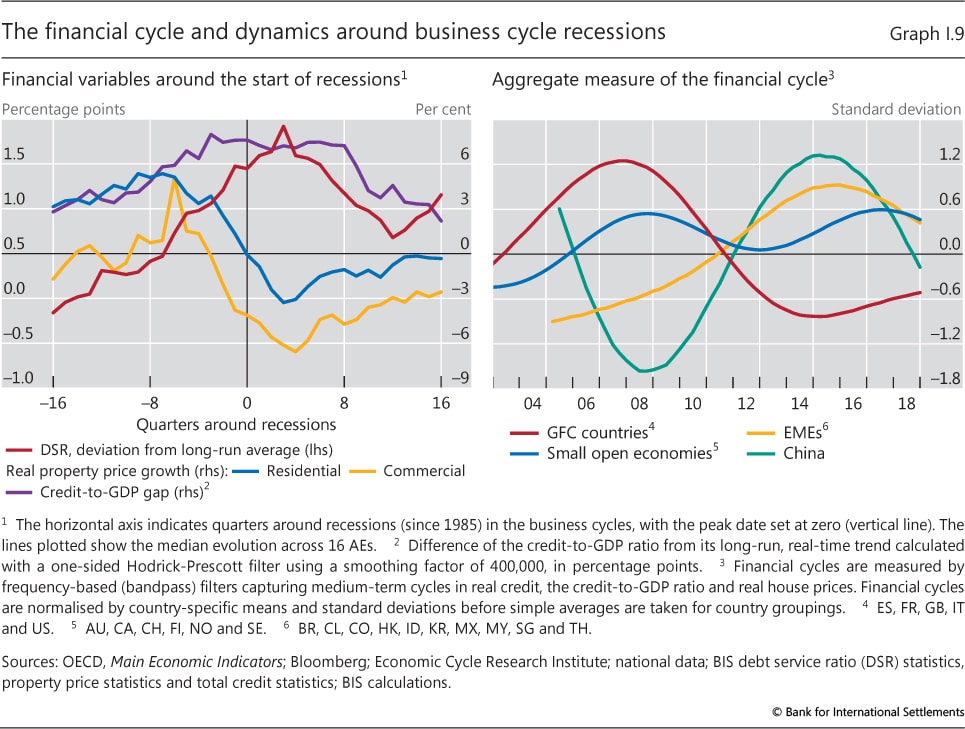
| I.9 | The financial cycle and dynamics around business cycle recessions | p 16 |
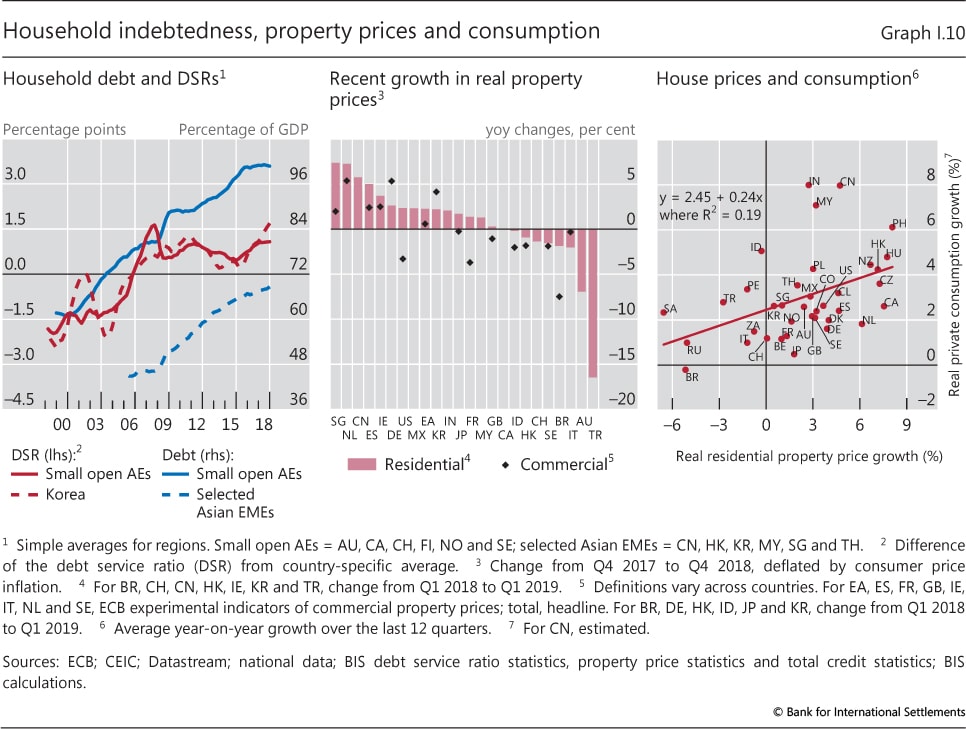
| I.10 | Household indebtedness, property prices and consumption | p 17 |
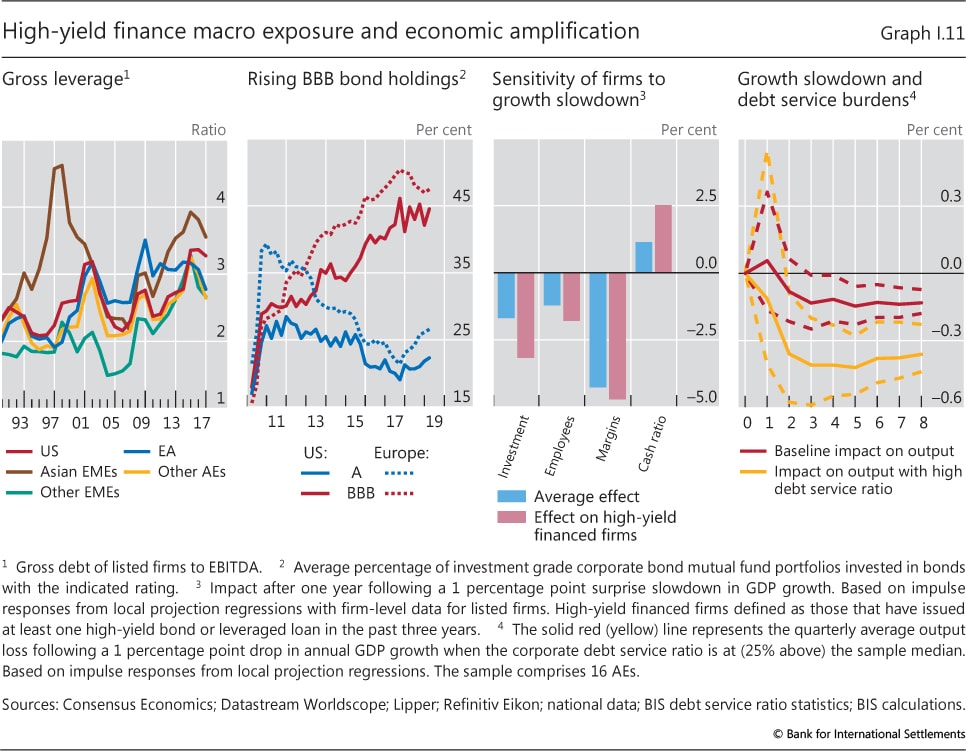
| I.11 | High-yield finance macro exposure and economic amplification | p 18 |
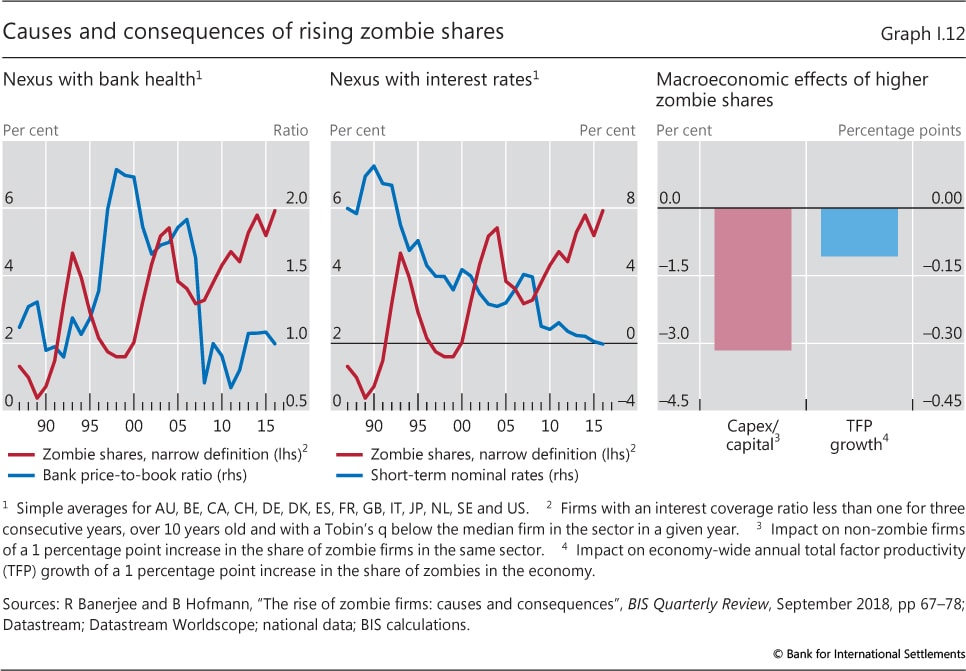
| I.12 | Causes and consequences of rising zombie shares | p 20 |
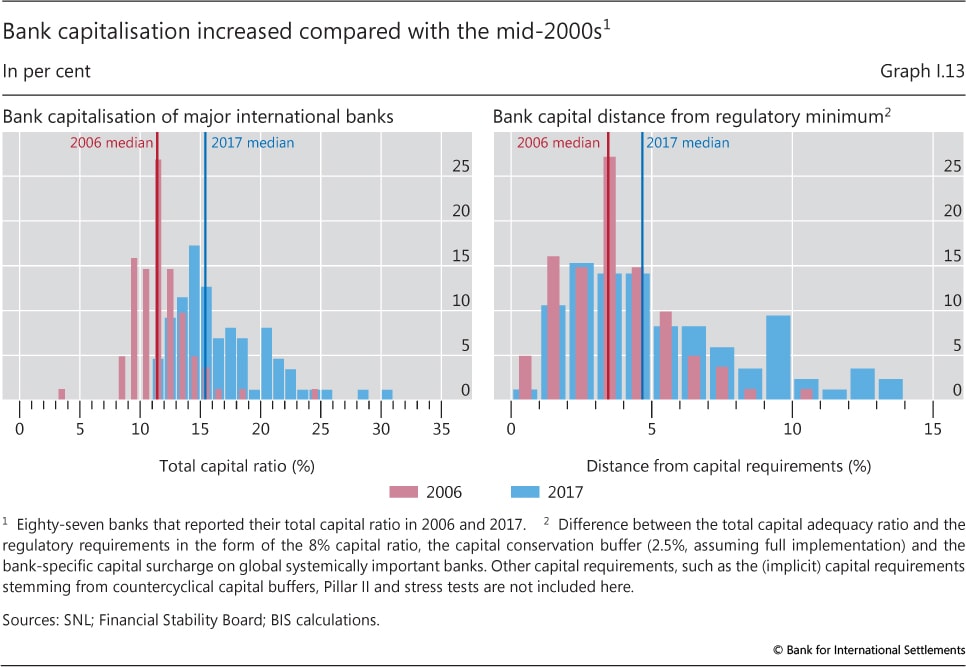
| I.13 | Bank capitalisation increased compared with the mid-2000s | p 21 |
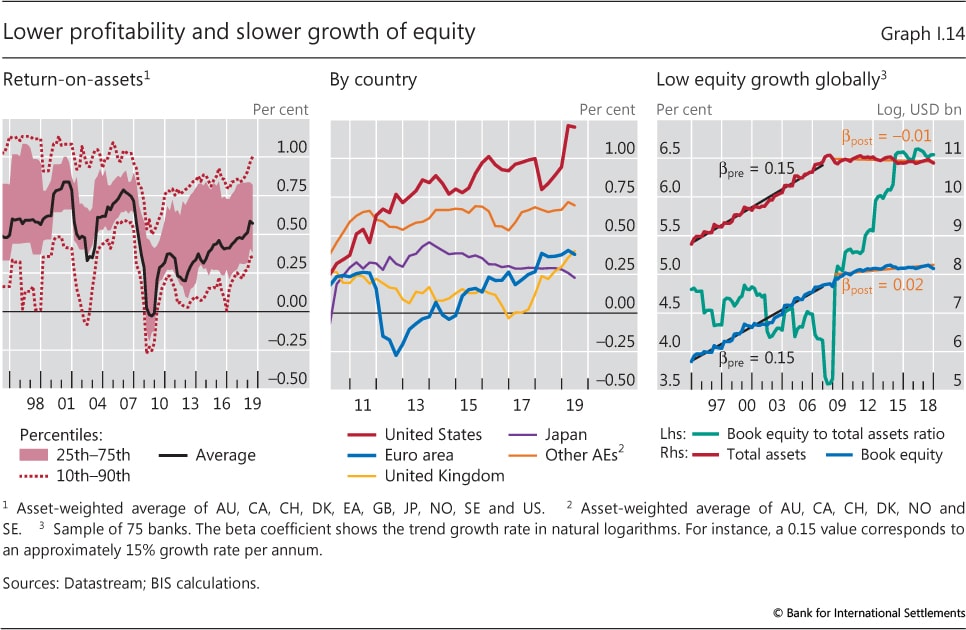
| I.14 | Lower profitability and slower growth of equity | p 22 |
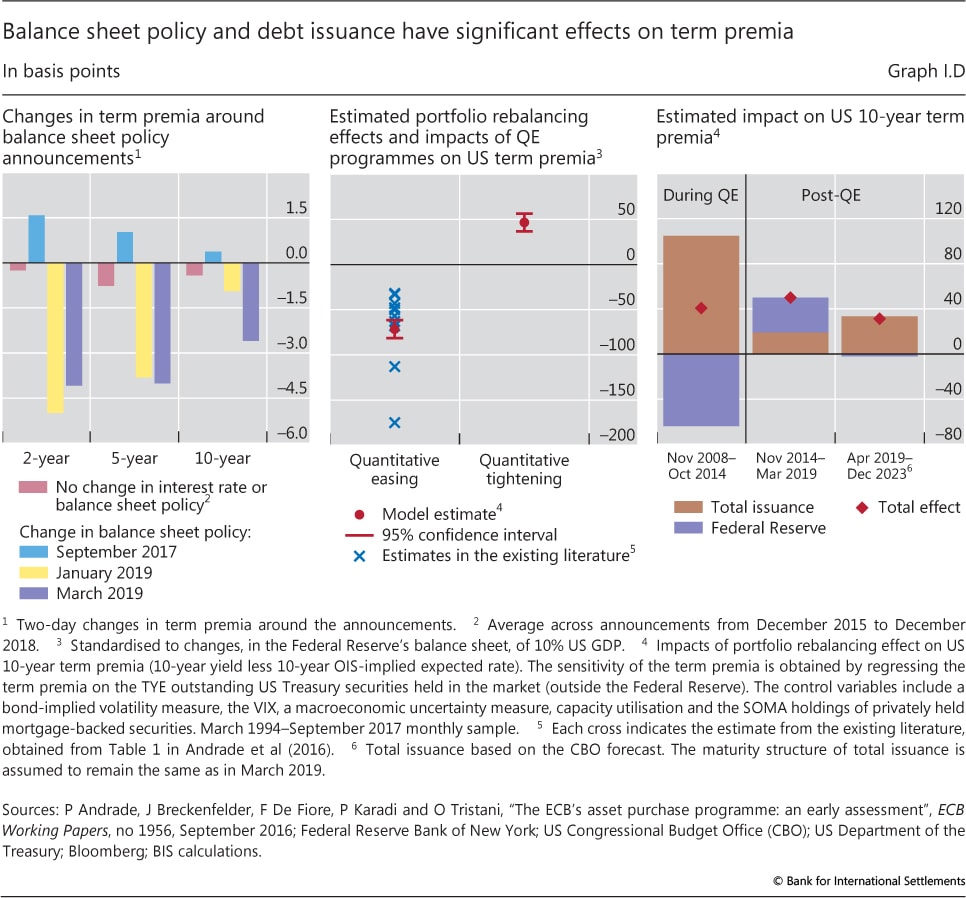
| I.D | Balance sheet policy and debt issuance have significant effects on term premia | p 25 |
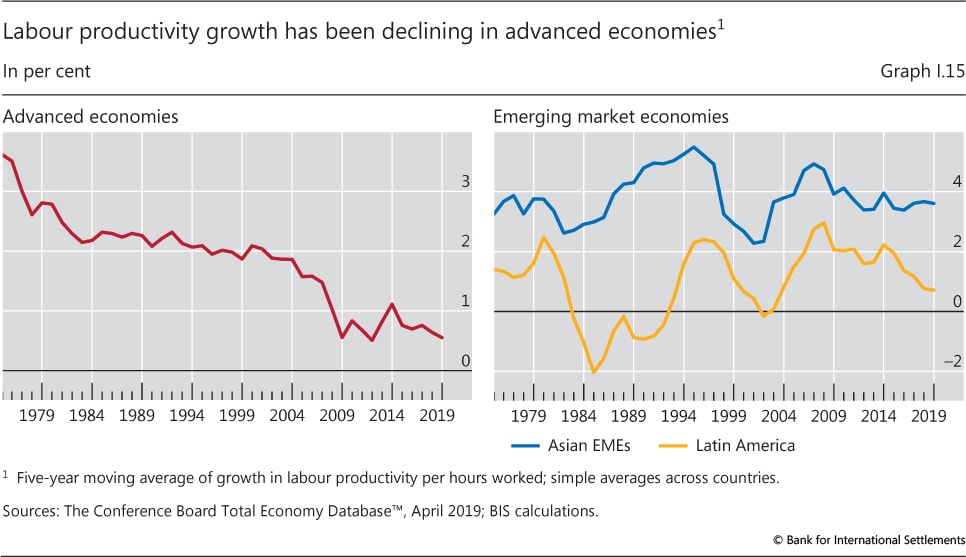
| I.15 | Labour productivity growth has been declining in advanced economies | p 27 |
| Chapter II: data behind the graphs (xlsx) | ||
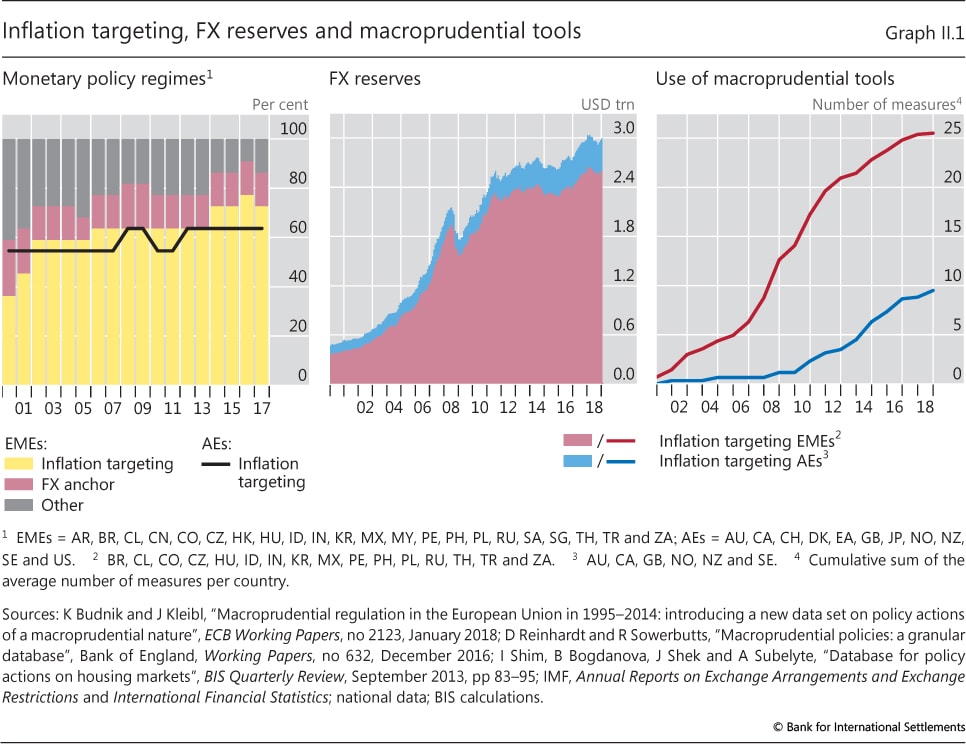
| II.1 | Inflation targeting, FX reserves and macroprudential tools | p 32 |
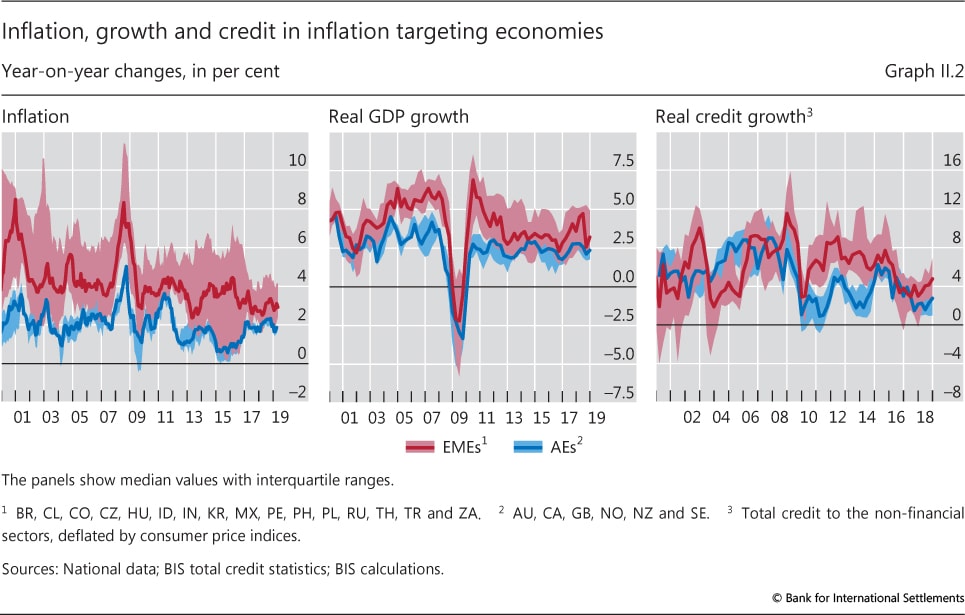
| II.2 | Inflation, growth and credit in inflation targeting economies | p 33 |
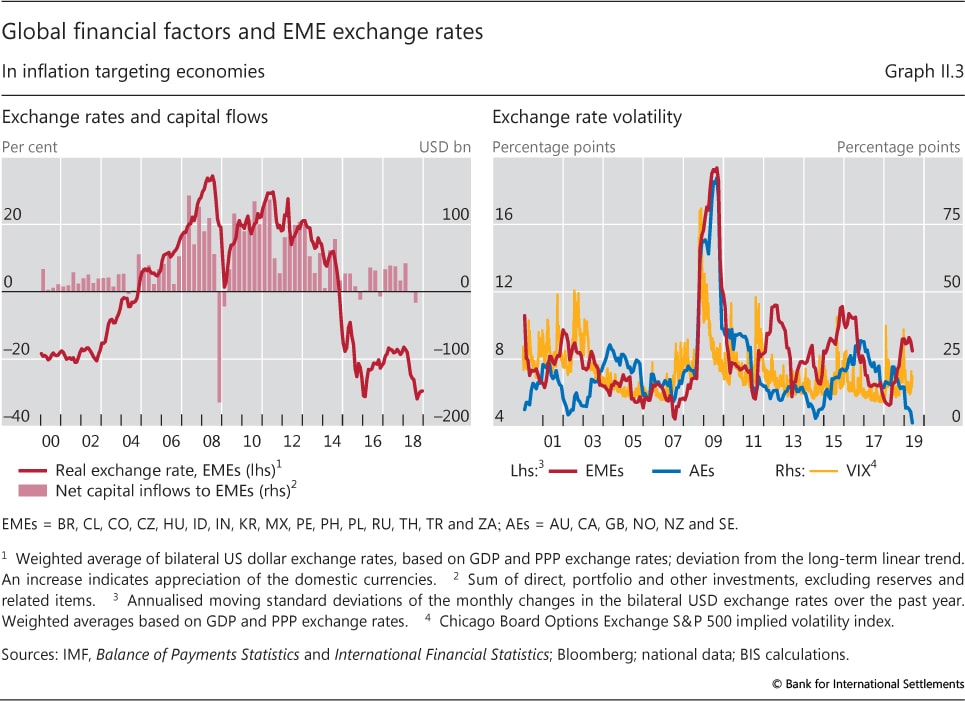
| II.3 | Global financial factors and EME exchange rates | p 34 |
| II.4 | Exchange rates have a larger impact on inflation in EMEs | p 35 |
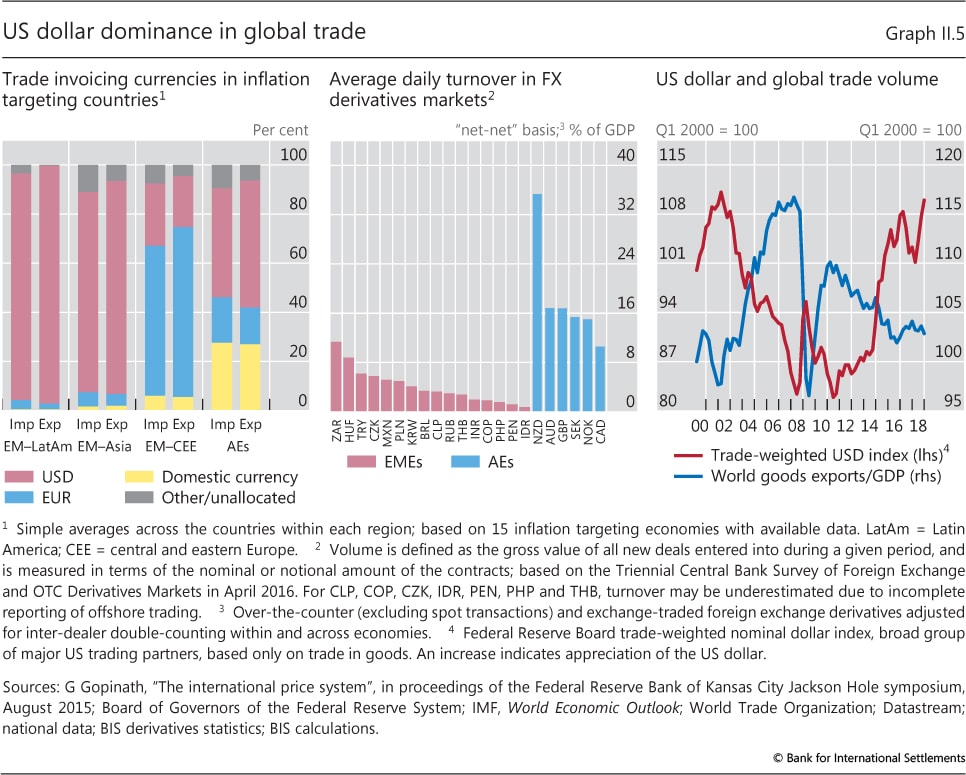
| II.5 | US dollar dominance in global trade | p 37 |
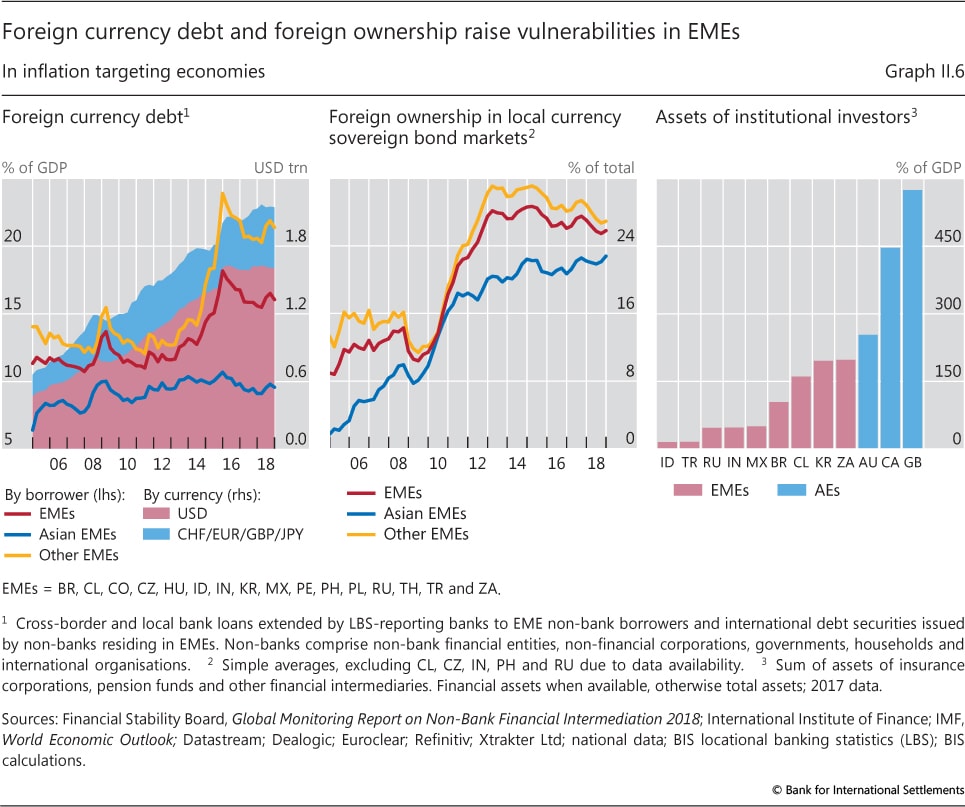
| II.6 | Foreign currency debt and foreign ownership raise vulnerabilities in EMEs | p 38 |
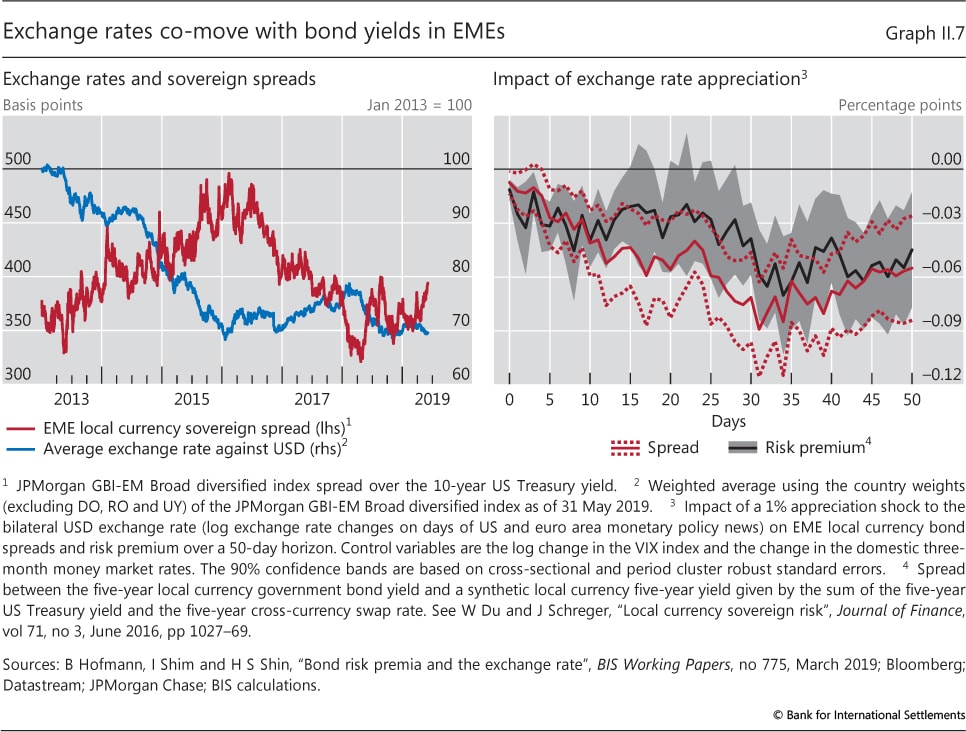
| II.7 | Exchange rates co-move with bond yields in EMEs | p 39 |
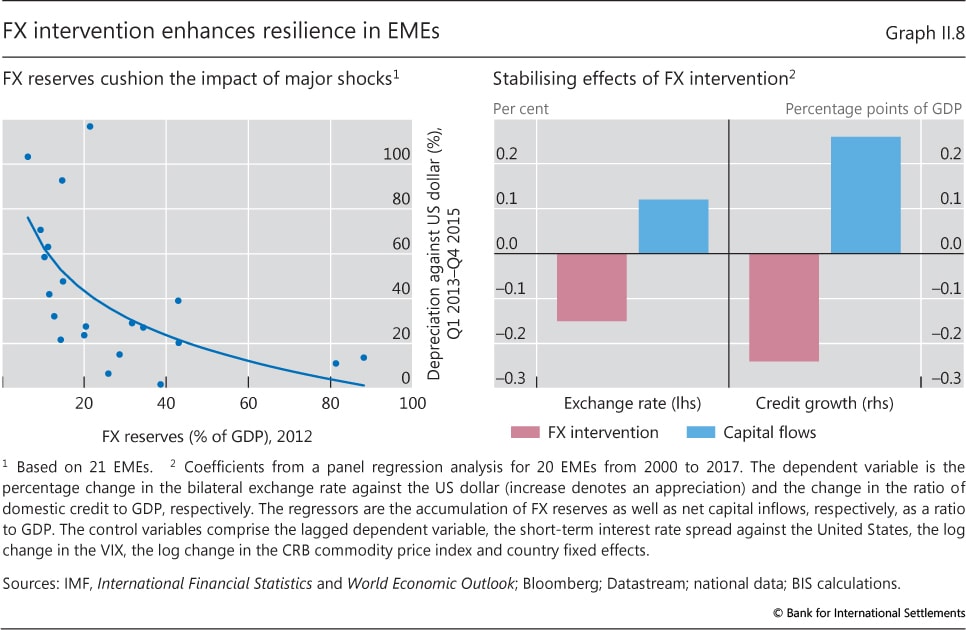
| II.8 | FX intervention enhances resilience in EMEs | p 41 |
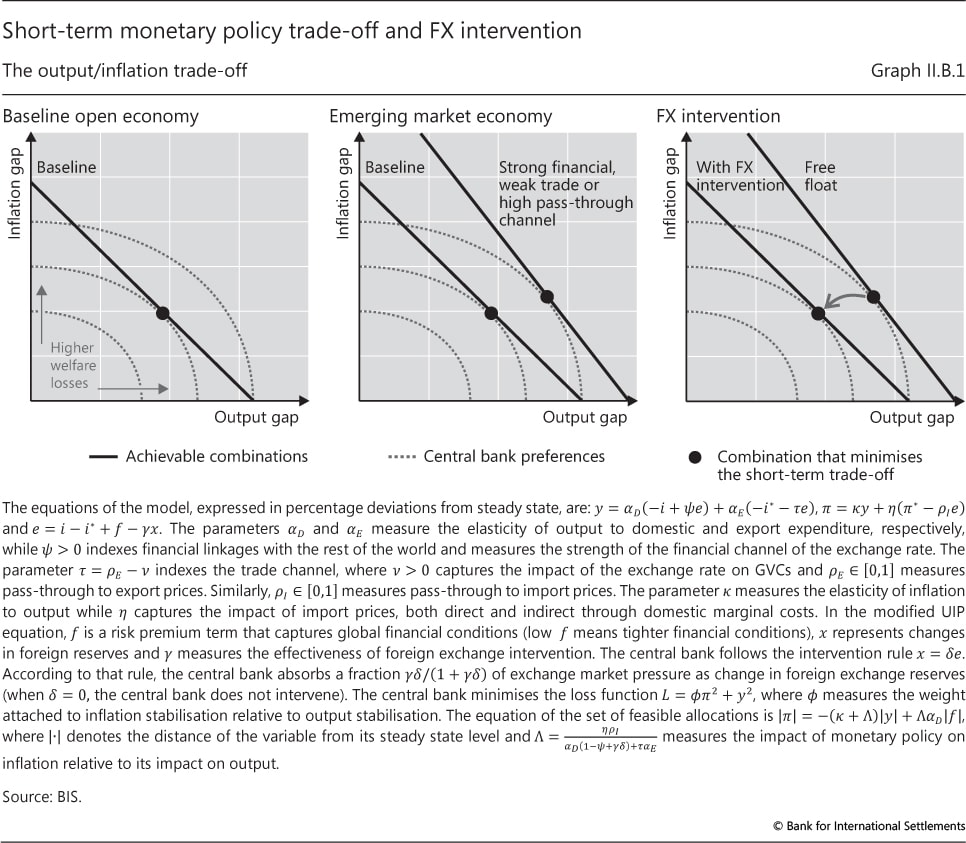
| II.B.1 | Short-term monetary policy trade-off and FX intervention | p 47 |
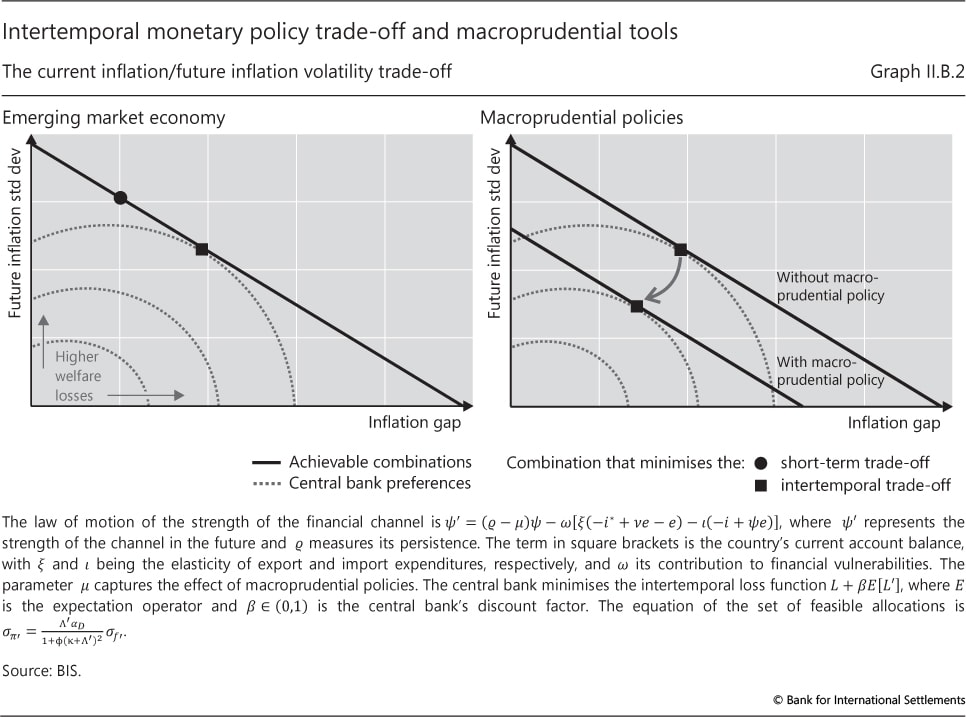
| II.B.2 | Intertemporal monetary policy trade-off and macroprudential tools | p 48 |
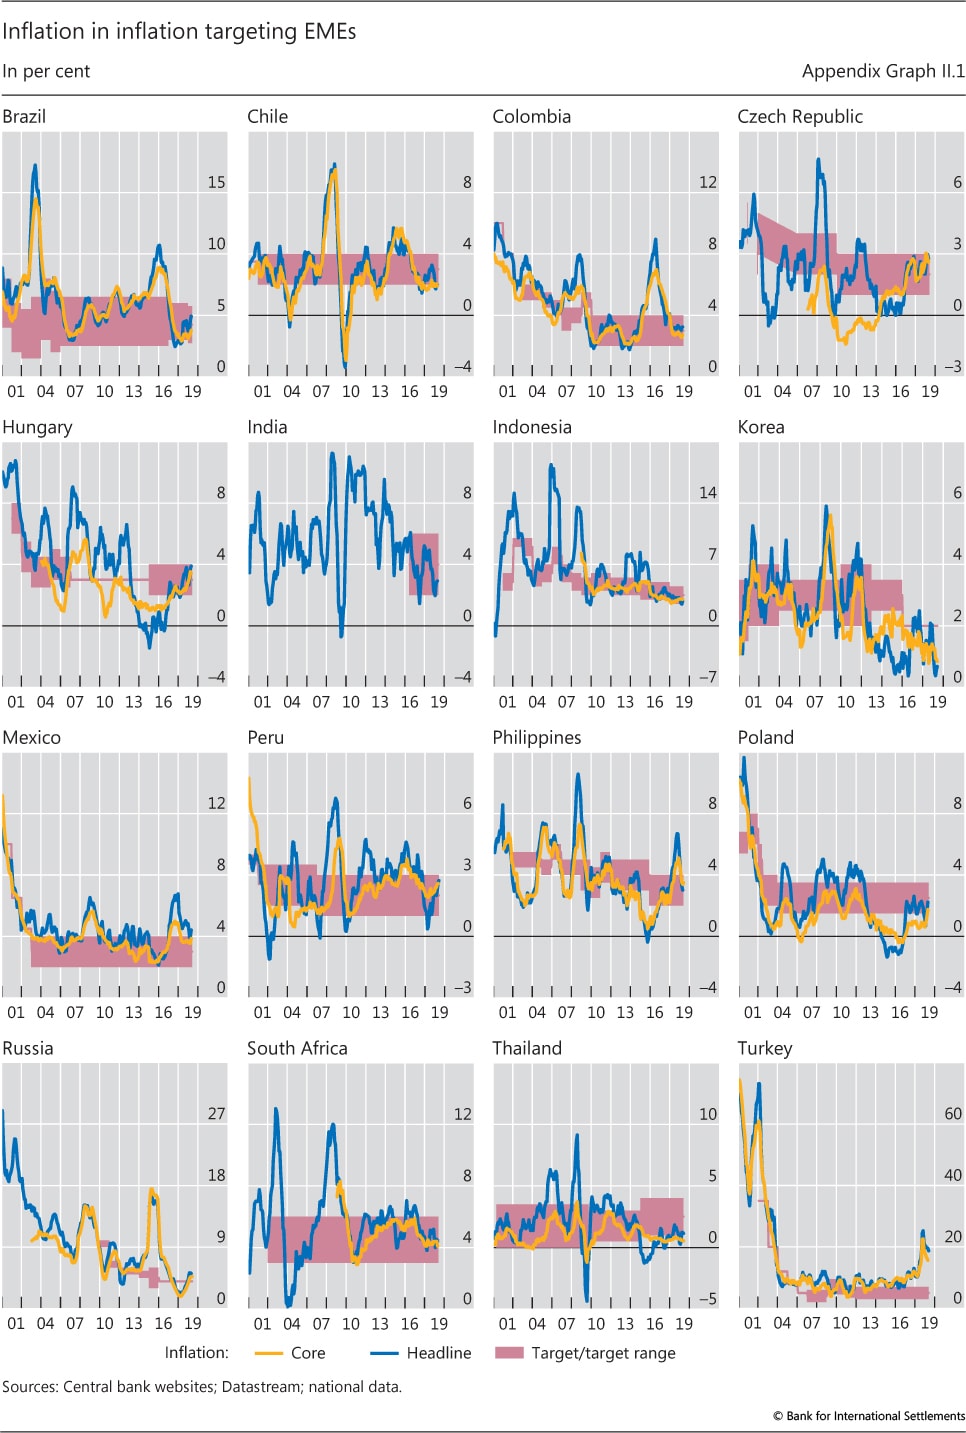
| II.Appendix | Inflation in inflation targeting EMEs | p 53 |
| Chapter III: data behind the graphs (xlsx) | ||
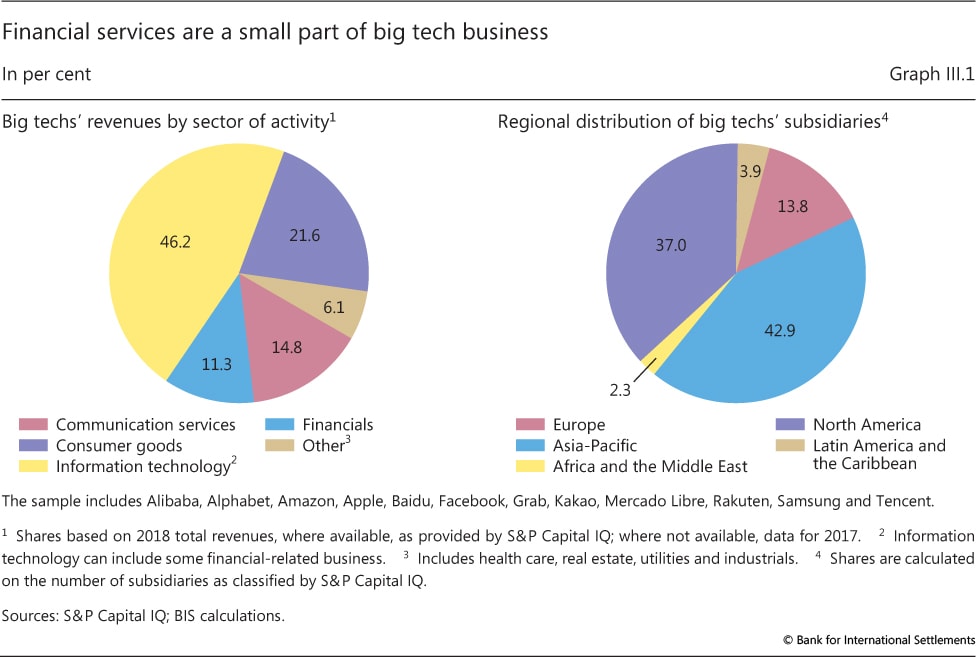
| III.1 | Financial services are a small part of big tech business | p 56 |
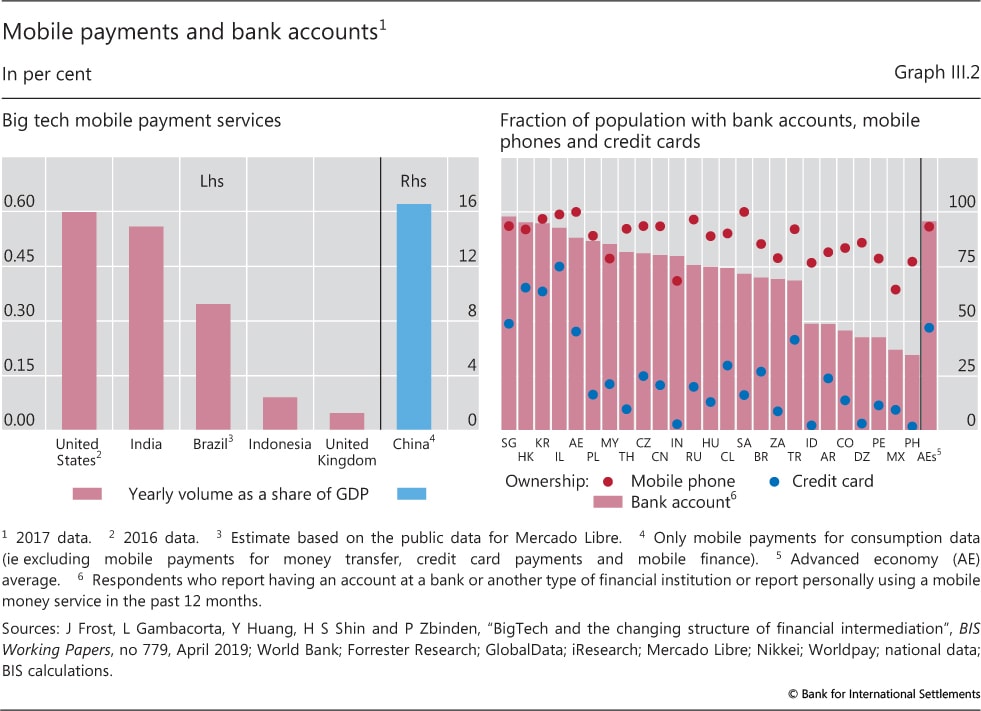
| III.2 | Mobile payments and bank accounts | p 58 |
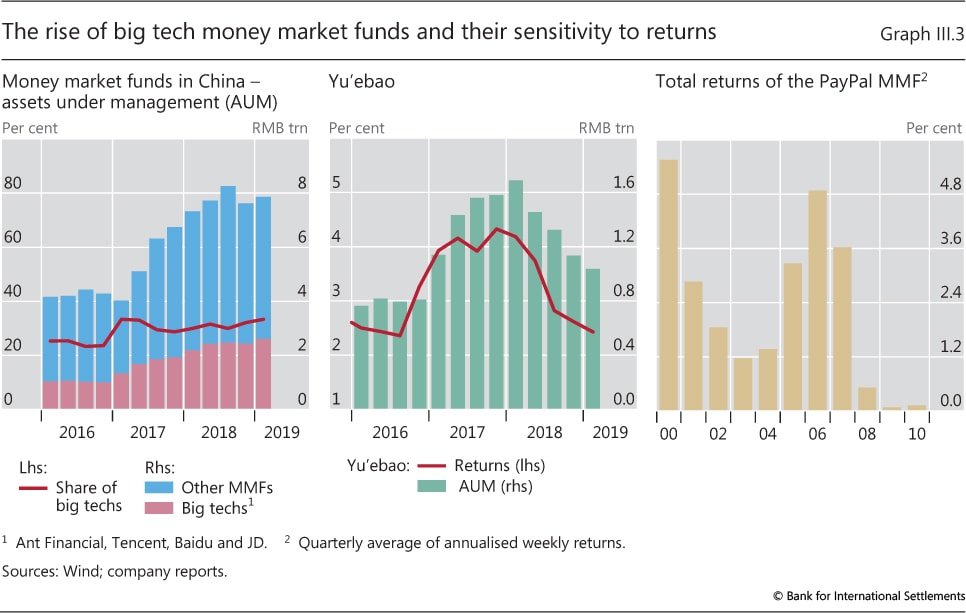
| III.3 | The rise of big tech money market funds and their sensitivity to returns | p 59 |
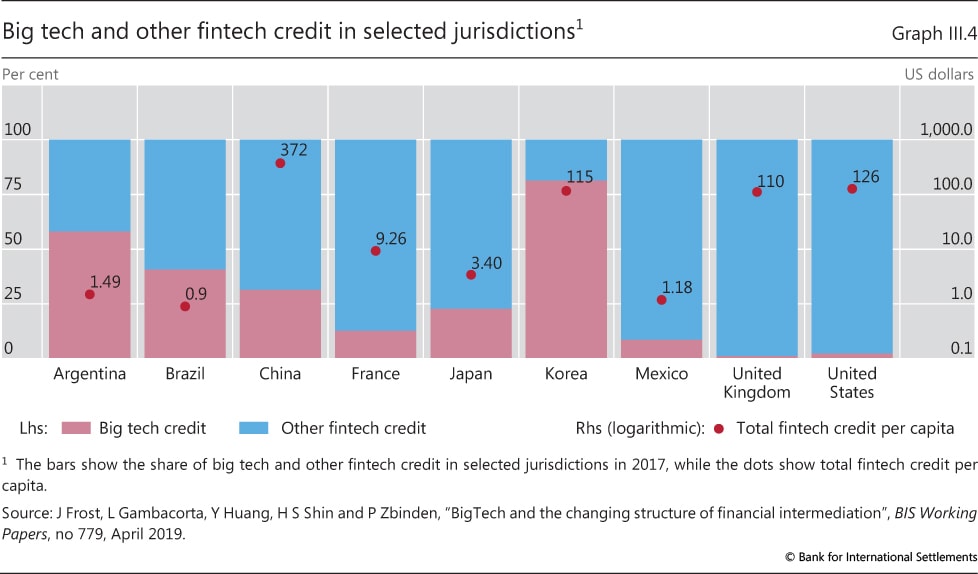
| III.4 | Big tech and other fintech credit in selected jurisdictions | p 60 |
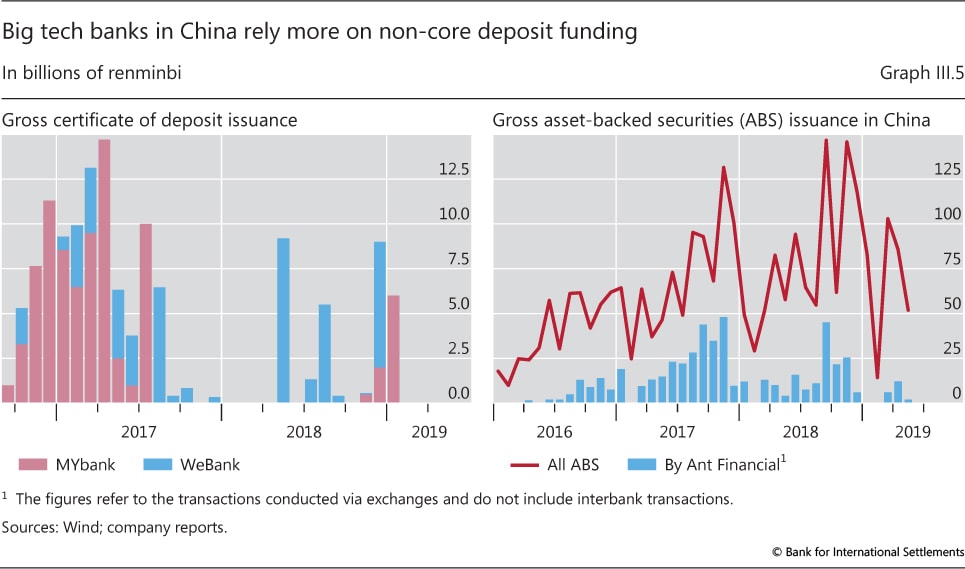
| III.5 | Big tech banks in China rely more on non-core deposit funding | p 61 |
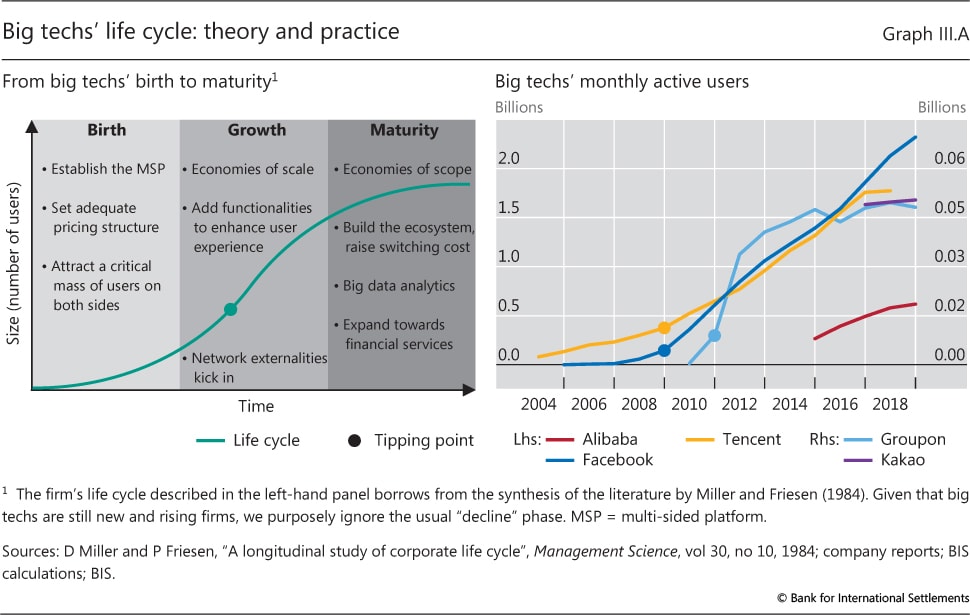
| III.A | Big techs' life cycle: theory and practice | p 63 |
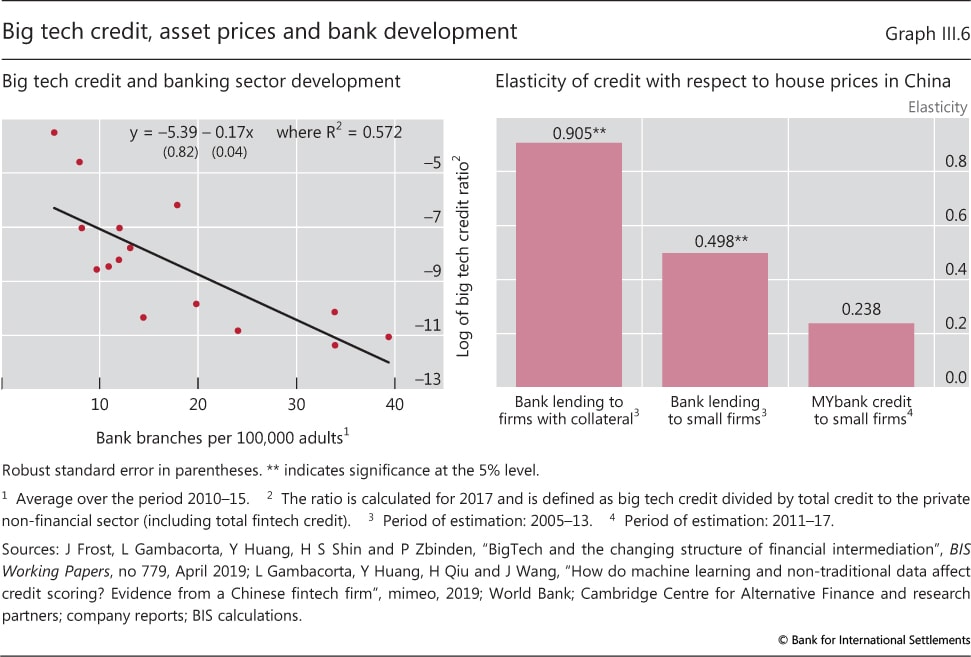
| III.6 | Big tech credit, asset prices and bank development | p 65 |
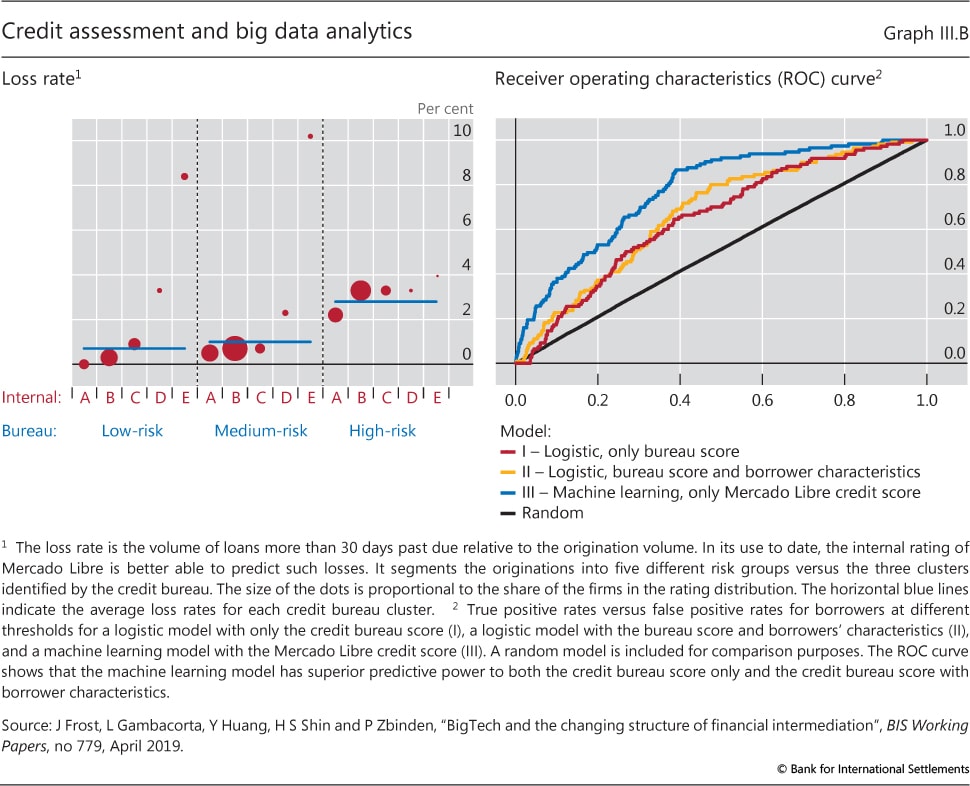
| III.B | Credit assessment and big data analytics | p 66 |
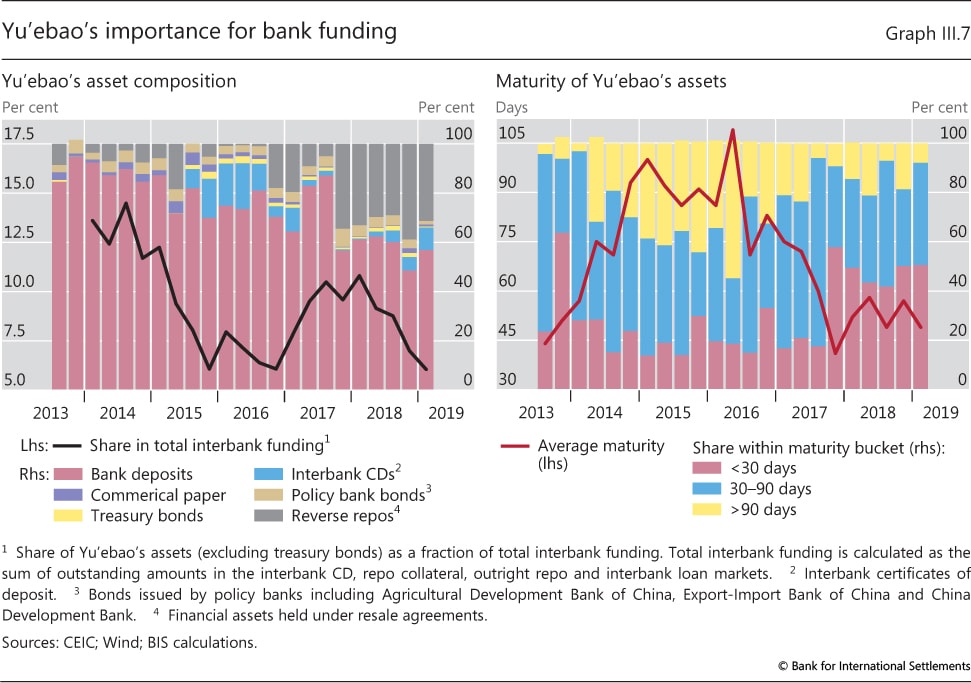
| III.7 | Yu'ebao's importance for bank funding | p 69 |
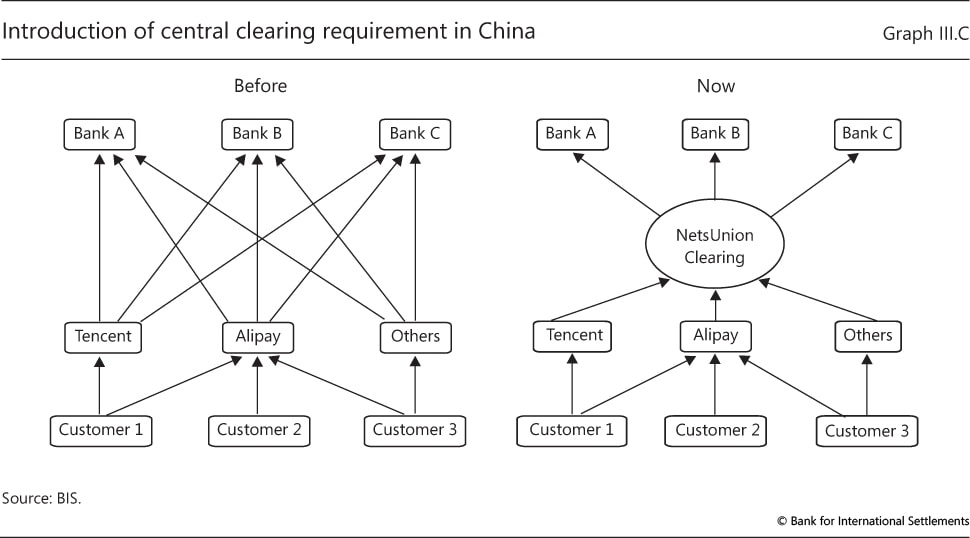
| III.C | Introduction of central clearing requirement in China | p 70 |
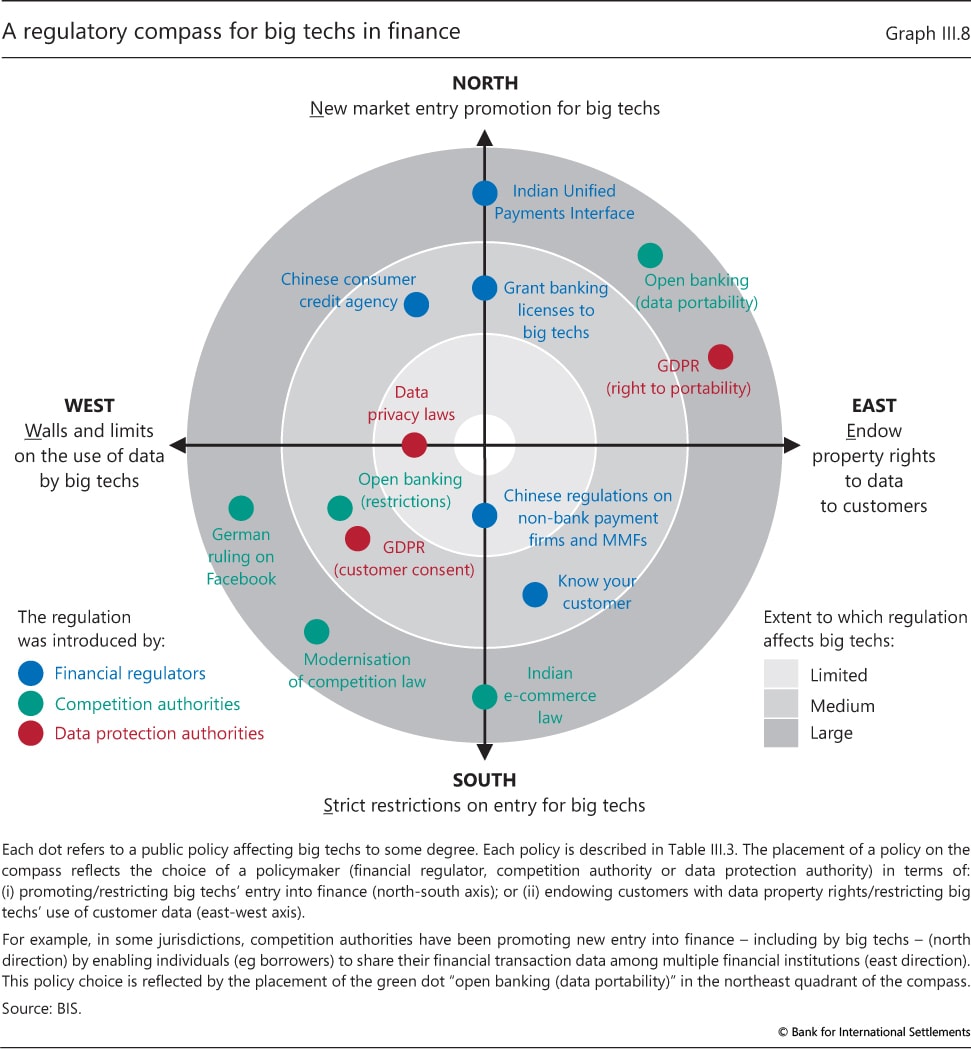
| III.8 | A regulatory compass for big techs in finance | p 71 |