85th Annual Report, 2014/15 - Statistics associated with the graphs
Series description is to be found in the corresponding graph, that is linked in the right side column.
Download all statistics (zipped XLSX, 1.5 MB).
Graphs |
||
| Chapter I: data behind the graph (xlsx) | ||
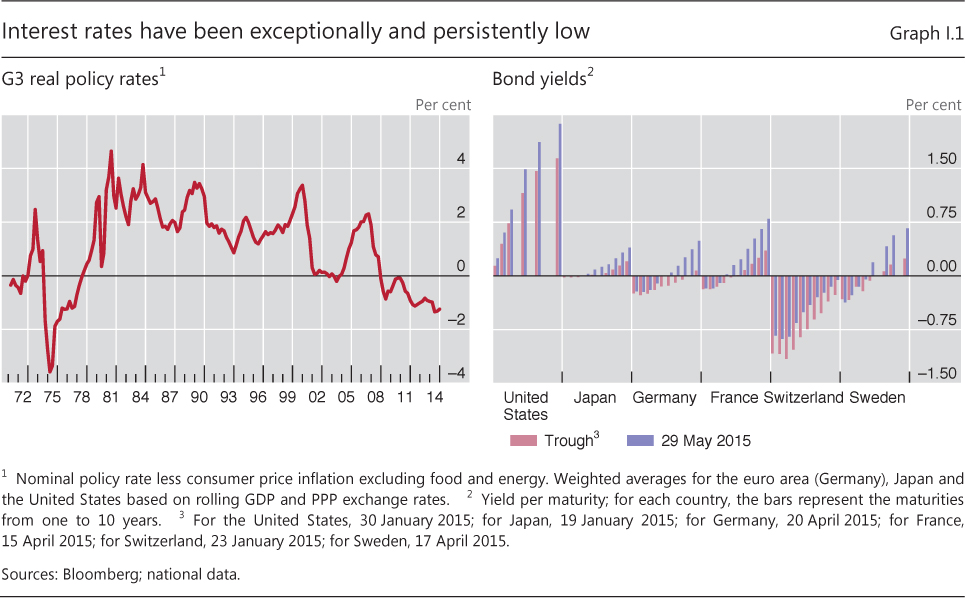
| I.1 | Interest rates have been exceptionally and persistantly low | p 7 |
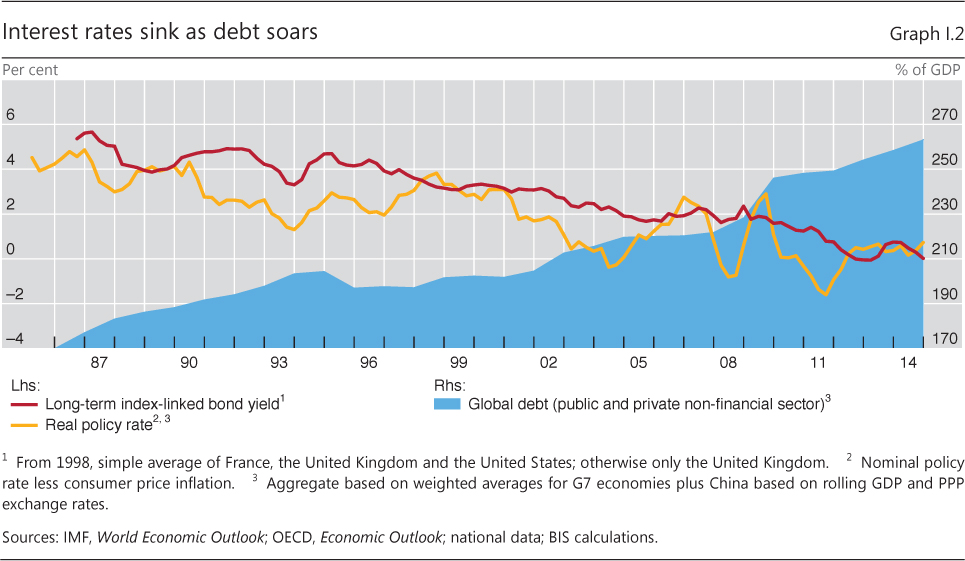
| I.2 | Interest rates sink as debt soars | p 8 |
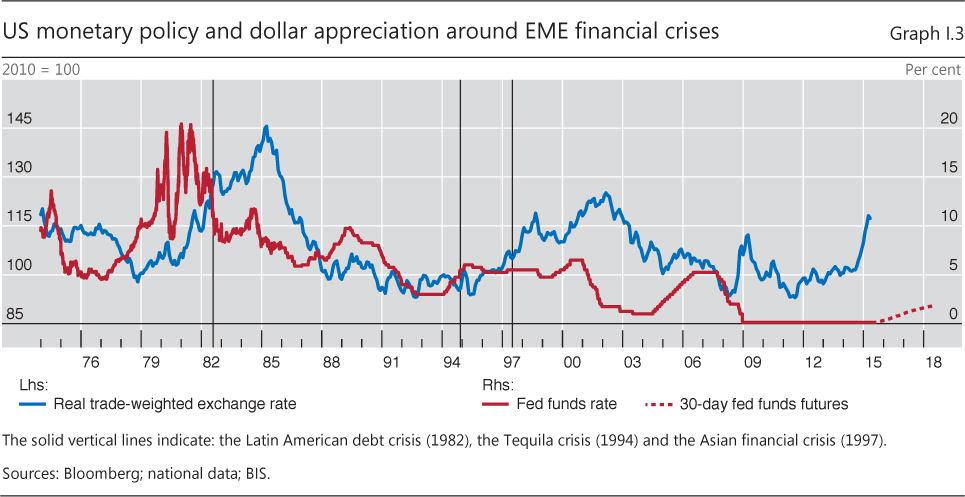
| I.3 | US monetary policy and dollar appreciation around EME financial crises | p 11 |
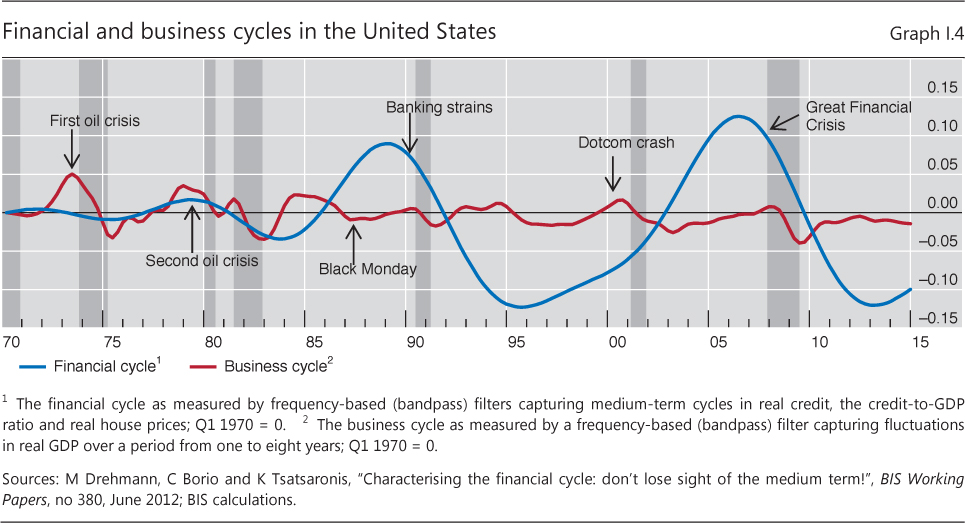
| I.4 | Financial and business cycles in the United States | p 17 |
| Chapter II: data behind the graphs (xlsx) | ||
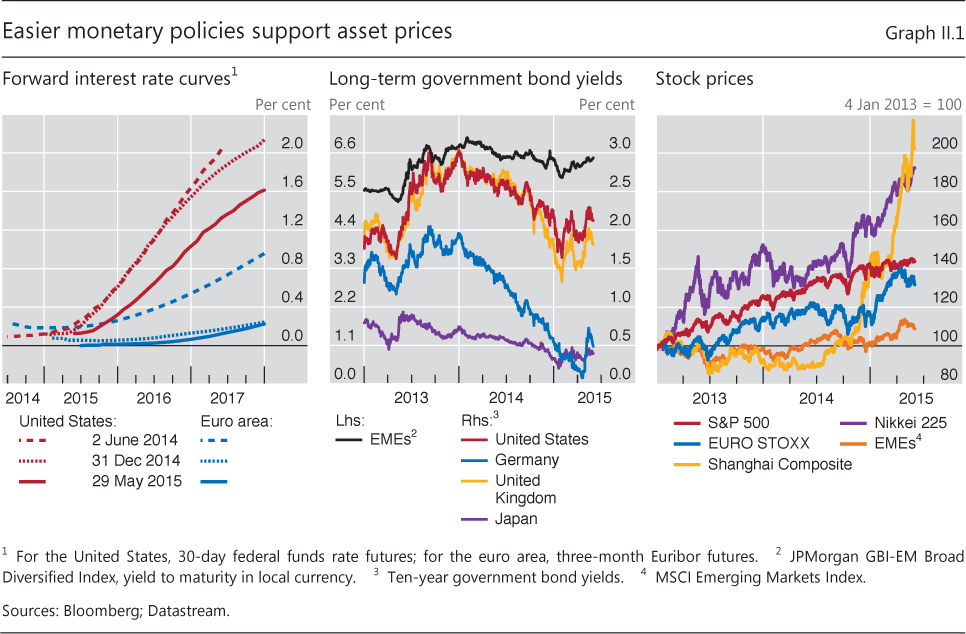
| II.1 | Easier monetary policies support asset prices | p 26 |
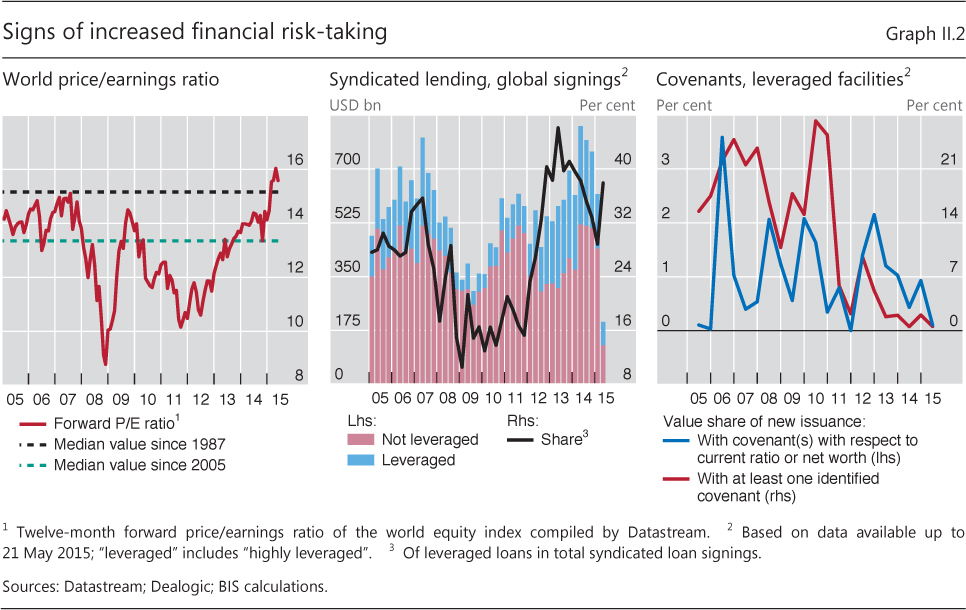
| II.2 | Signs of increased financial risk-taking | p 27 |
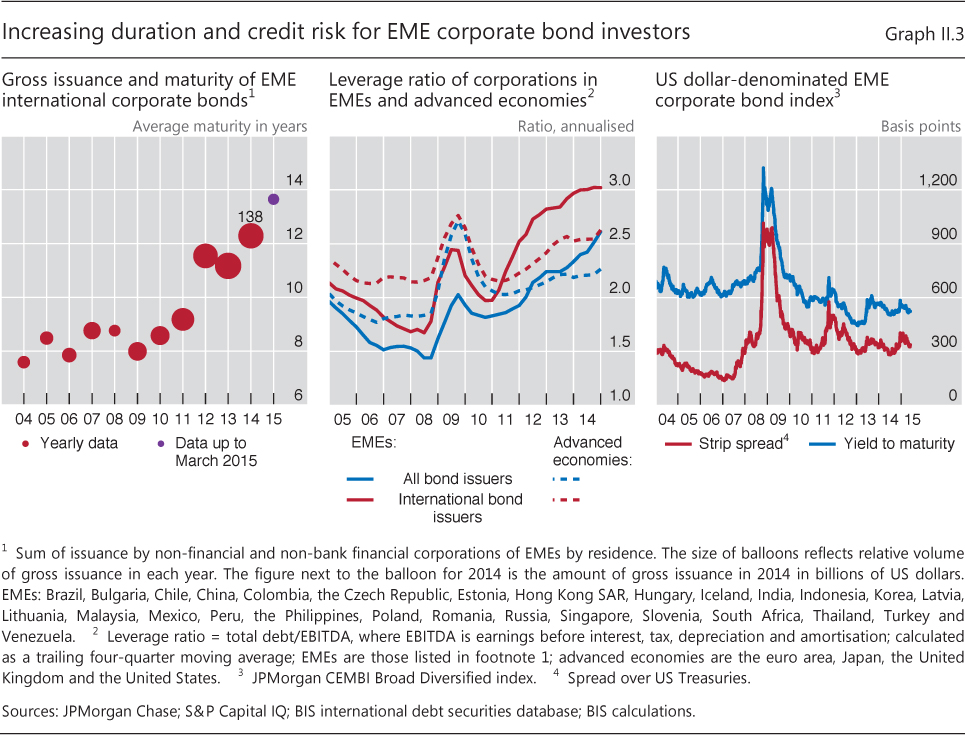
| II.3 | Increasing duration and credit risk for EME corporate bond investors | p 28 |
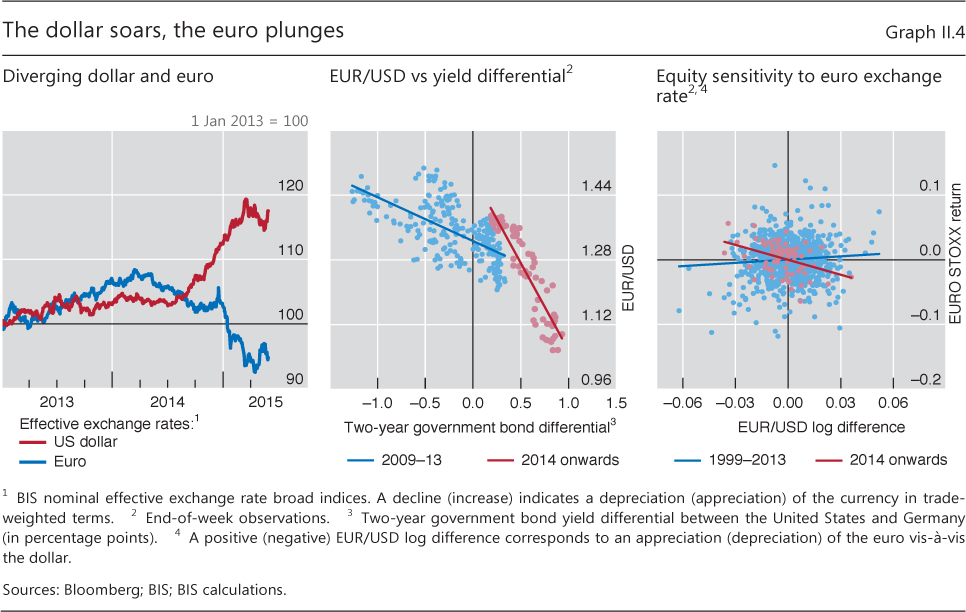
| II.4 | The dollar soars, the euro plunges | p 29 |
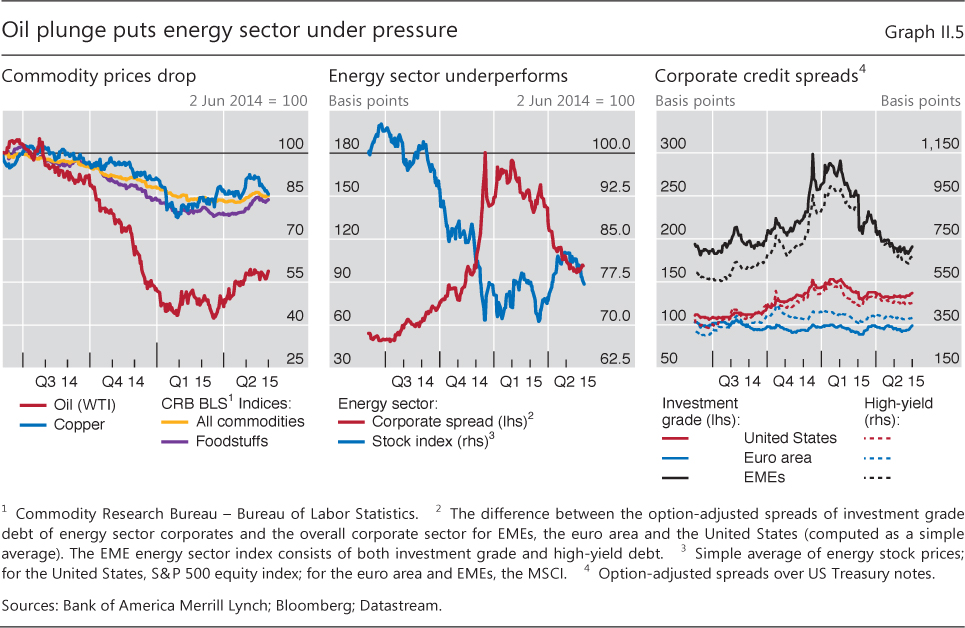
| II.5 | Oil plunge puts energy sector under pressure | p 29 |
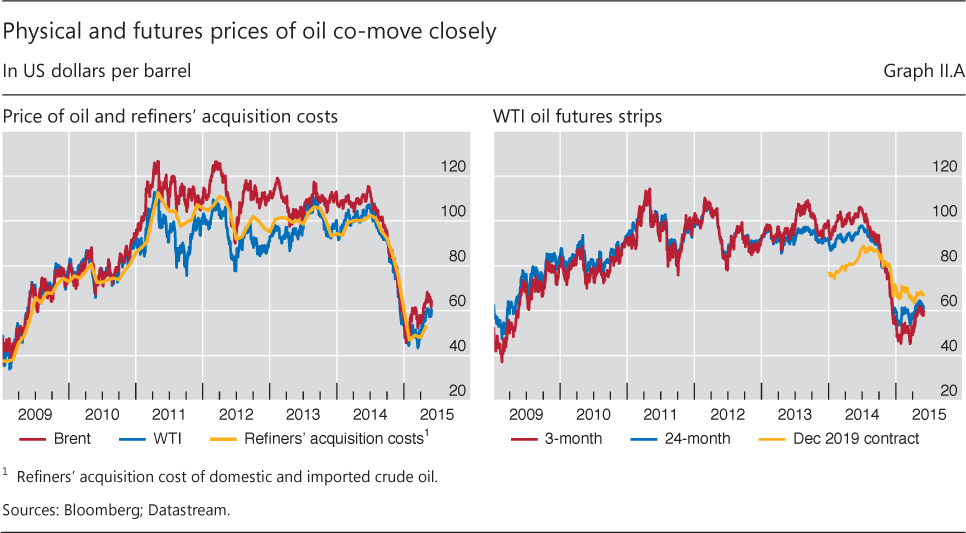
| II.A | Physical and futures prices of oil co-move closely | p 30 |
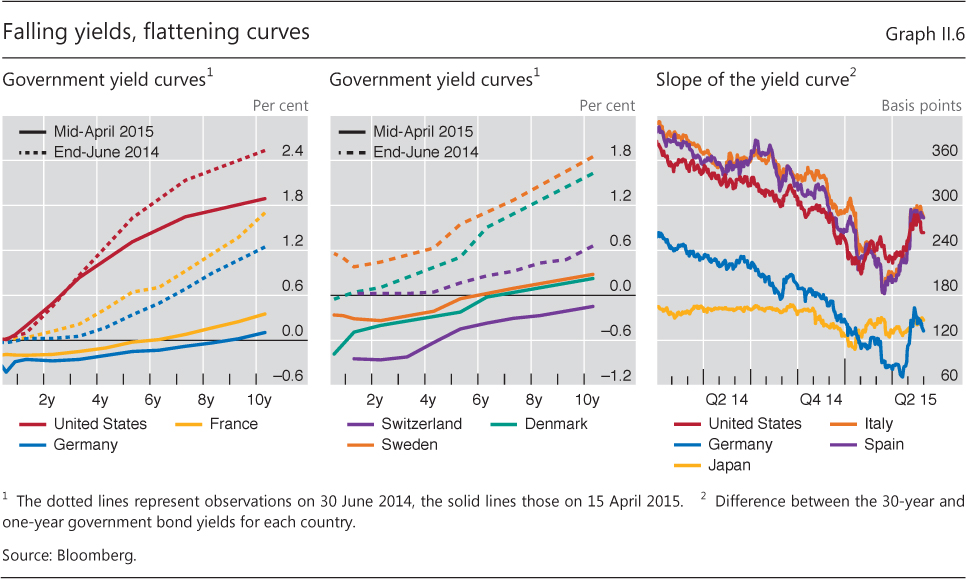
| II.6 | Falling yields, flattening curves | p 32 |
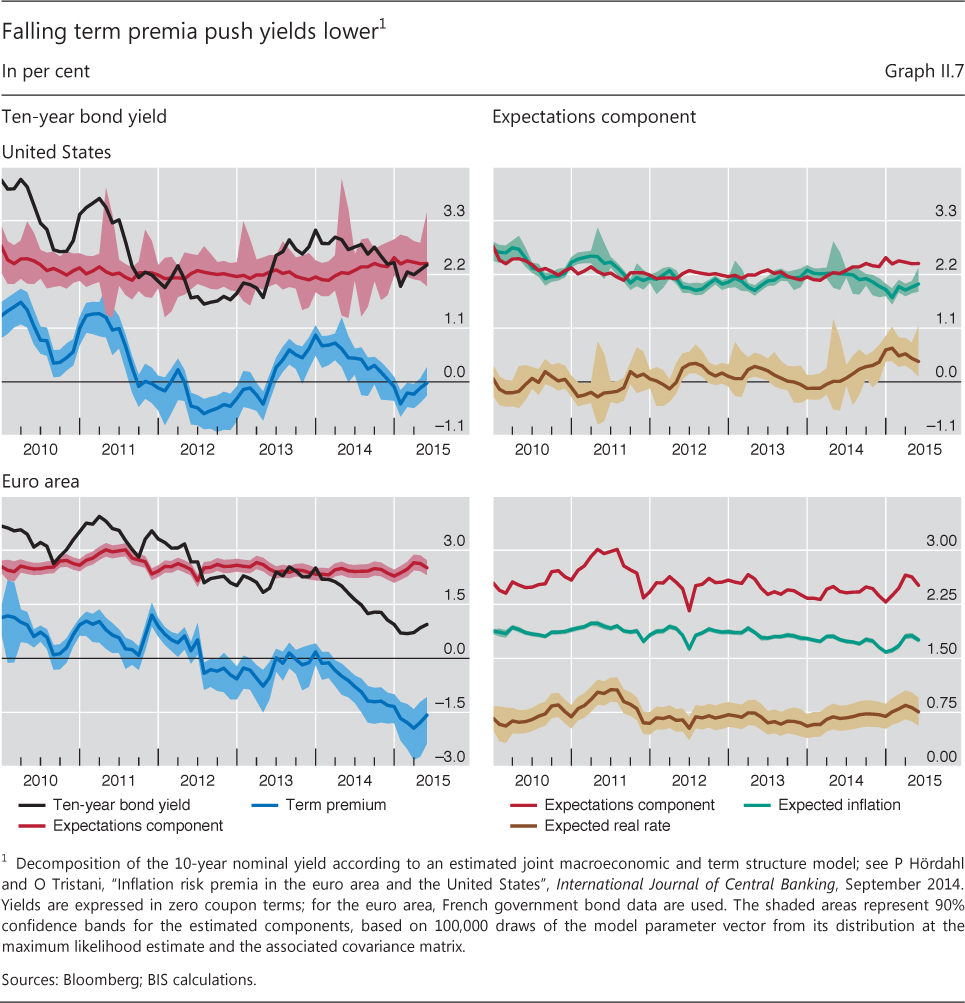
| II.7 | Falling term premia push yields lower | p 33 |
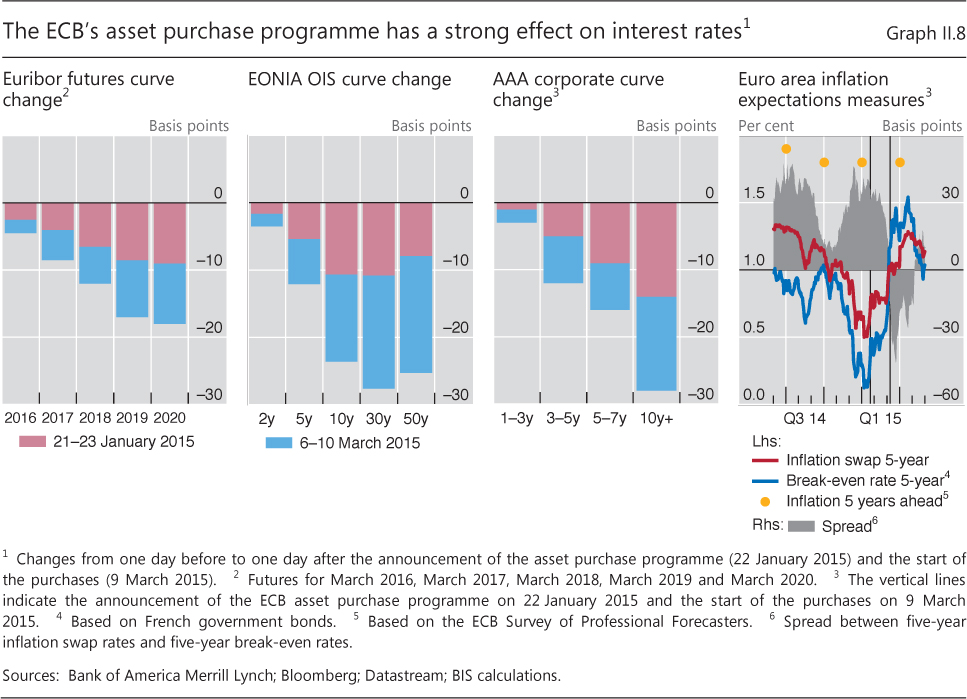
| II.8 | The ECB's asset purchase programme has a strong effect on interest rates | p 34 |
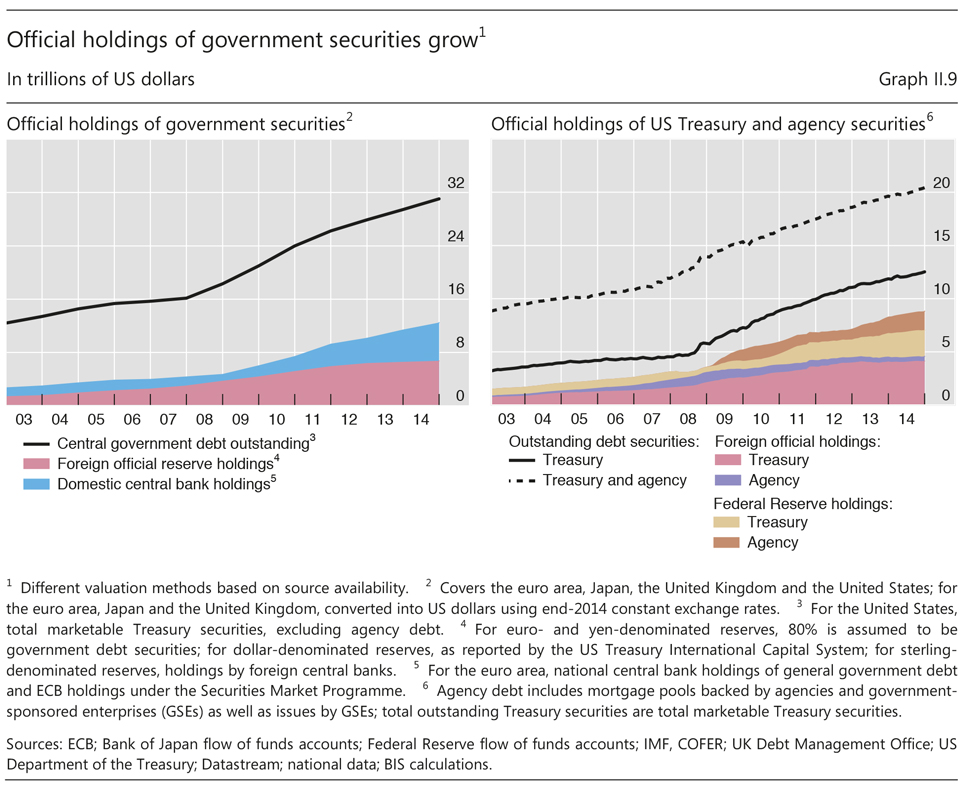
| II.9 | Official holdings of government securities grow | p 35 |
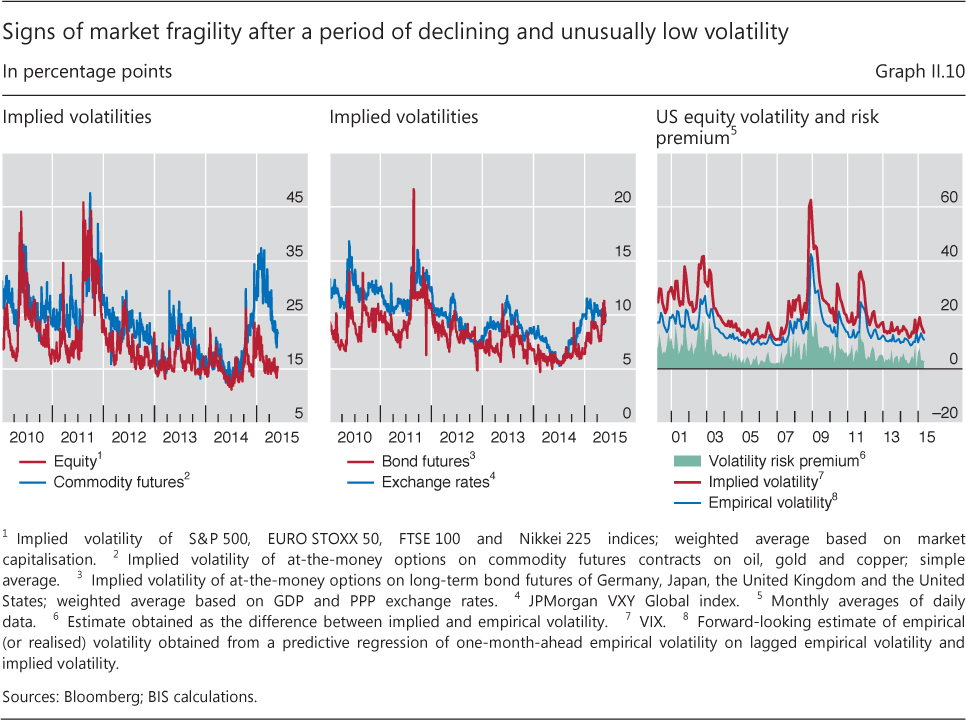
| II.10 | Signs of market fragility after a period of declining and unusually low volatility | p 37 |
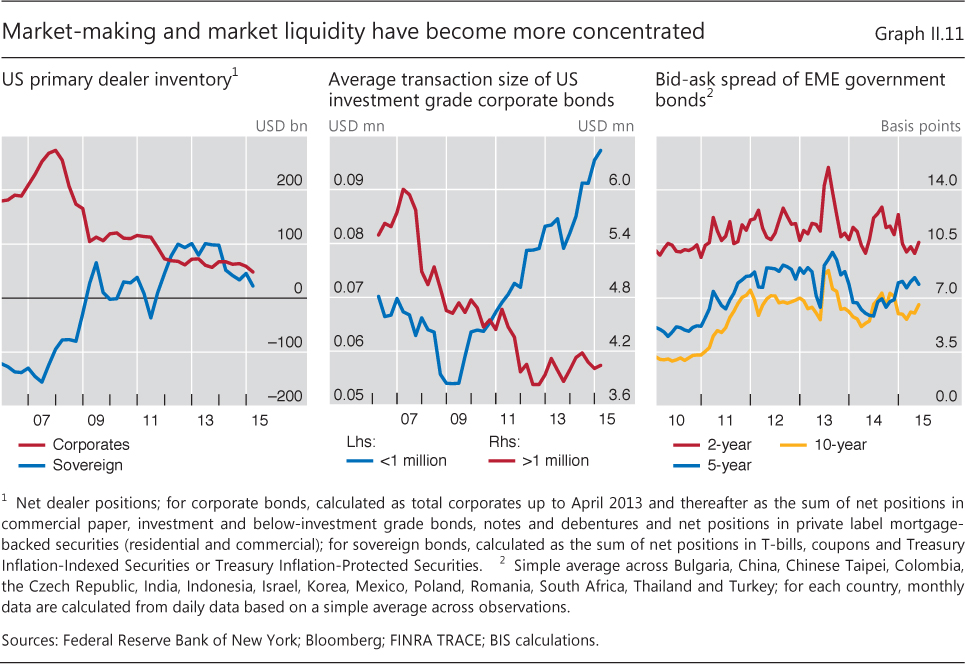
| II.11 | Market-making and market liquidity have become more concentrated | p 38 |
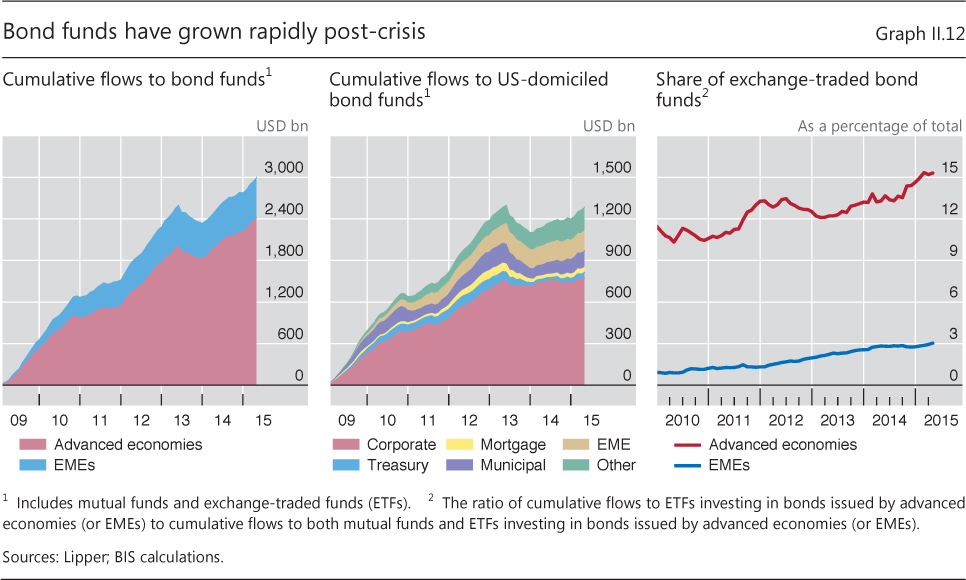
| II.12 | Bond funds have grown rapidly post-crisis | p 39 |
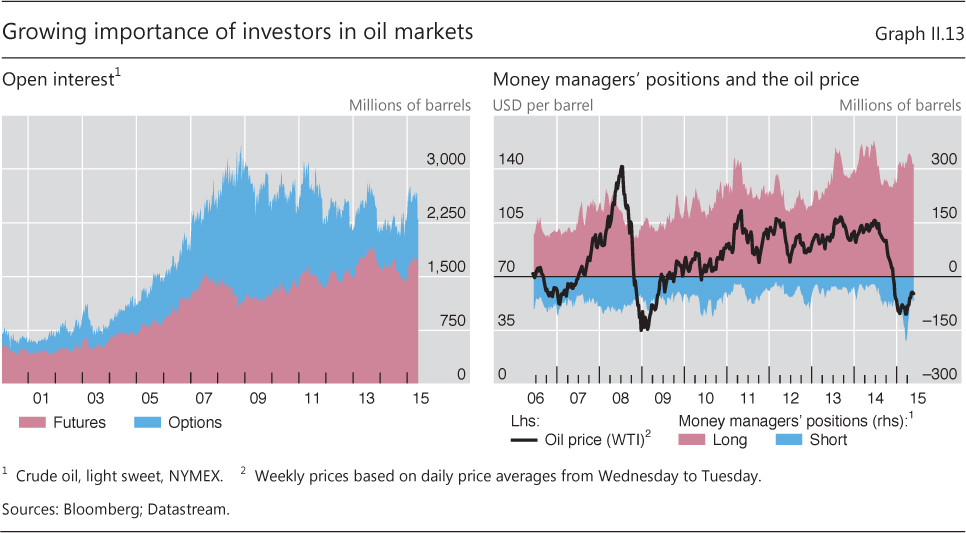
| II.13 | Growing importance of investors in oil markets | p 40 |
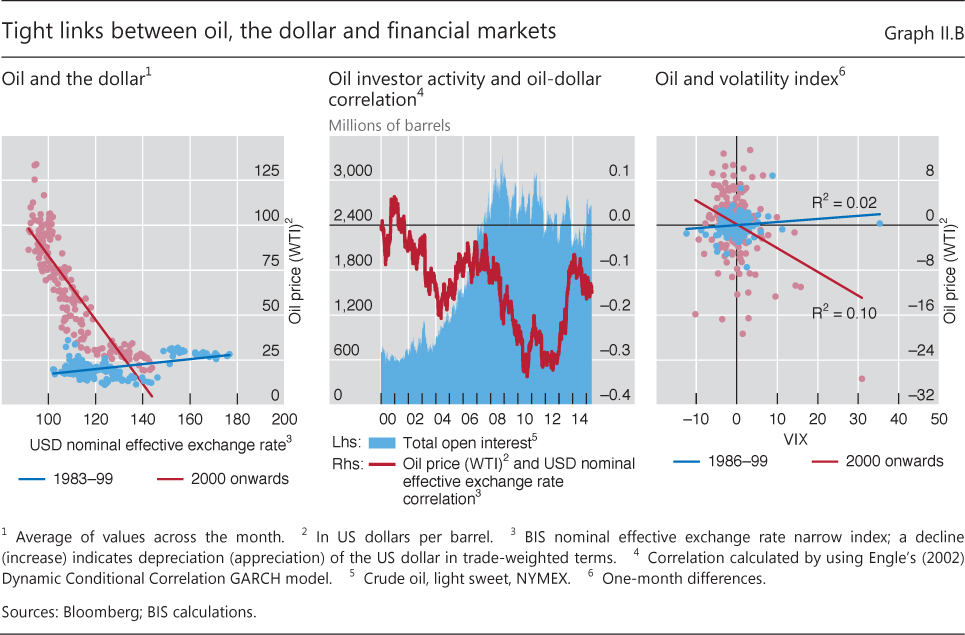
| II.B | Tight links between oil, the dollar and financial markets | p 41 |
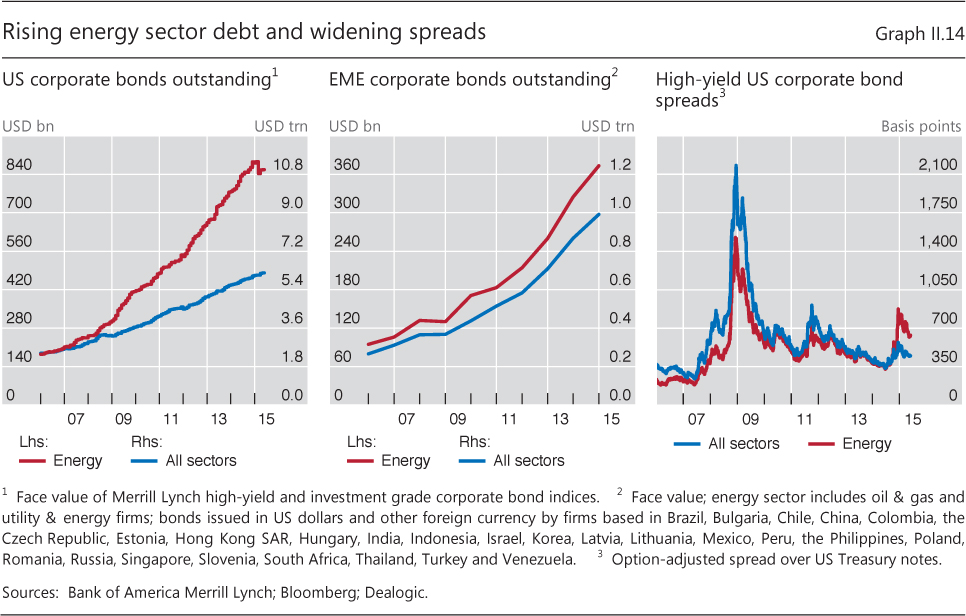
| II.14 | Rising energy sector debt and widening spreads | p 42 |
| Chapter III: data behind the graphs (xlsx) | ||
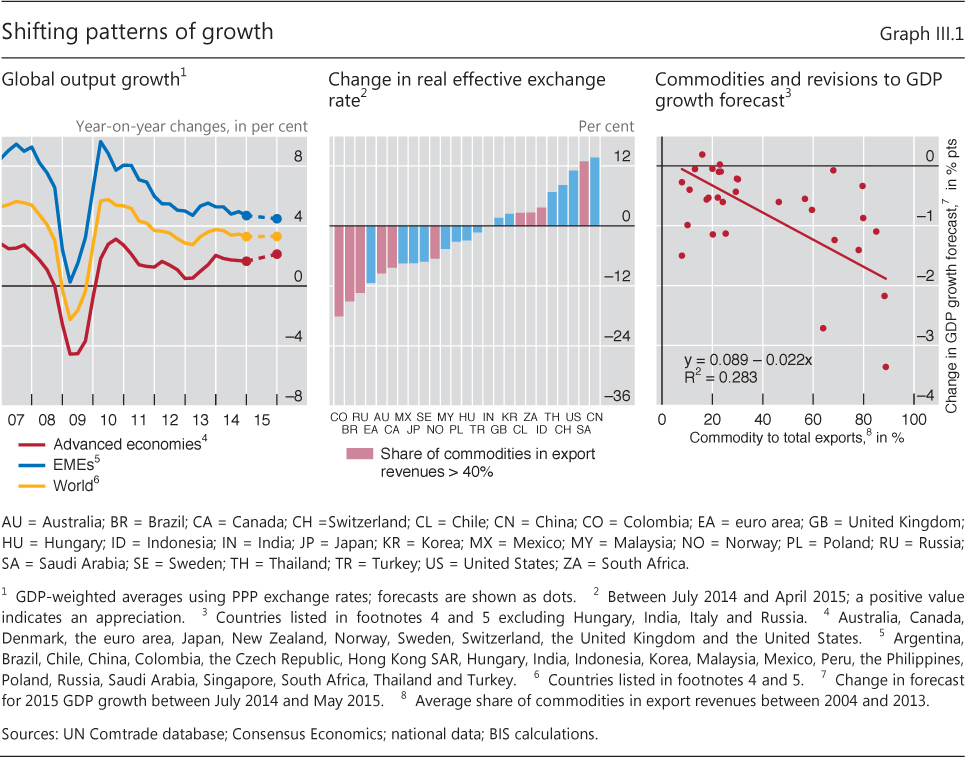
| III.1 | Shifting patterns of growth | p 46 |
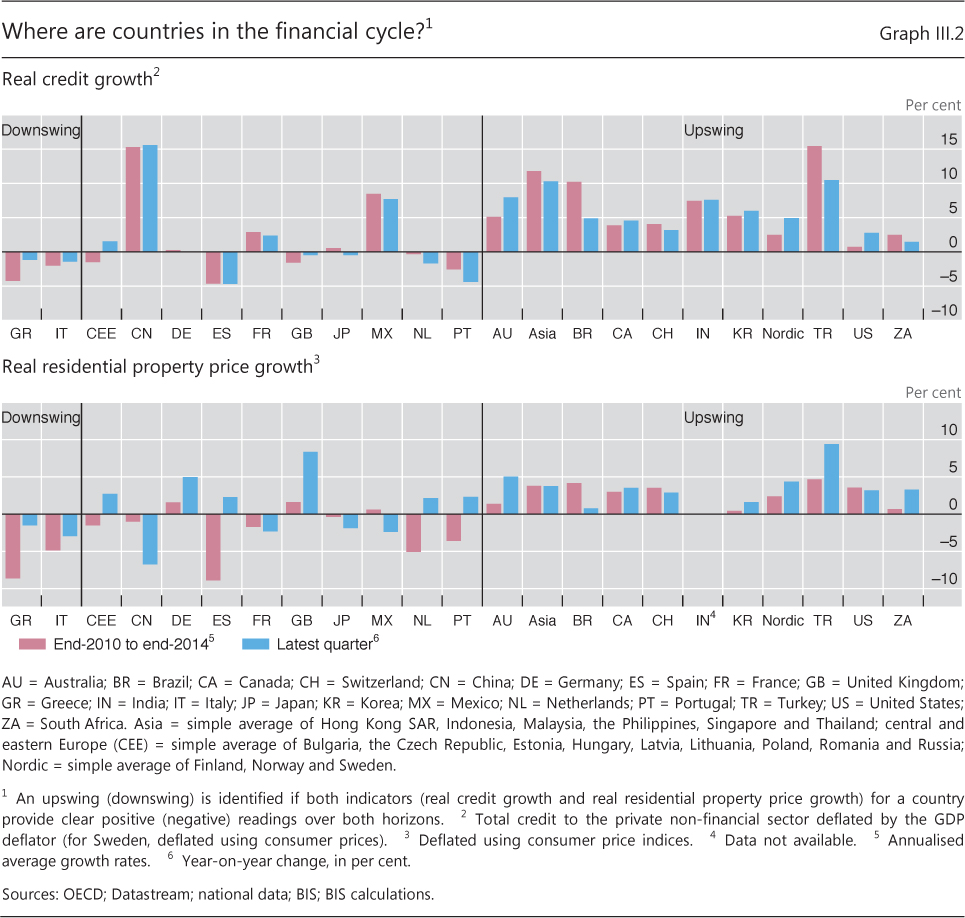
| III.2 | Where are countries in the financial cycle? | p 47 |
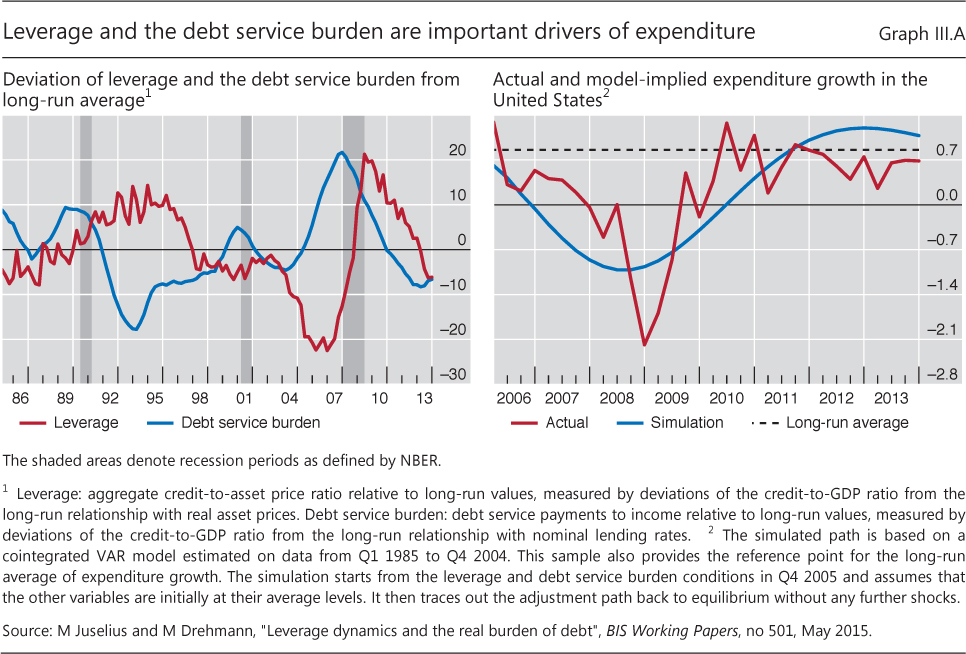
| III.A | Leverage and the debt service burden are important drivers of expenditure | p 49 |
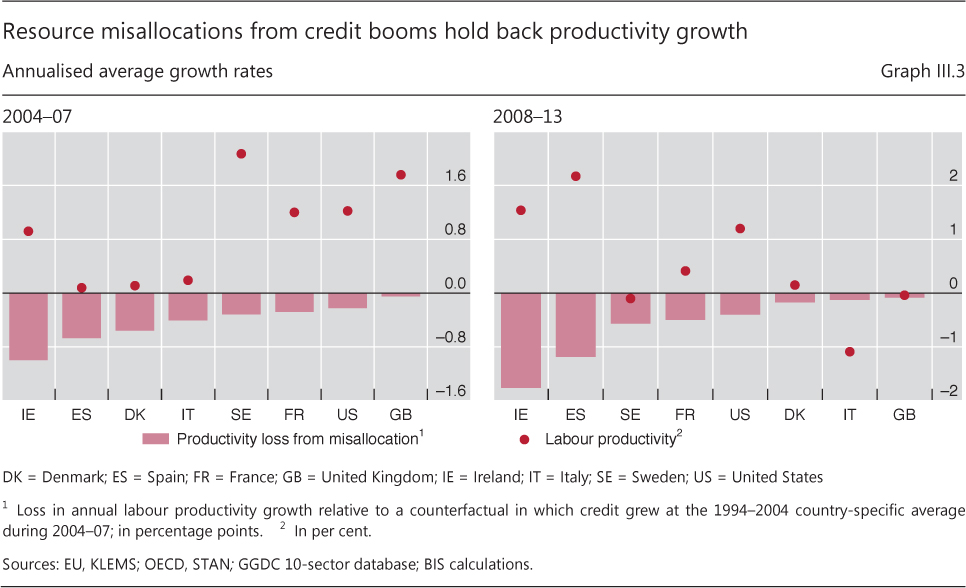
| III.3 | Resource misallocations from credit booms hold back productivity growth | p 51 |
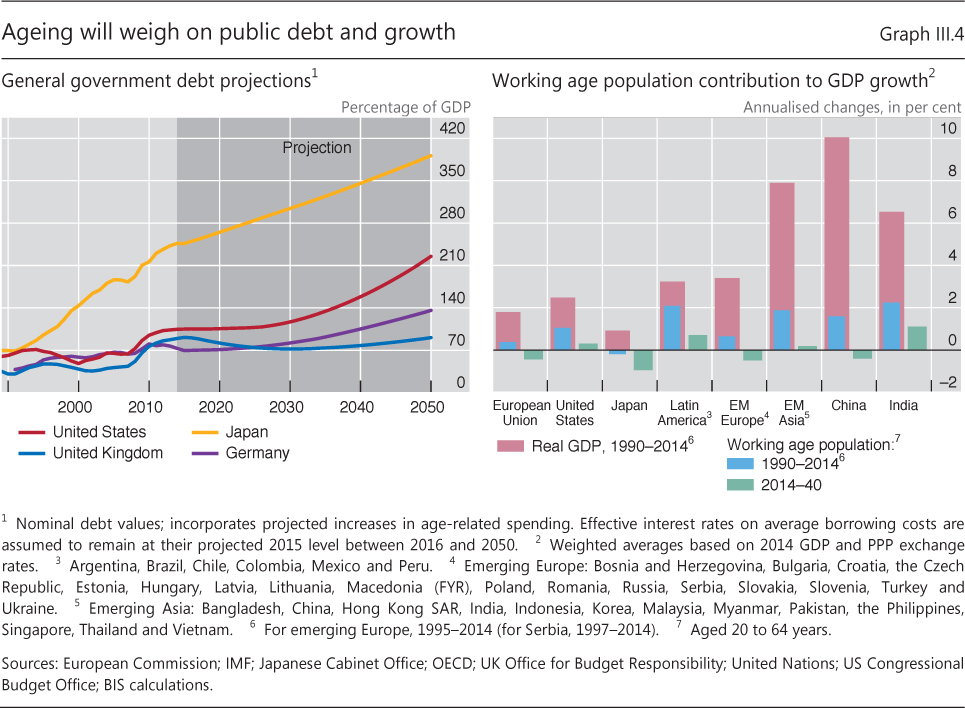
| III.4 | Ageing will weigh on public debt and growth | p 52 |
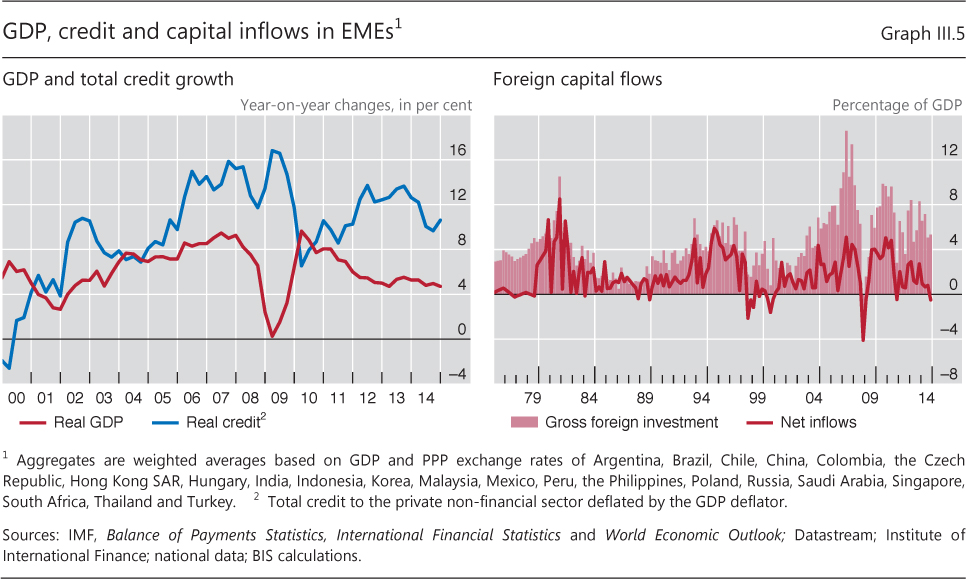
| III.5 | GDP, credit and capital inflows in EMEs | p 54 |
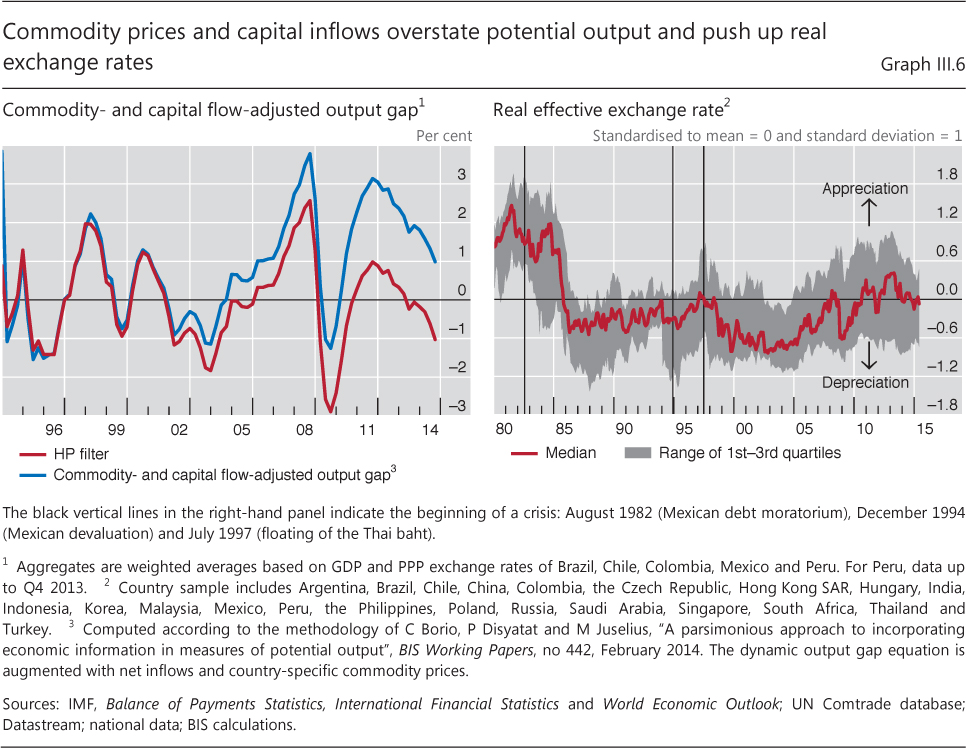
| III.6 | Commodity prices and capital inflows overstate potential output and push up real exchange rates | p 55 |
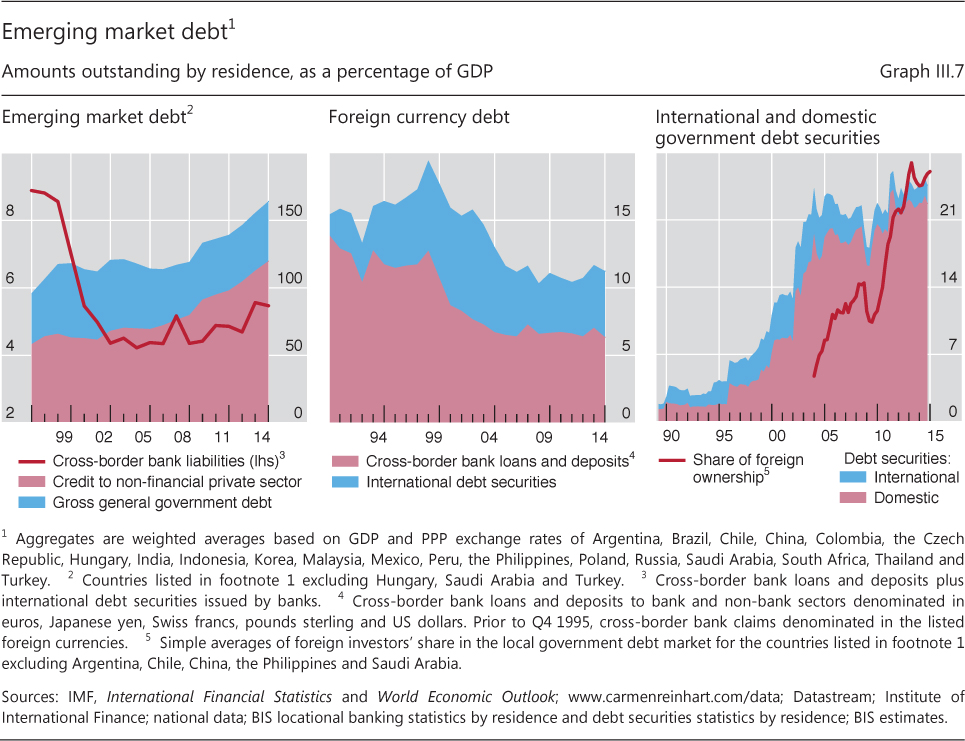
| III.7 | Emerging market debt | p 56 |
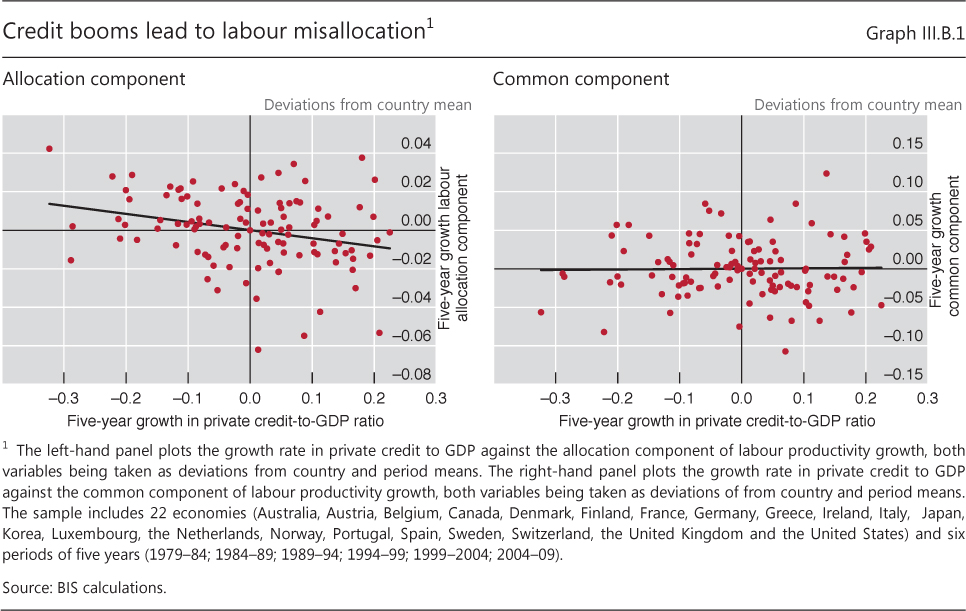
| III.B.1 | Credit booms lead to labour misallocation | p 57 |
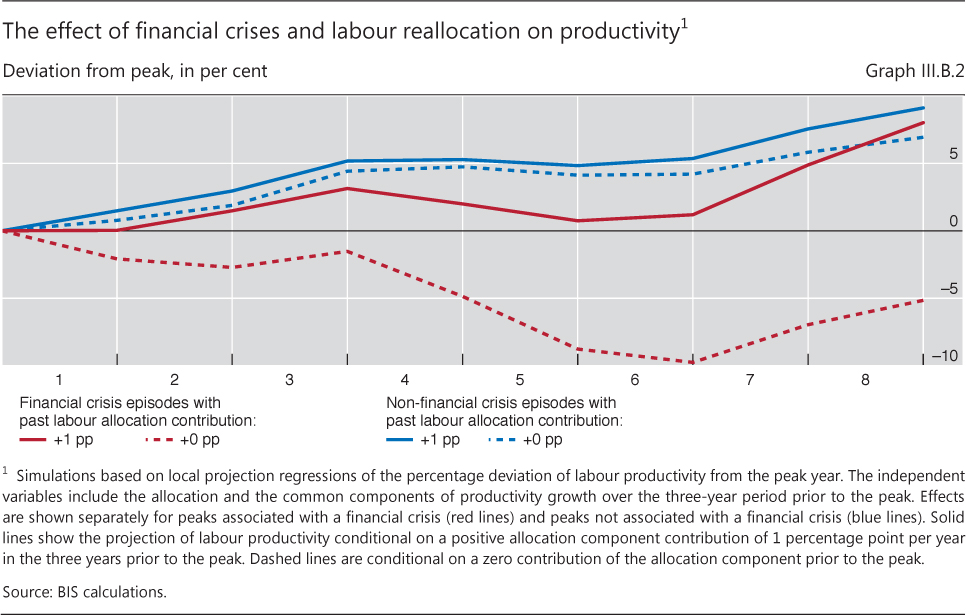
| III.B.2 | The effect of financial crises and labour reallocation on productivity | p 58 |
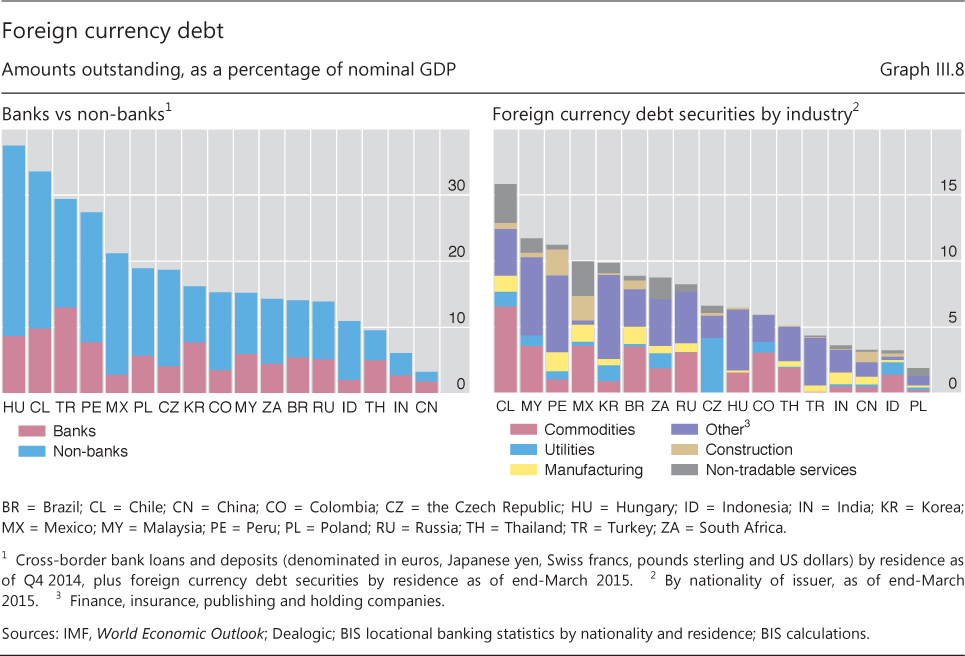
| III.8 | Foreign currency debt | p 59 |
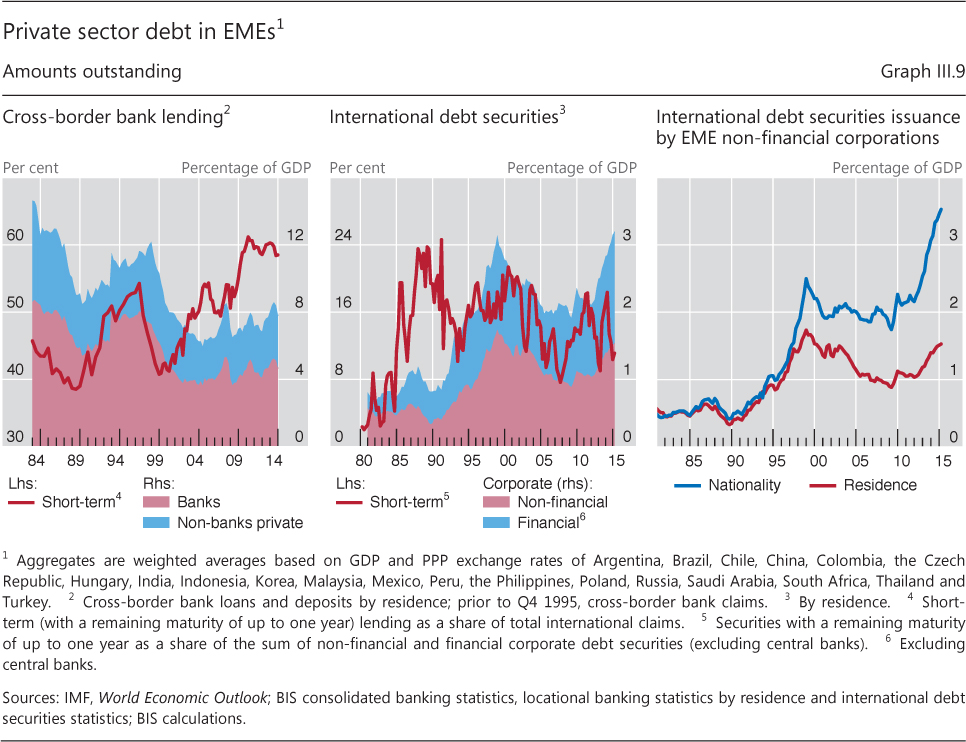
| III.9 | Private sector debt in EMEs | p 60 |
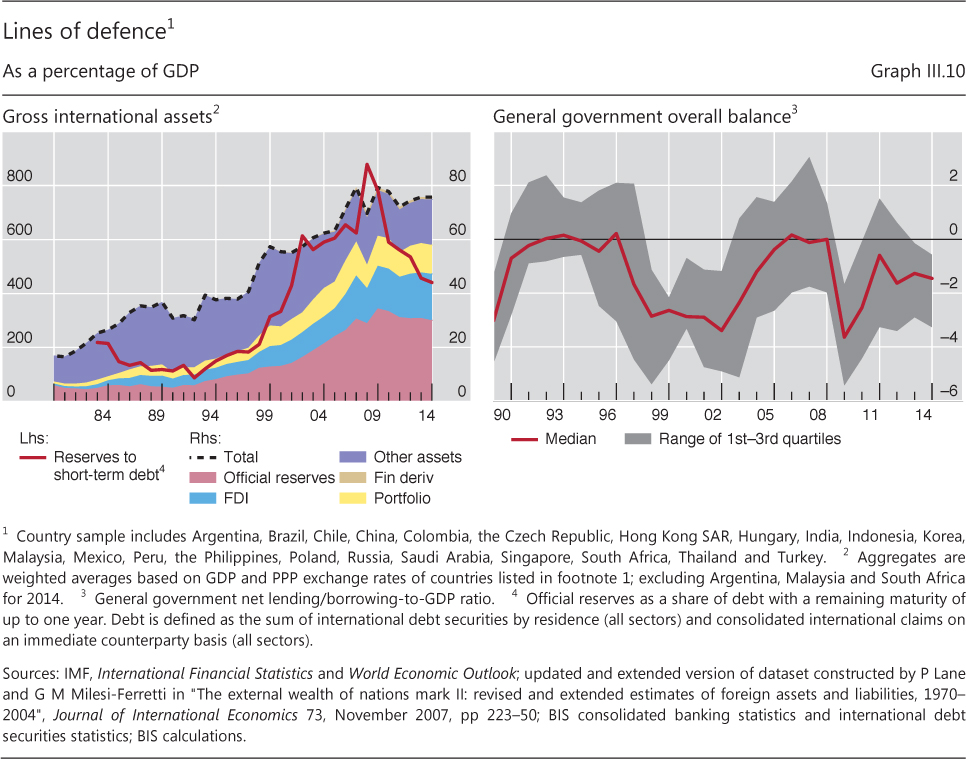
| III.10 | Lines of defence | p 61 |
| Chapter IV: data behind the graphs (xlsx) | ||
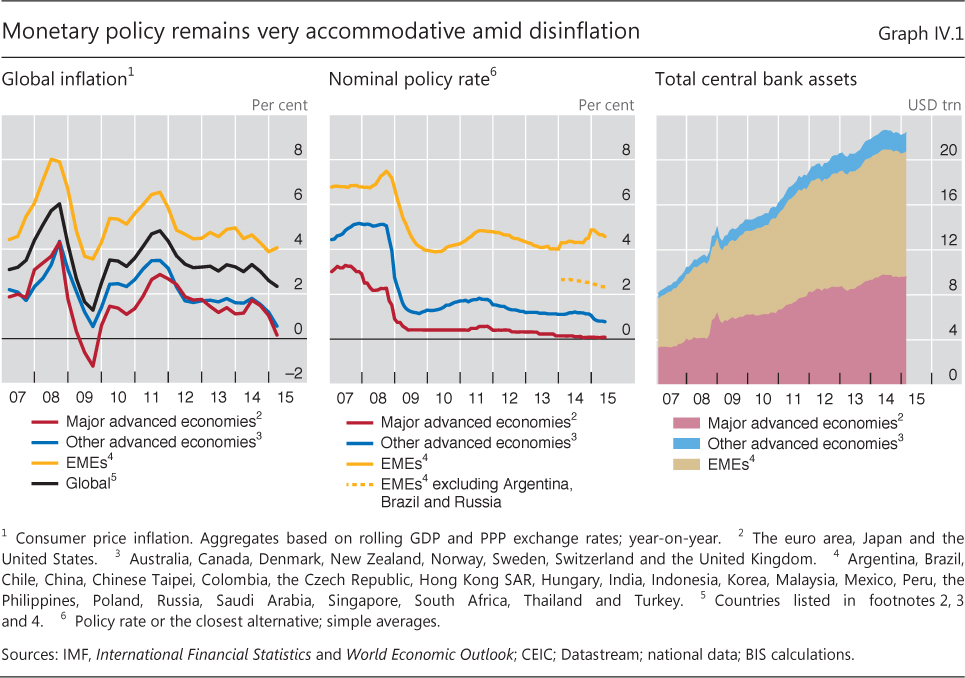
| IV.1 | Monetary policy remains very accommodative amid disinflation | p 66 |
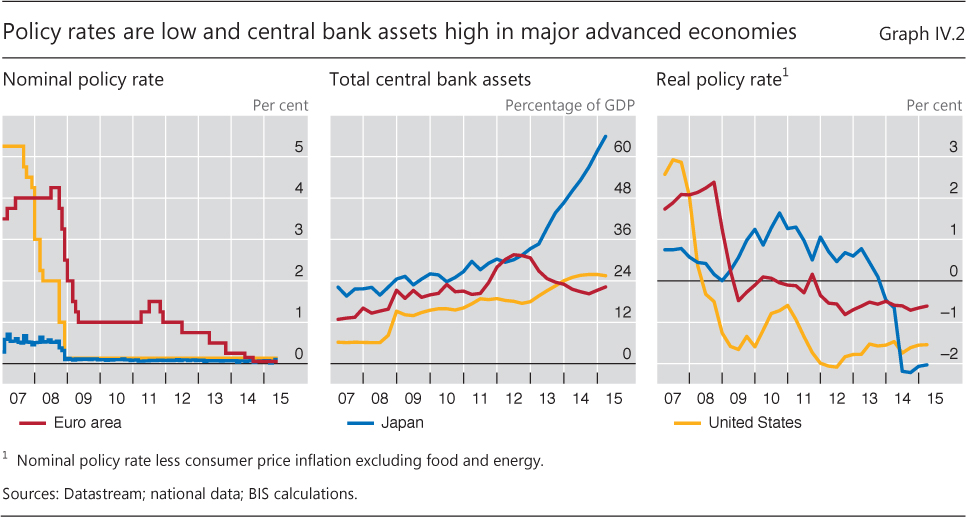
| IV.2 | Policy rates are low and central bank assets high in major advanced economies | p 67 |
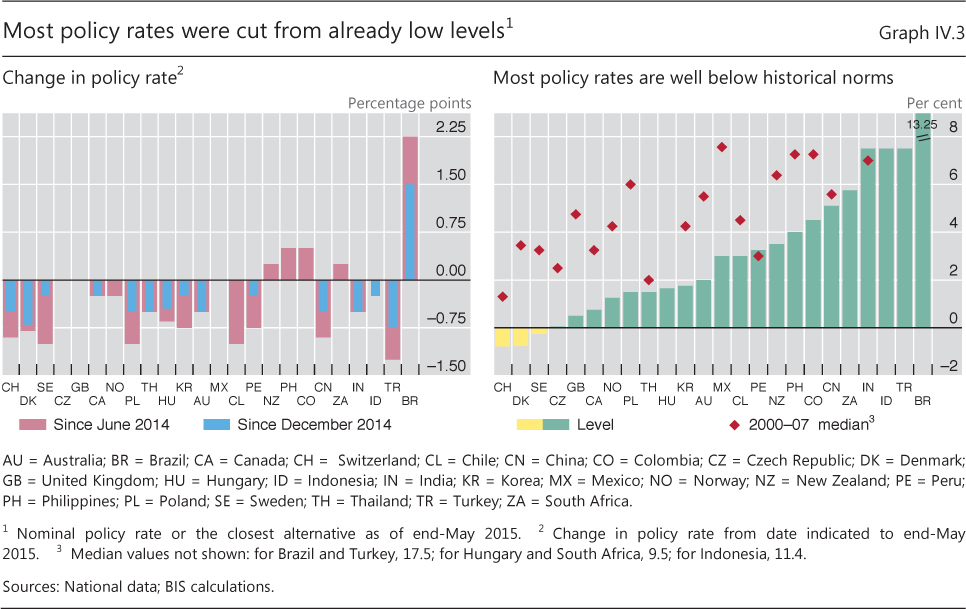
| IV.3 | Most policy rates were cut from already low levels | p 68 |
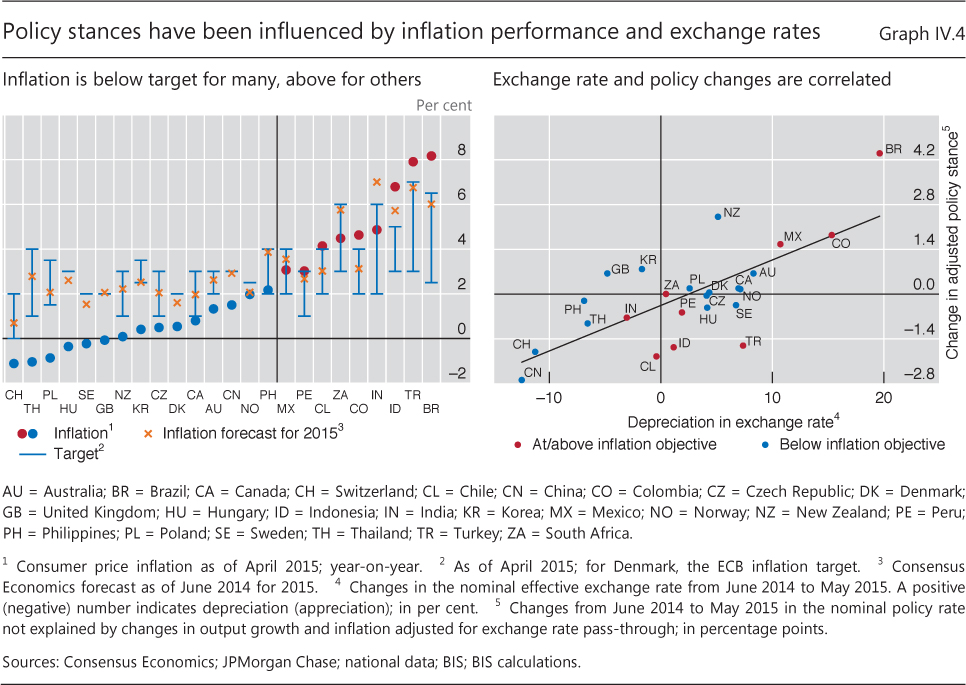
| IV.4 | Policy stances have been influenced by inflation performance and exchange rates | p 69 |
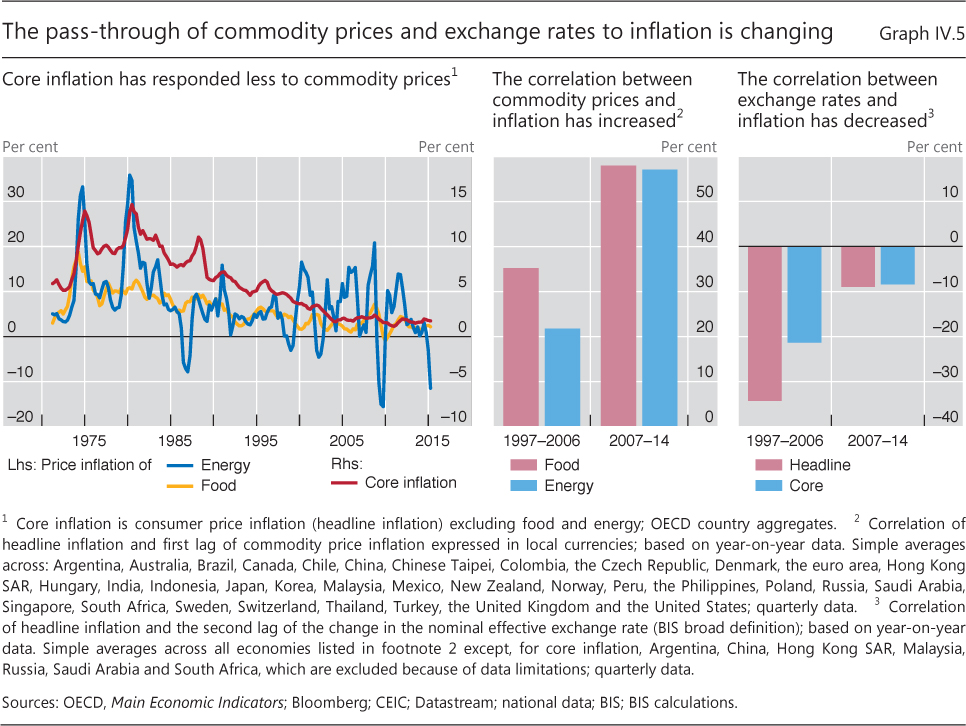
| IV.5 | The pass-through of commodity prices and exchange rates to inflation is changing | p 70 |
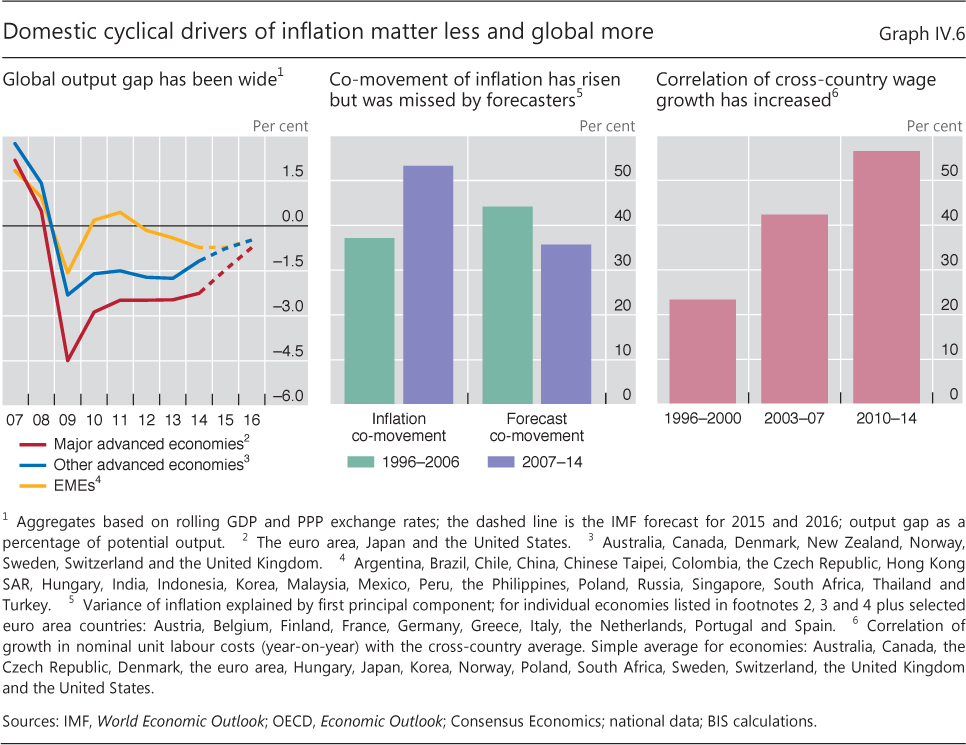
| IV.6 | Domestic cyclical drivers of inflation matter less and global more | p 72 |
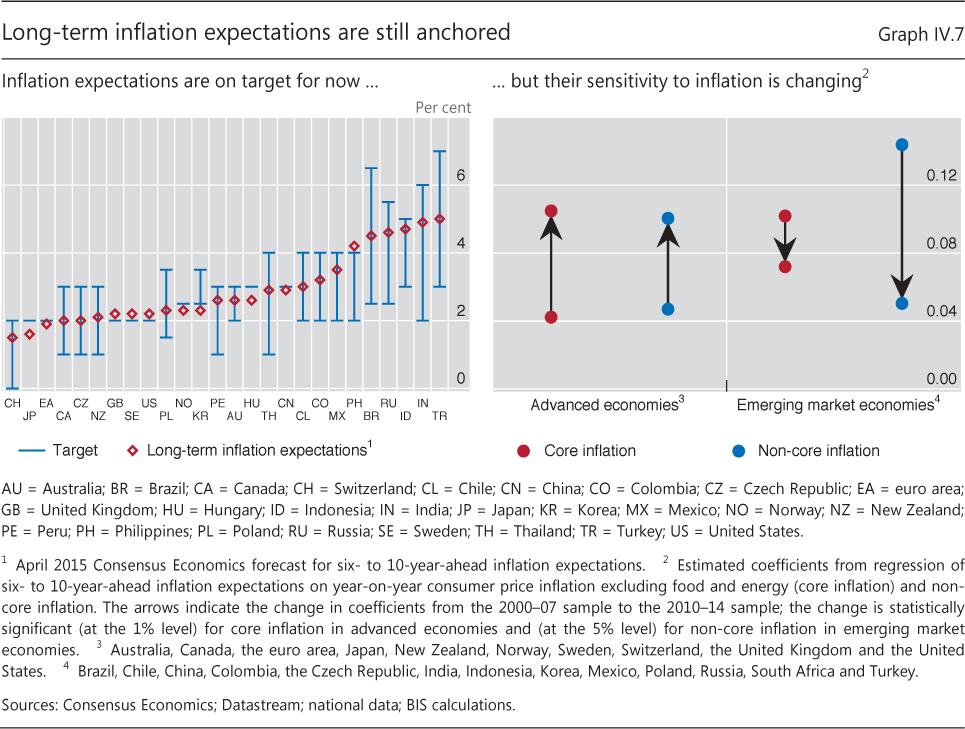
| IV.7 | Long-term inflation expectations are still anchored | p 73 |
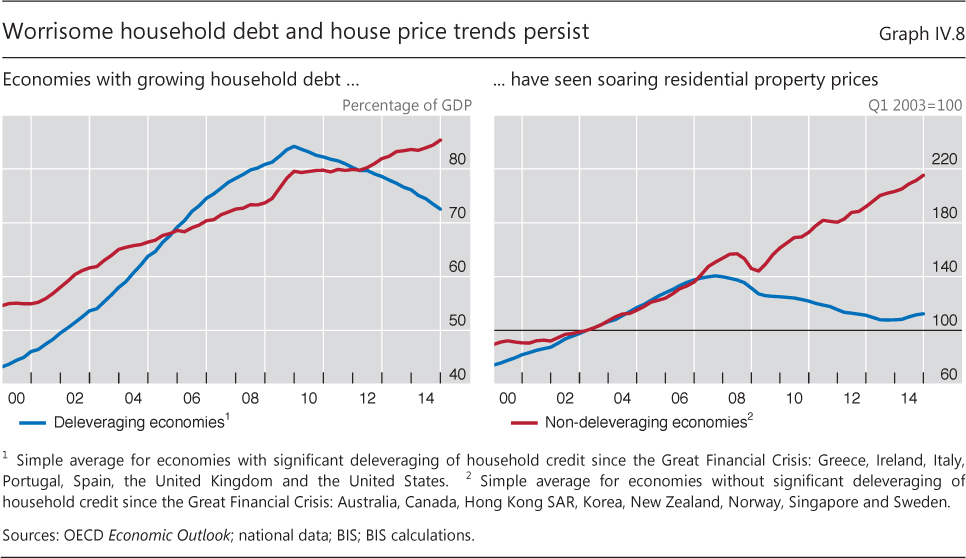
| IV.8 | Worrisome household debt and house price trends persist | p 75 |
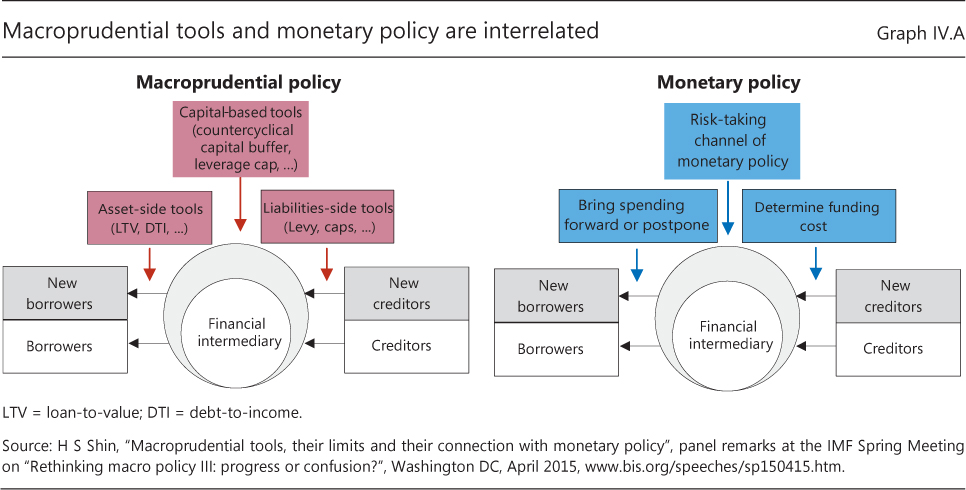
| IV.A | Macroprudential tools and monetary policy are interrelated | p 76 |
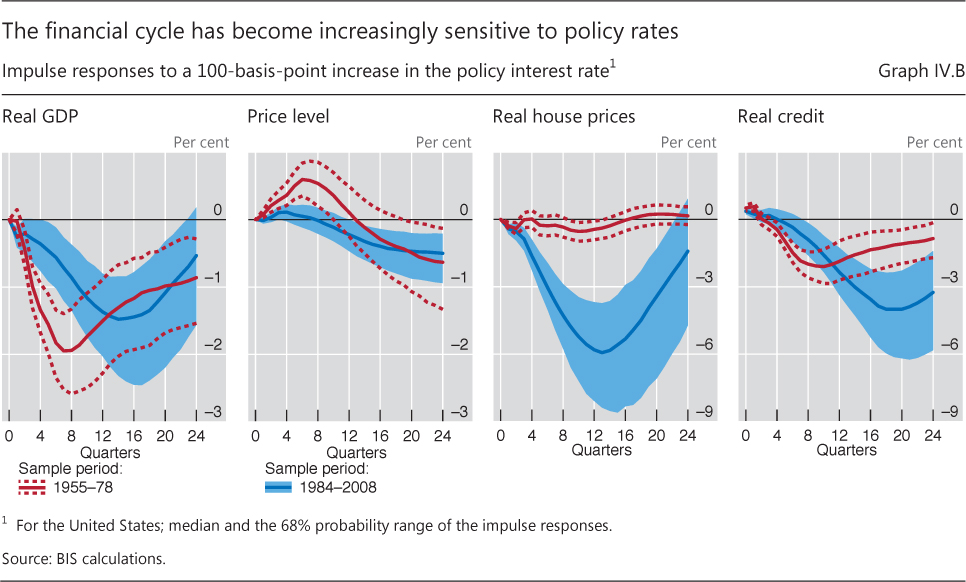
| IV.B | The financial cycle has become increasingly sensitive to policy rates | p 78 |
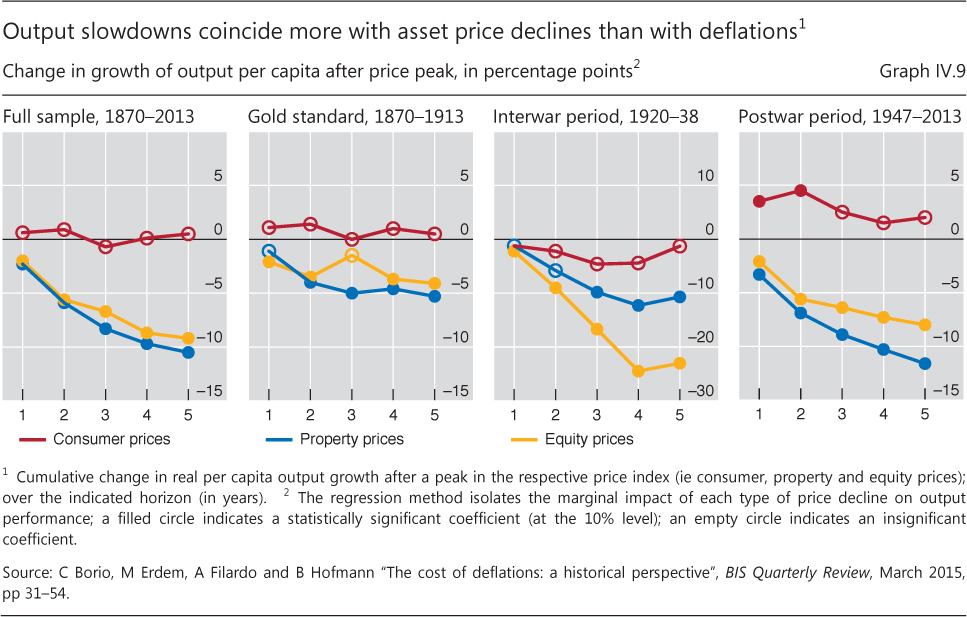
| IV.9 | Output slowdowns coincide more with asset price declines than with deflations | p 80 |
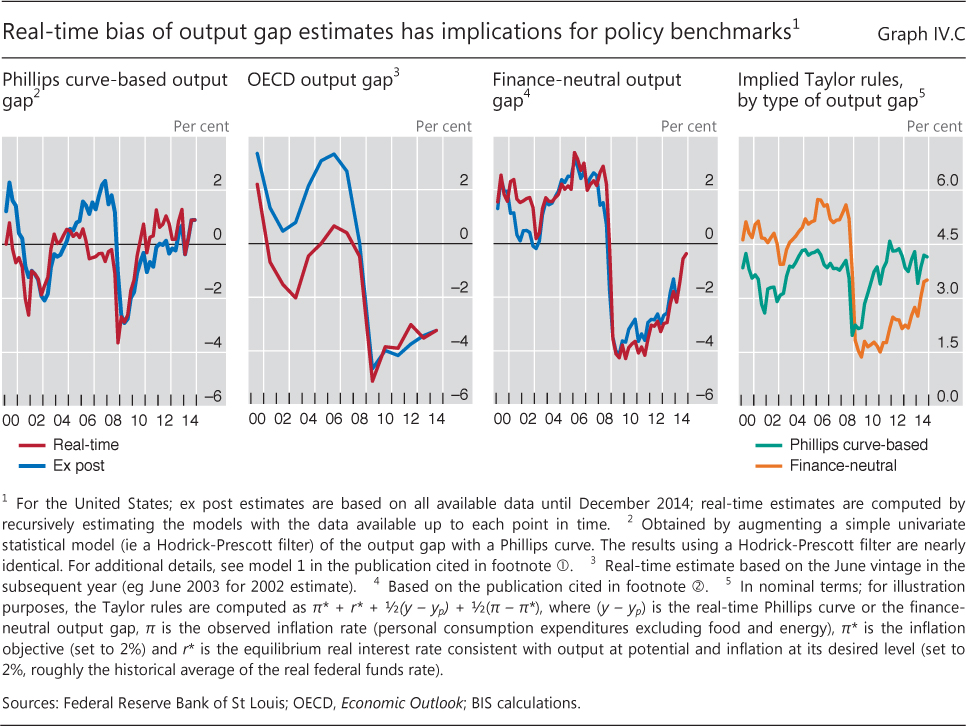
| IV.C | Real-time bias of output gap estimates has implications for policy benchmarks | p 81 |
| Chapter V: data behind the graphs (xlsx) | ||
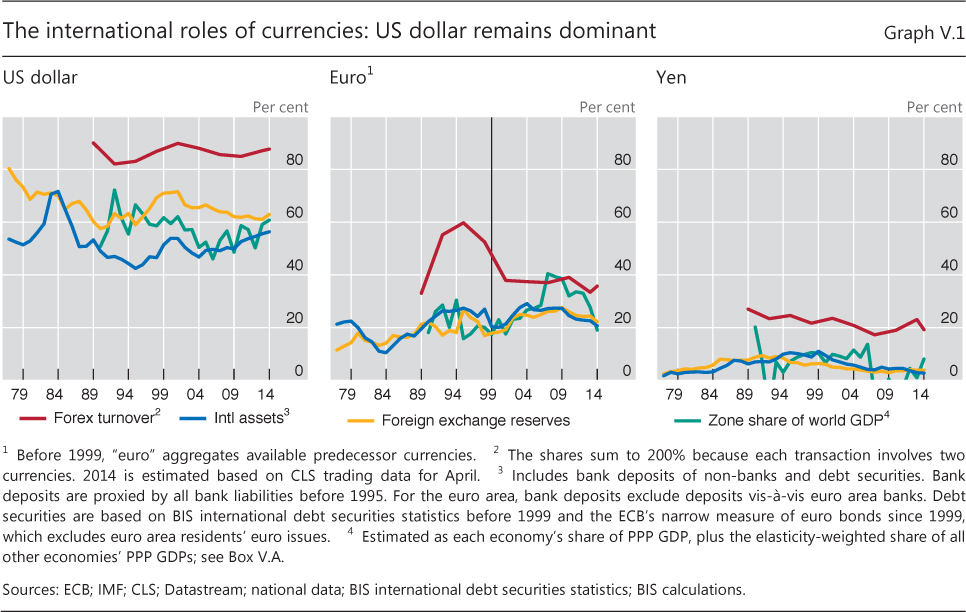
| V.1 | The international roles of currencies: US dollar remains dominant | p 86 |
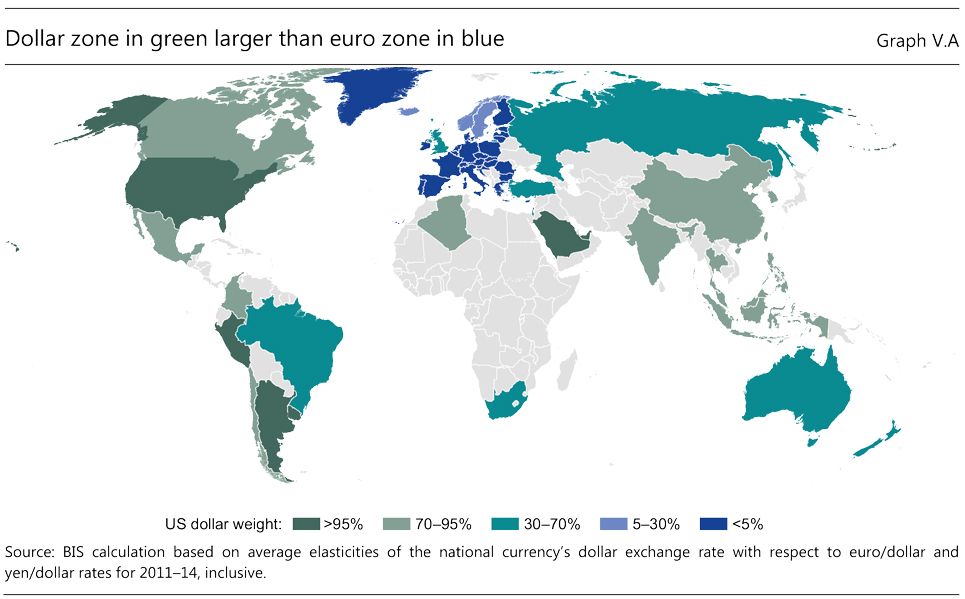
| V.A | Dollar zone in green larger than euro zone in blue | p 87 |
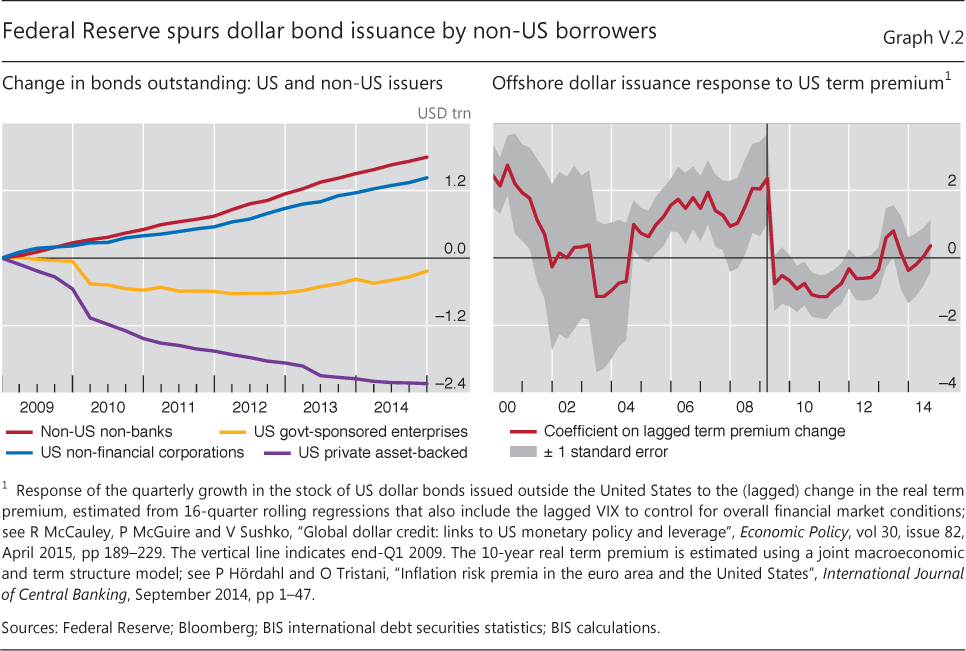
| V.2 | Federal Reserve spurs dollar bond issuance by non-US borrowers | p 88 |
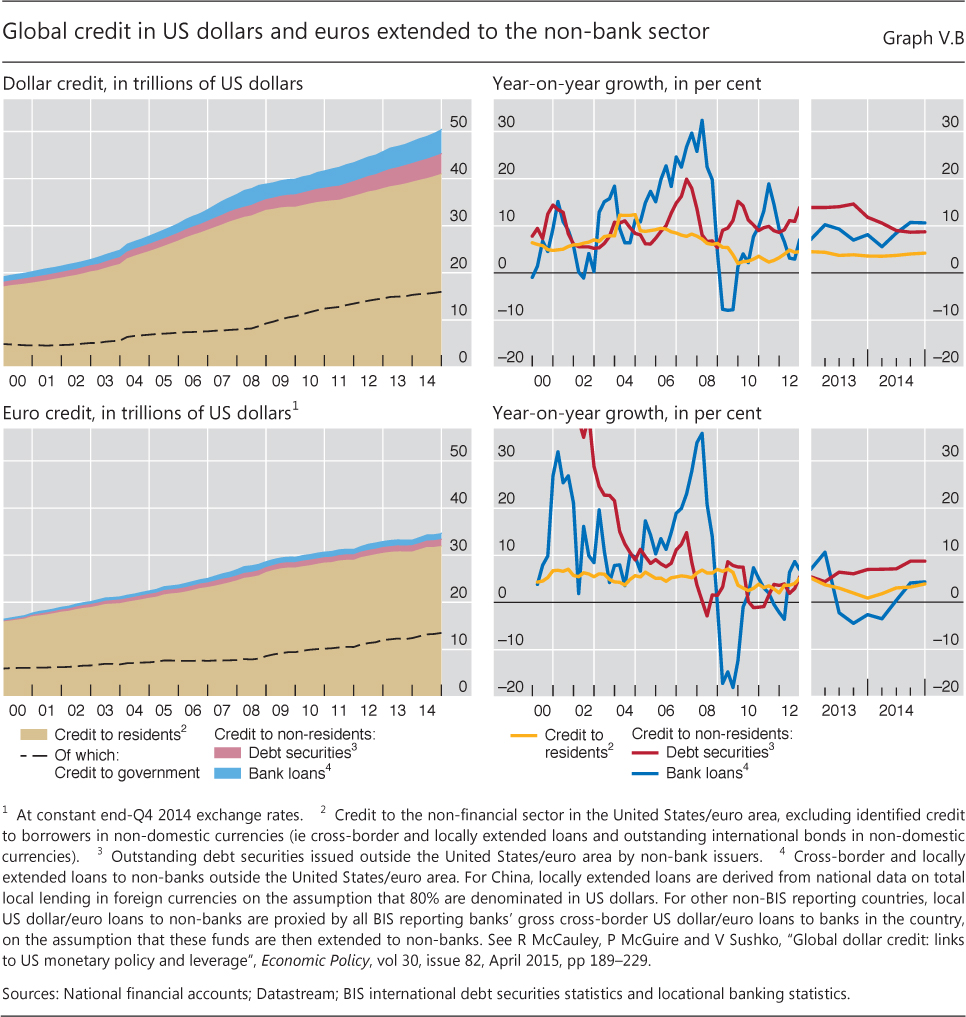
| V.B | Global credit in US dollars and euros extended to the non-bank sector | p 89 |
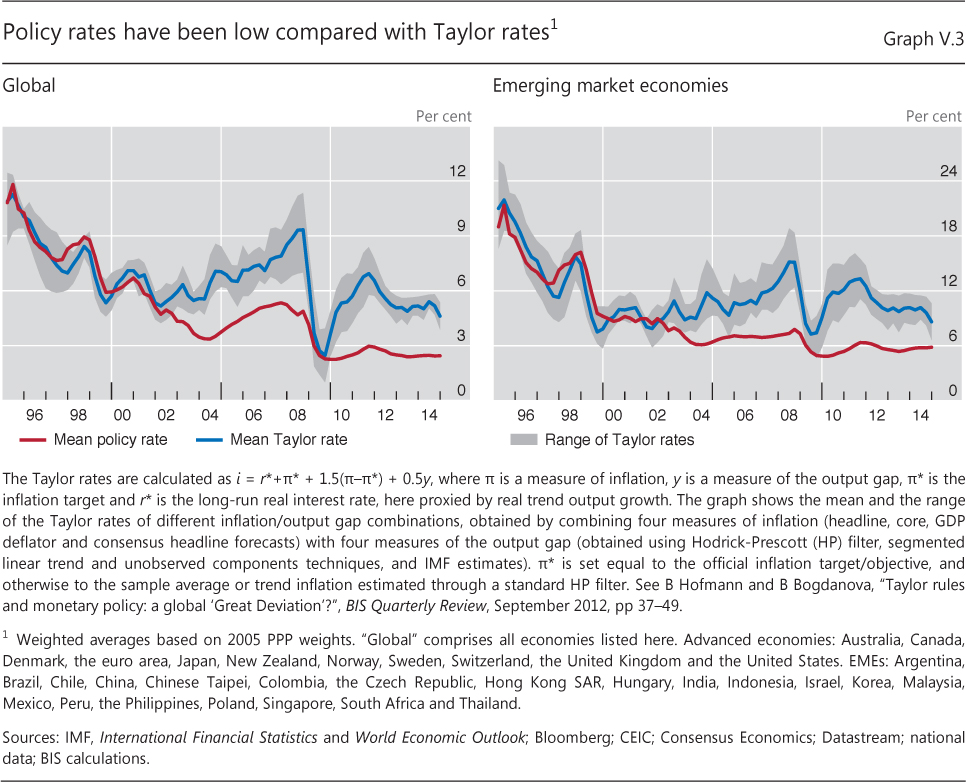
| V.3 | Policy rates have been low compared with Taylor rates | p 92 |
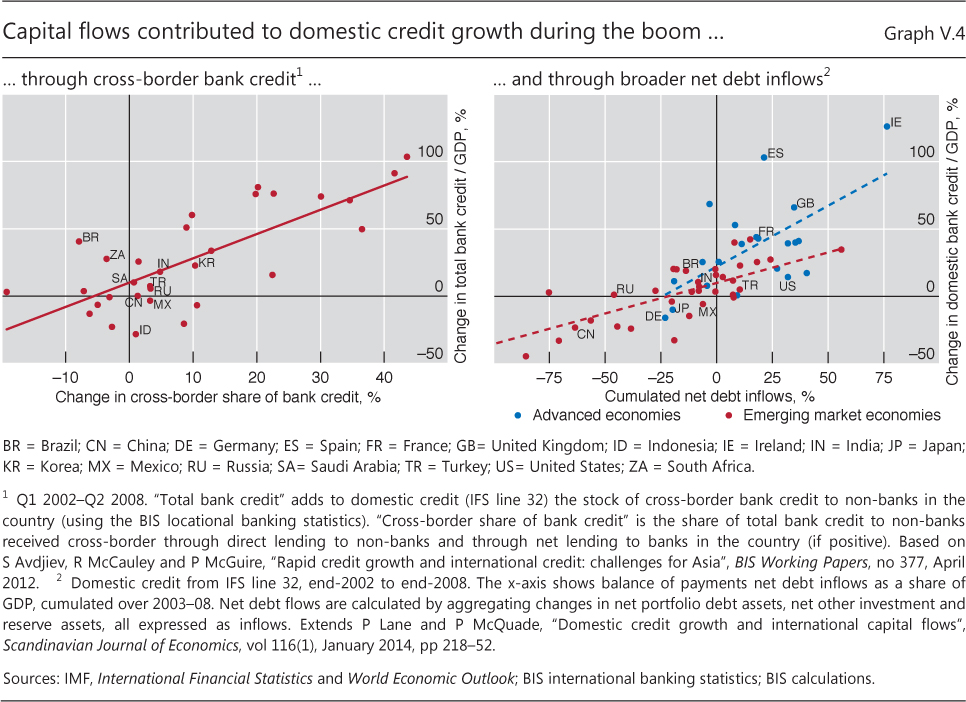
| V.4 | Capital flows contributed to domestic credit growth during the boom ... | p 93 |
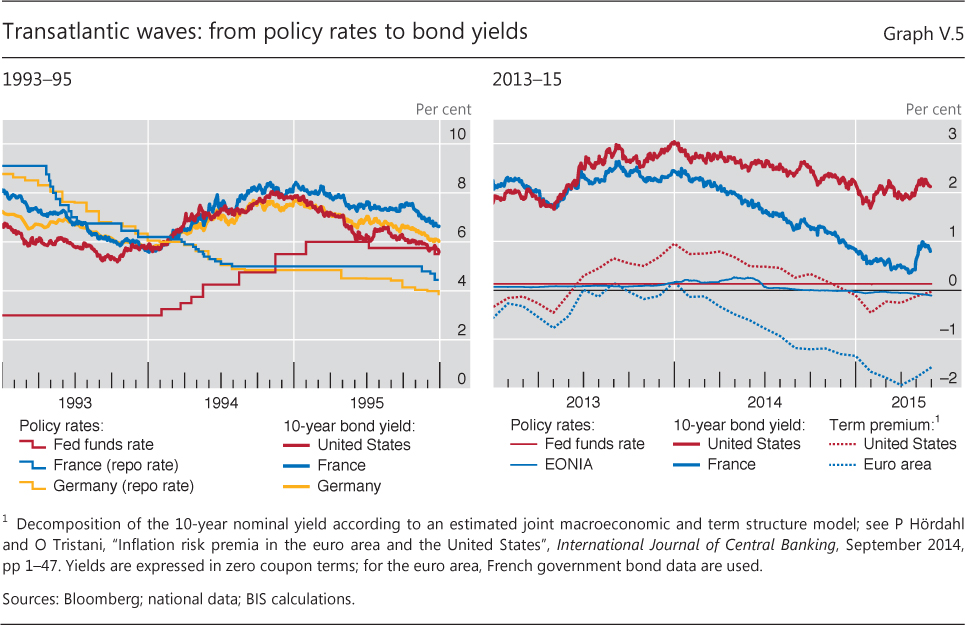
| V.5 | Transatlantic waves: from policy rates to bond yields | p 95 |
| Chapter VI: data behind the graphs (xlsx) | ||
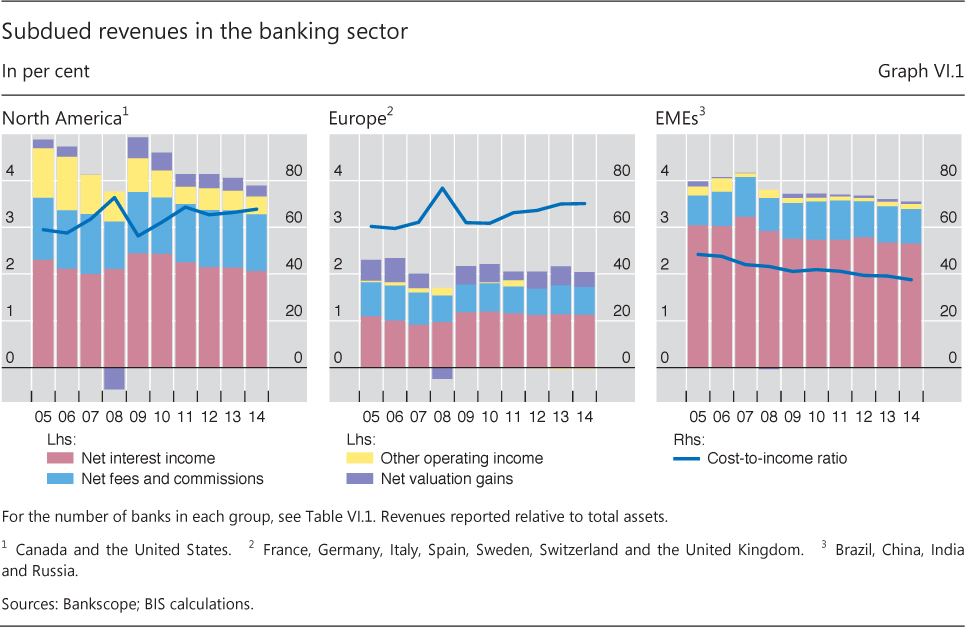
| VI.1 | Subdued revenues in the banking sector | p 103 |
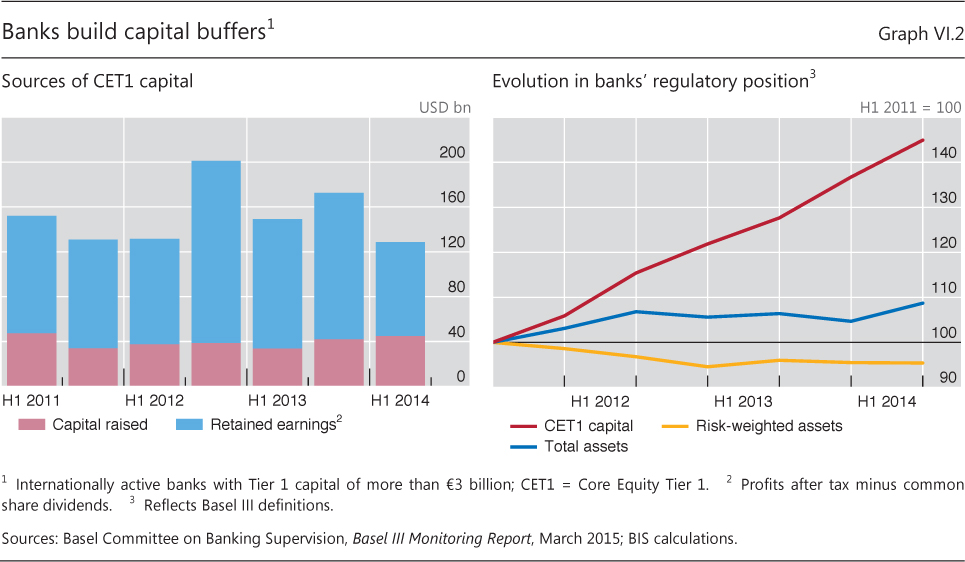
| VI.2 | Banks build capital buffers | p 103 |
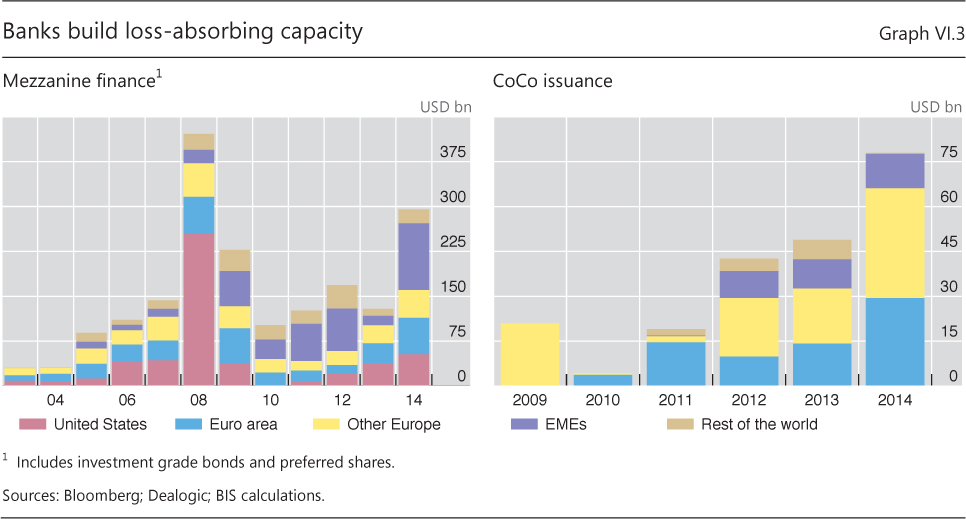
| VI.3 | Banks build loss-absorbing capacity | p 104 |
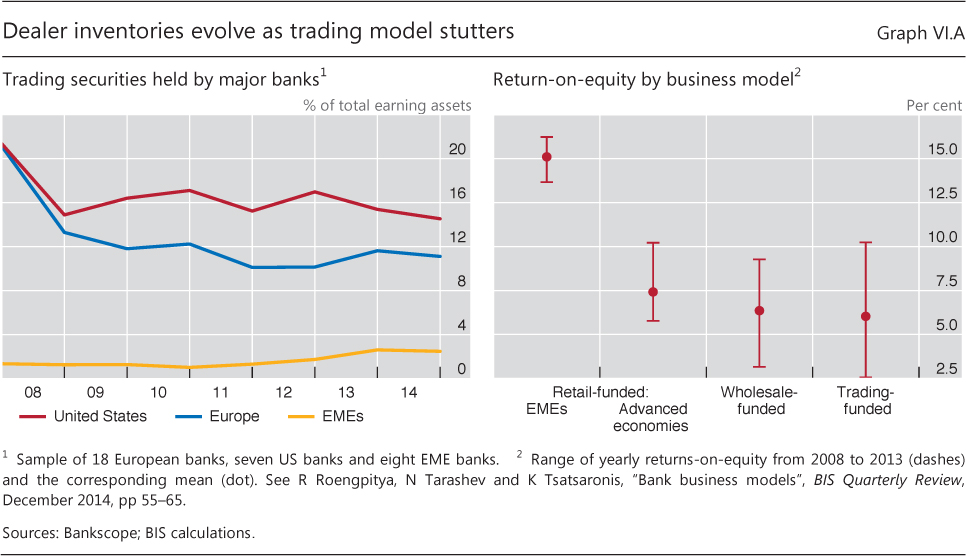
| VI.A | Dealer inventories evolve as trading model stutters | p 105 |
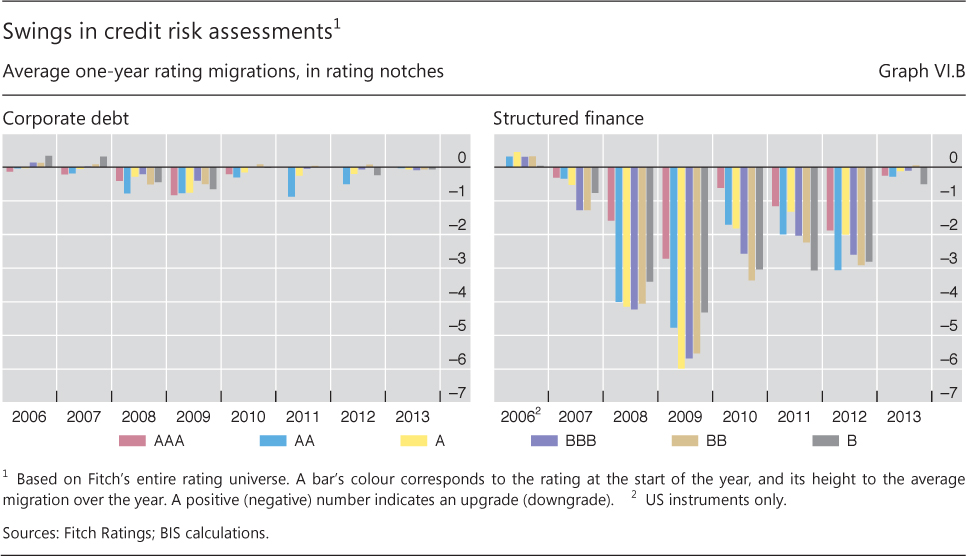
| VI.B | Swings in credit risk assessments | p 107 |
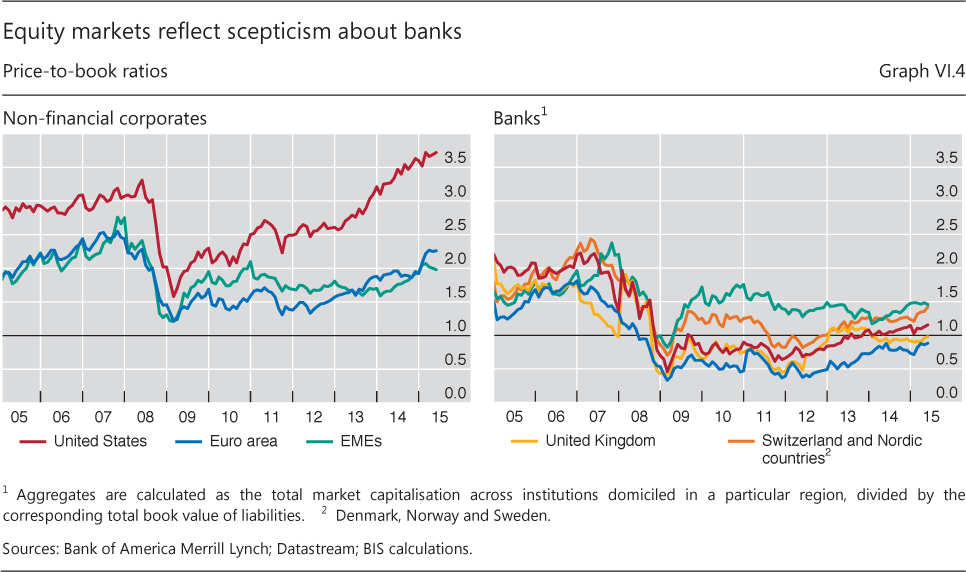
| VI.4 | Equity markets reflect scepticism about banks | p 108 |
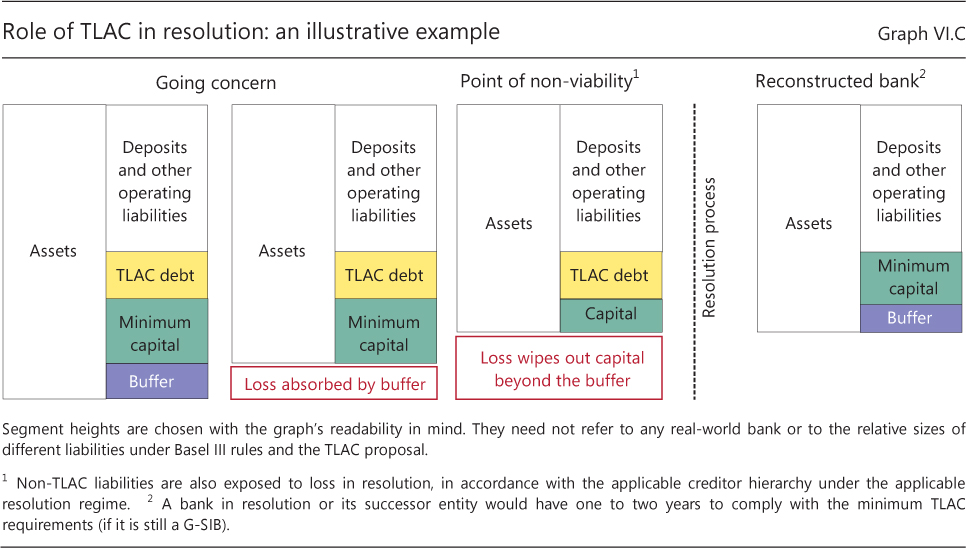
| VI.C | Role of TLAC in resolution: an illustrative example | p 109 |
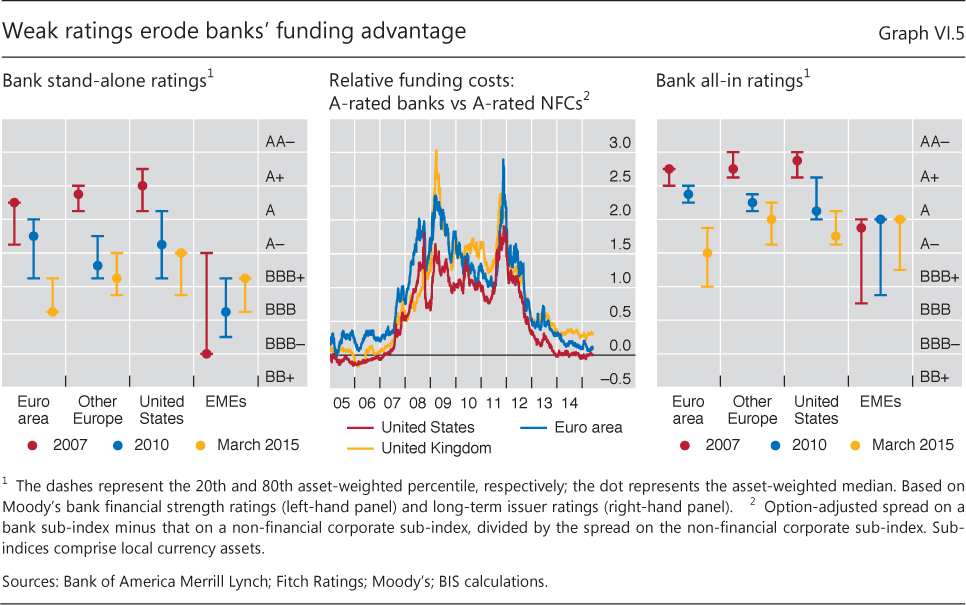
| VI.5 | Weak ratings erode banks' funding advantage | p 110 |
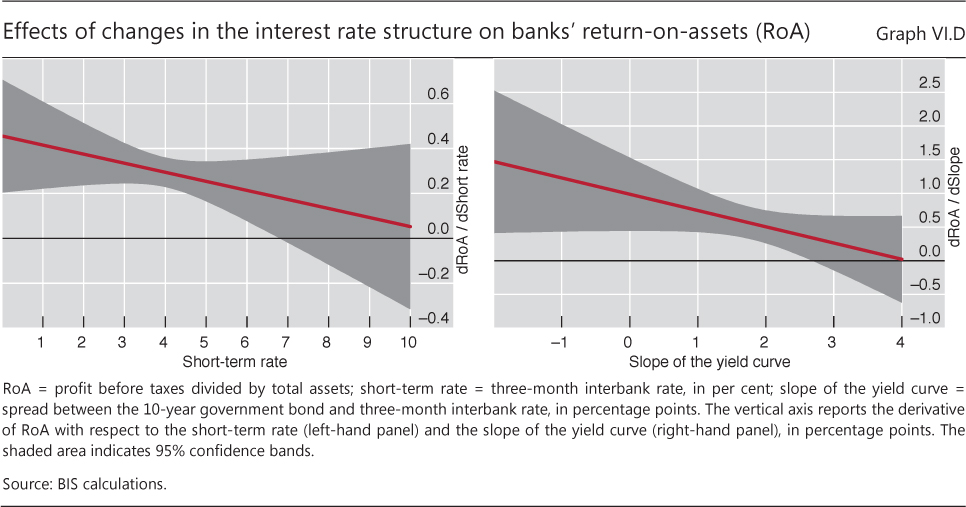
| VI.D | Effects of changes in the interest rate structure on banks' return-on-assets (RoA) | p 111 |
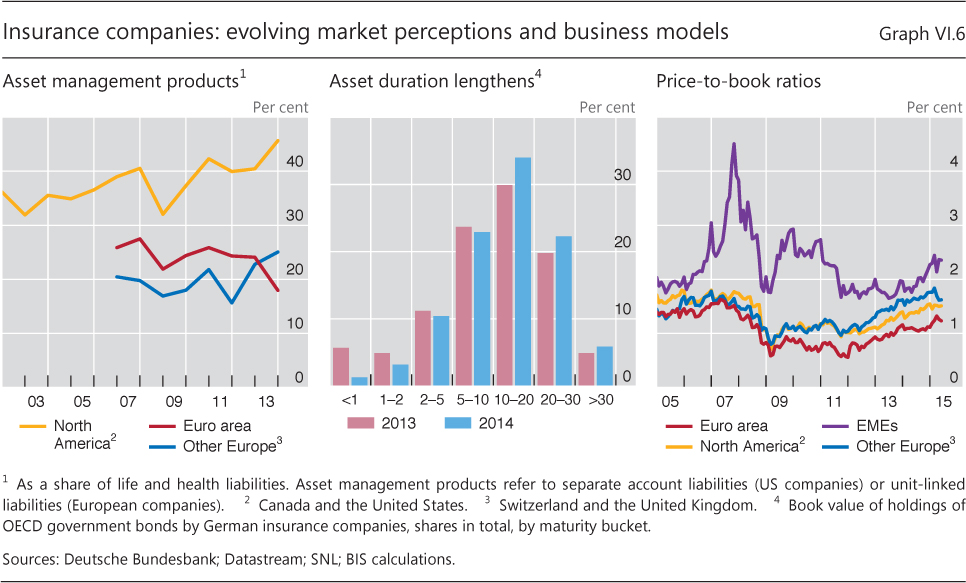
| VI.6 | Insurance companies: evolving market perceptions and business models | p 114 |
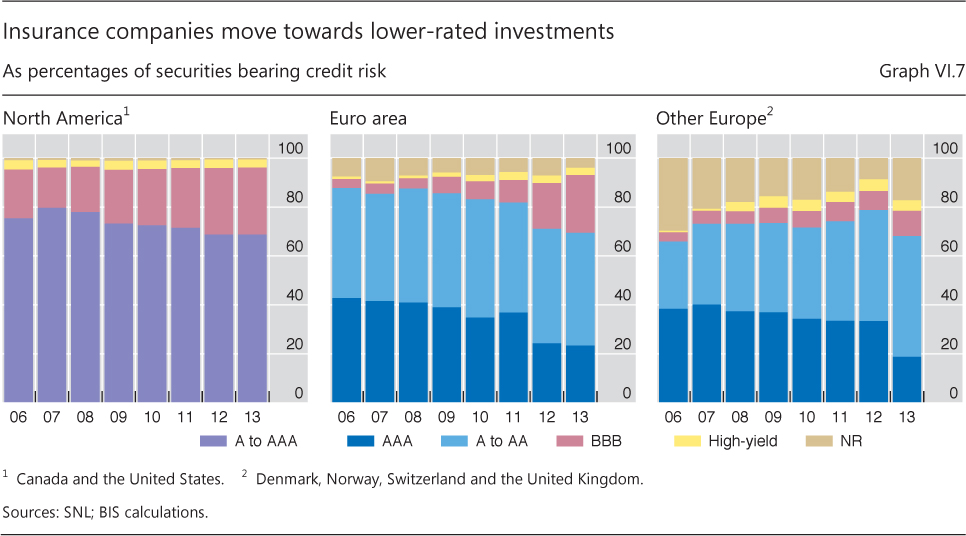
| VI.7 | Insurance companies move towards lower-rated investments | p 115 |
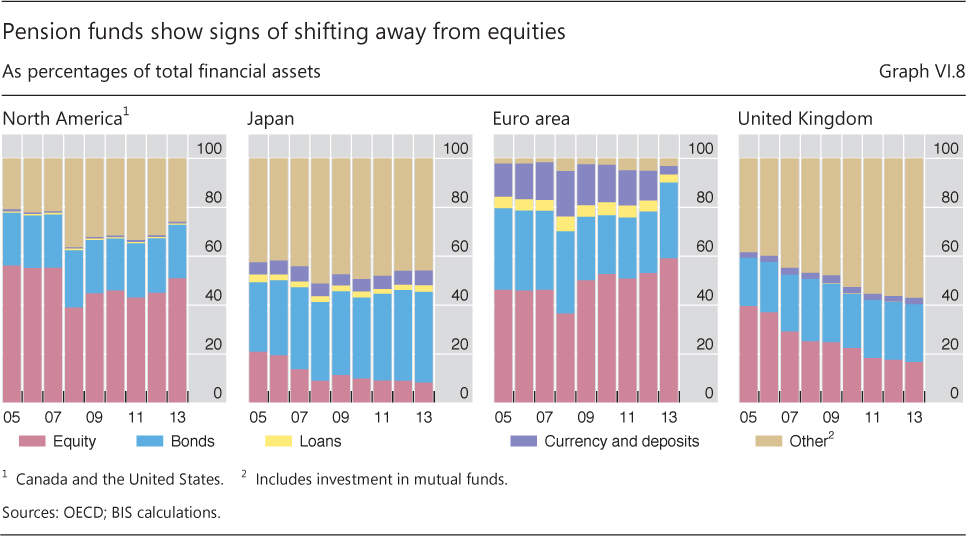
| VI.8 | Pension funds show signs of shifting away from equities | p 116 |
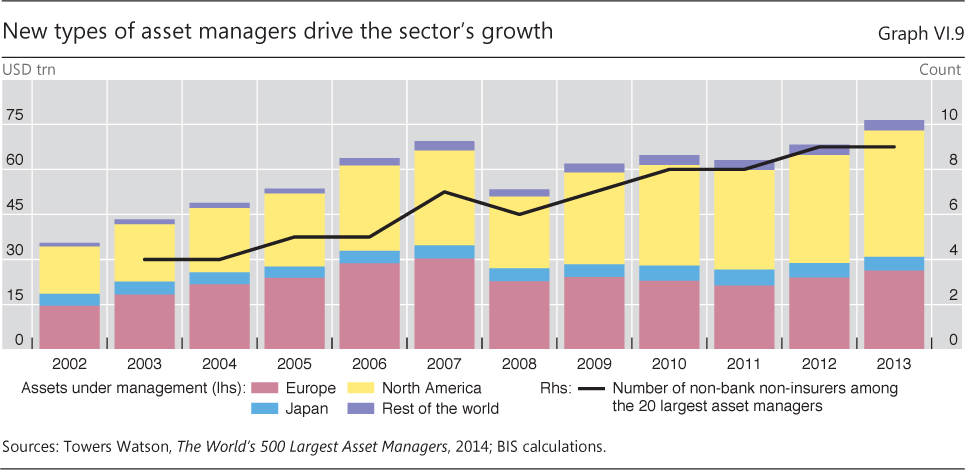
| VI.9 | New types of asset managers drive the sector's growth | p 117 |
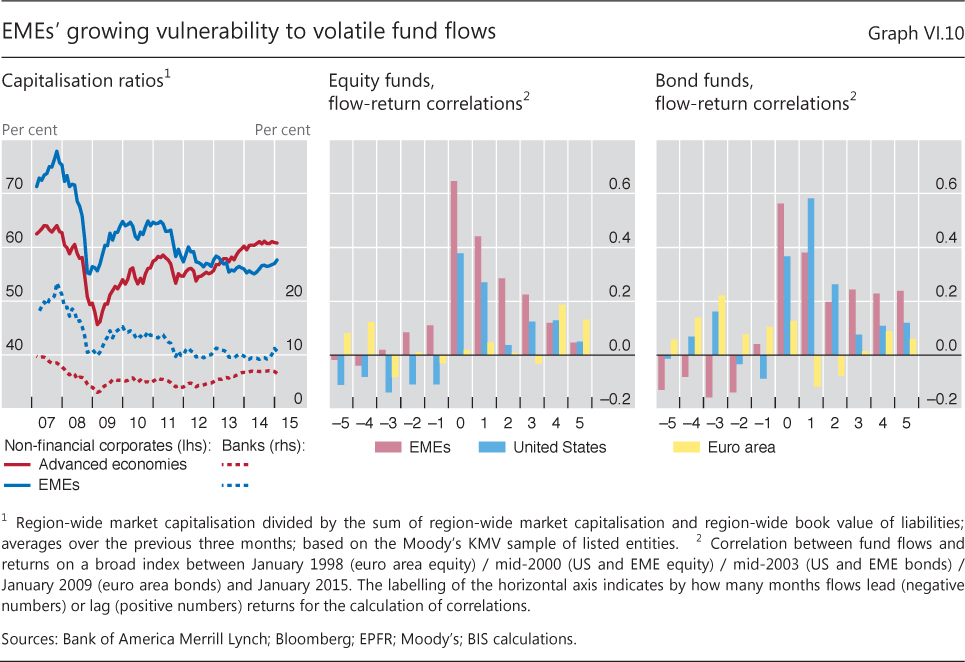
| VI.10 | EMEs' growing vulnerability to volatile fund flows | p 118 |