The rise and risks of synthetic risk transfers

Synthetic risk transfers (SRTs) are used by banks for capital and credit risk management. They have grown significantly in recent years but remain small relative to bank balance sheets. European banks have traditionally dominated SRT issuance, but their North American peers have seen an increase in issuance more recently. SRT-related risks appear to be modest at present. However, this may change as the market expands, structures become more complex and banks rely more heavily on non-bank financial institutions for credit protection. Limited and fragmented information heightens the potential for SRT-related risks to build undetected, highlighting the need for enhanced monitoring of risks for individual banks and from a systemwide perspective.1
JEL classification: G18, G21, G22, G23, G28.
Synthetic risk transfers (SRTs), once a niche securitisation tool for capital and credit risk management, have grown rapidly in recent years. These instruments allow banks to retain ownership of a portfolio of loans while transferring part of the credit risk to institutional investors by means of derivatives or guarantees. The growth in SRT issuance has facilitated the redistribution of risk from banks to non-bank financial institutions (NBFIs), thereby deepening the linkages between the two sectors.
This article provides an overview of SRT trends and their key drivers and assesses the potential risks of these instruments. A key contribution is to examine whether and under what conditions SRTs may have system-wide risk implications by creating new – or amplifying existing – channels of contagion in stress. The analysis builds on other recent SRT work (BCBS (2026); Cortes et al (2025); ESRB (2025)) and informs the debate on evolving business models and interlinkages between banks and NBFIs.
Three findings emerge from the analysis. First, SRTs have grown significantly in recent years. Issuance has increased fivefold since 2016, providing protection to loan portfolios of almost €800 billion as of end-2024. Around eight new banks have issued SRTs every year since 2016, raising the cumulative number of issuers above 100. This expansion, which has allowed banks to support lending to the real economy by transferring credit risk to NBFIs, was driven by regulatory and supervisory changes, bank balance sheet optimisation and increased demand from institutional investors.
Key takeaways
- The use of SRTs for bank capital and credit risk management has grown significantly in recent years, though the market remains concentrated and small relative to bank balance sheets.
- SRT-related risks appear to be modest at present. However, this may change as the market expands, structures become more complex and banks rely more heavily on NBFIs for credit protection.
- Limited and fragmented information heightens the potential for SRT-related risks to build undetected, highlighting the need for enhanced monitoring of risks for banks and from a system-wide perspective.
Notwithstanding this growth, the SRT market remains small and concentrated. These instruments protected around 2% or less of total bank loans in the European Union (EU), United States, United Kingdom and Canada at end-2024. They provided capital relief of around 43 basis points of Common Equity Tier 1 (CET1) for SRT-issuing banks, which is modest compared with sector-wide average CET1 levels of 14–16% in these jurisdictions. The SRT market is concentrated in terms of issuers (mostly EU banks), asset type (mostly corporate loans) and investors (mostly credit funds and asset managers), although it has become more diverse in recent years.
Second, SRT-related risks appear modest at present but could increase as the market expands. SRTs demonstrated resilience during recent episodes of market turbulence, owing to a more robust post-Great Financial Crisis (GFC) regulatory and supervisory framework, the credit quality of underlying portfolios and the alignment of banks' and investors' incentives. The main identified risks – procyclical dynamics from banks' reliance on NBFIs for credit protection, leverage and liquidity vulnerabilities among investors, and spillovers from bank-NBFI linkages – are still modest. However, this may change as SRT issuance activity grows, structures and risk transfer chains become more complex and banks rely more heavily on NBFIs for credit protection. In a stress scenario, SRTs may act as a transmission amplifier by tightening bank lending capacity and creating additional bank-NBFI adverse feedback loops.
Third, limited public disclosure and gaps in cross-sector and cross-border data – especially on investor funding structures, leverage and interlinkages – raise the risk that SRT-related vulnerabilities build up unnoticed. This underscores the need for more transparency and enhanced monitoring of these risks for individual banks and from a system-wide perspective. Regulators and supervisors should also guard against banks having to slow lending or let capital ratios fall if they cannot issue SRTs.
The rest of the article is structured as follows. The first section provides a brief introduction to SRTs and motivations for their use. The second examines global SRT trends and drivers. The third section analyses risks from a system-wide perspective. The article concludes with policy implications stemming from the findings.
The economics of SRTs
An SRT is a type of securitisation used by banks to transfer part of the credit risk associated with a pool of financial assets (typically loans) to investors. Those assets stay on the bank's balance sheet because the risk transfer takes place through a credit derivative or a financial guarantee. This arrangement differs from a cash or "true sale" securitisation, in which those assets are removed from the bank's balance sheet.
SRTs go by different names across jurisdictions. The Basel Framework refers to them as "synthetic securitisations", while other industry terms include "on-balance sheet securitisations" and "credit risk-sharing trades". In the EU and United Kingdom, the term "significant risk transfer" refers to both cash and synthetic securitisations that result in regulatory capital relief; in practice, most significant risk transfers are SRTs (ESRB (2025)). In the United States, the terms "capital relief trade" or "credit risk transfer" are also used.2
SRTs form part of banks' toolbox for managing their capital adequacy. At its most basic, increasing a bank's capital adequacy (CET1) ratio involves either increasing capital or reducing risk-weighted assets (RWA). Options for increasing capital include increasing retained earnings (through higher profitability or lower dividend distributions and share buybacks) or raising new equity. Options for reducing RWA include selling loans (directly or through true sale securitisations), hedging (using instruments such as SRTs, credit default swaps (CDS) or guarantees) or shifting to a lower-risk asset mix. In this context, SRTs are sometimes an easier and more costefficient solution than increasing capital, shrinking the balance sheet or selling (often illiquid) loans below their face value. They can also offer a more targeted approach than buying an index CDS on a public credit pool or obtaining credit insurance for an entire portfolio. By using SRTs, banks get the capital benefit as if they had sold the loan portfolio, but they retain ownership of the customer relationships.
SRTs are not used solely for regulatory capital relief. For example, banks may use SRTs for credit risk management by freeing up counterparty limits or reducing concentrations to particular industries, geographies or borrowers. Redeploying capital and enhancing lending capacity also enable banks to improve profitability.3
SRTs take three main forms (Graph 1). The first is a credit-linked note (CLN) on a reference pool of assets issued directly by the bank. The second is a financial guarantee or CDS on a portion of those assets between the bank and an investor. The third is a CLN issued by a special purpose vehicle (SPV) that has provided a guarantee or written CDS protection to the bank on the specific pool of assets. The issuance of a CLN, whether directly by the bank or indirectly by the SPV, allows the instrument to be sold more easily or pledged as collateral for repo financing (Cadwalader et al (2024); Parker (2025)).
Most SRTs today are funded or secured by financial collateral. The proceeds from the sale of the notes (for SPV-issued CLNs) or cash and high-quality securities collateral (for CDS and guarantees) are typically held by the bank itself or by a thirdparty custodian to cover any credit losses on an ongoing basis. This means that the bank has no counterparty risk to investor(s) or associated capital requirements.4
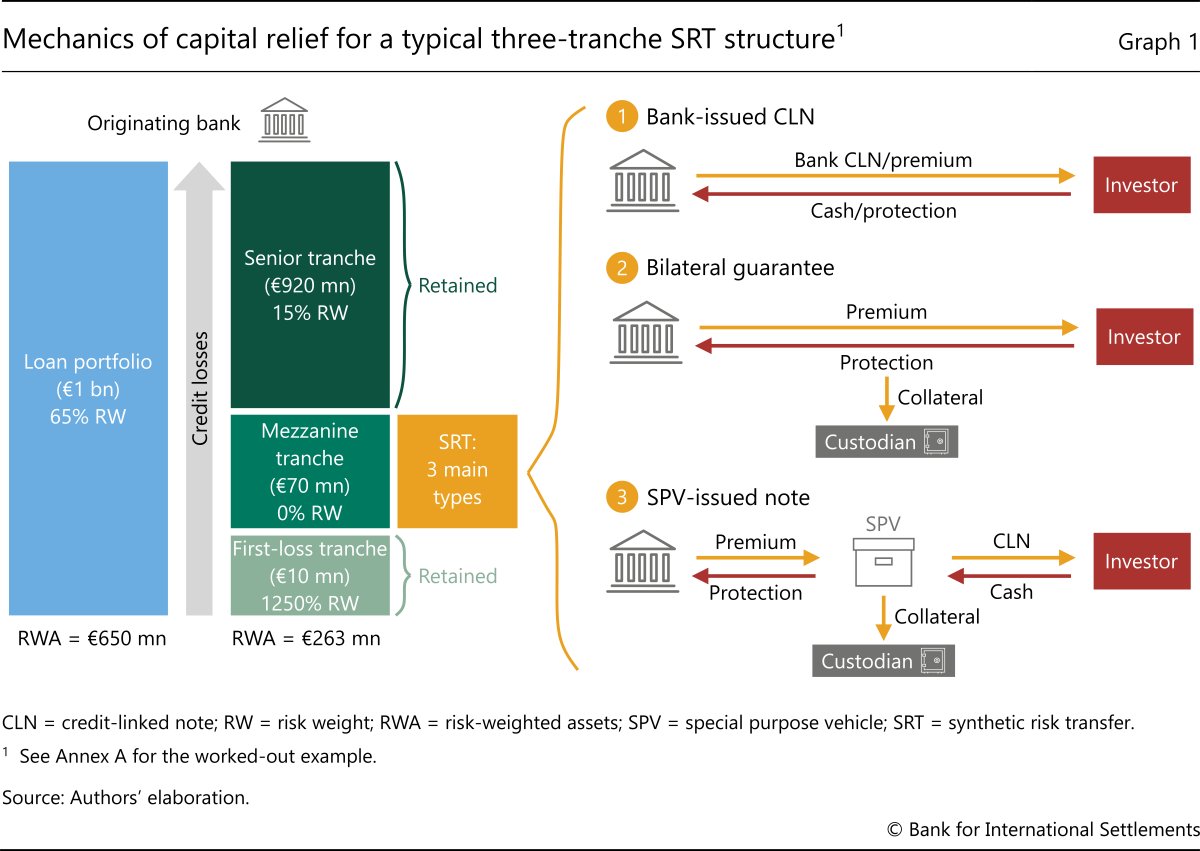
The originating bank pays a premium for credit protection. In a two-tranche SRT, it keeps the senior tranche and transfers the junior (first-loss) tranche to investors. In a three-tranche SRT, it transfers the mezzanine and sometimes the junior tranche. The return that the investor earns is the premium on credit protection plus the (floating rate) market return on the collateral. In the event of credit losses on the reference portfolio, the bank will write down the principal amount (for a CLN) or use the collateral to cover any losses, starting with the junior tranche. The bank is only exposed to loss when the protected tranche (in a two-tranche structure) is used up.
The economic appeal of SRTs for banks hinges on the tradeoff between the cost of protection and the regulatory capital relief benefit. Banks have an incentive to economise on capital so that they can increase their profitability for shareholders. They therefore prefer to transfer credit risk for loans whose regulatory capital requirements are deemed to be higher than their own assessment of riskiness (Osberghaus and Schepens (2025)). In such cases, the reduction in RWA – and the associated savings in required capital – can outweigh the protection premium paid to investors. Graph 1 shows how a bank, by obtaining protection on the mezzanine tranche, is able to reduce its RWA for a loan portfolio by almost 60% (from €650 million to €263 million). Whether the transaction also enhances the bank's return on RWA will depend on the loan portfolio's yield vis-à-vis the cost of protection. Annex A includes an example of an SRT transaction providing capital relief and enhancing RWA returns.
SRTs appeal to specialised credit market investors because of their risk-adjusted returns and diversification benefits. Investors are attracted by the opportunity to access generally high-quality, bank-originated loans they may not otherwise obtain (eg exposure to smaller borrowers that are unrated and do not issue in public markets). Investors are also attracted by operational efficiencies from reliance on the bank for loan origination, servicing and (if needed) workouts. Bankissued CLNs are general unsecured obligations, so investors in these instruments are also exposed to the bank's counterparty risk, which they need to manage.5
The use of leverage can enhance investor returns. SRT investments have embedded leverage, ie a higher amount of exposure per unit of invested capital, because the loan portfolio is sliced into tranches that differ in payment priority. This allows for the amplification of risk and return for investors. Some SRT investors also use financial leverage to further enhance their returns. This typically takes one of two forms: a repo by pledging the CLN as collateral, or borrowing against other investor assets (fund financing). In the former case, the investor borrows a fraction of the CLN's value as determined by the repo haircut. In the latter case, the investor typically borrows against the fund's underlying portfolio (net asset value (NAV) loans) or against investor commitments for subscription line or capital call facilities. The incentives to use financial leverage depend in part on the investor's target return and the SRT structure. When investors have absolute return hurdles (as in the case of hedge funds and some private credit funds) and the structure comprises high-quality assets, then investors may need to use leverage to achieve their return hurdle.
Market overview and trends
SRTs have existed for a long time, but they gained prominence after the GFC. These instruments first appeared in the 1990s with the emergence of bespoke credit derivatives such as CDS. The recognition of these instruments as credit risk mitigants in Basel II gave further impetus to their growth in the 2000s (Renault (2025)). The GFC caused issuance to collapse and eroded confidence in synthetic structures and securitisations (FSB (2025a)). SRTs re-emerged post-GFC, underpinned by prudential reforms as well as macroeconomic and market developments that facilitated broader adoption. These included: Basel III, which incentivised SRT use given generally higher risk-based capital requirements for banks; changes to jurisdictional regulatory and supervisory frameworks that supported SRT market activity;6 depressed bank equity valuations post-GFC, which enhanced the attractiveness of SRTs compared with issuing equity; and the growth of NBFIs and search for yield that led more investors – especially private credit funds and asset managers – to enter the market.
Monitoring developments in the global SRT market is challenging due to the scarcity of public information. Currently, there is no data repository or consistent regulatory reporting on issuance, pricing or credit performance across jurisdictions. Below, we combine information from various sources (bank reports, market surveys, commercial data providers and industry outreach) to provide a market overview.
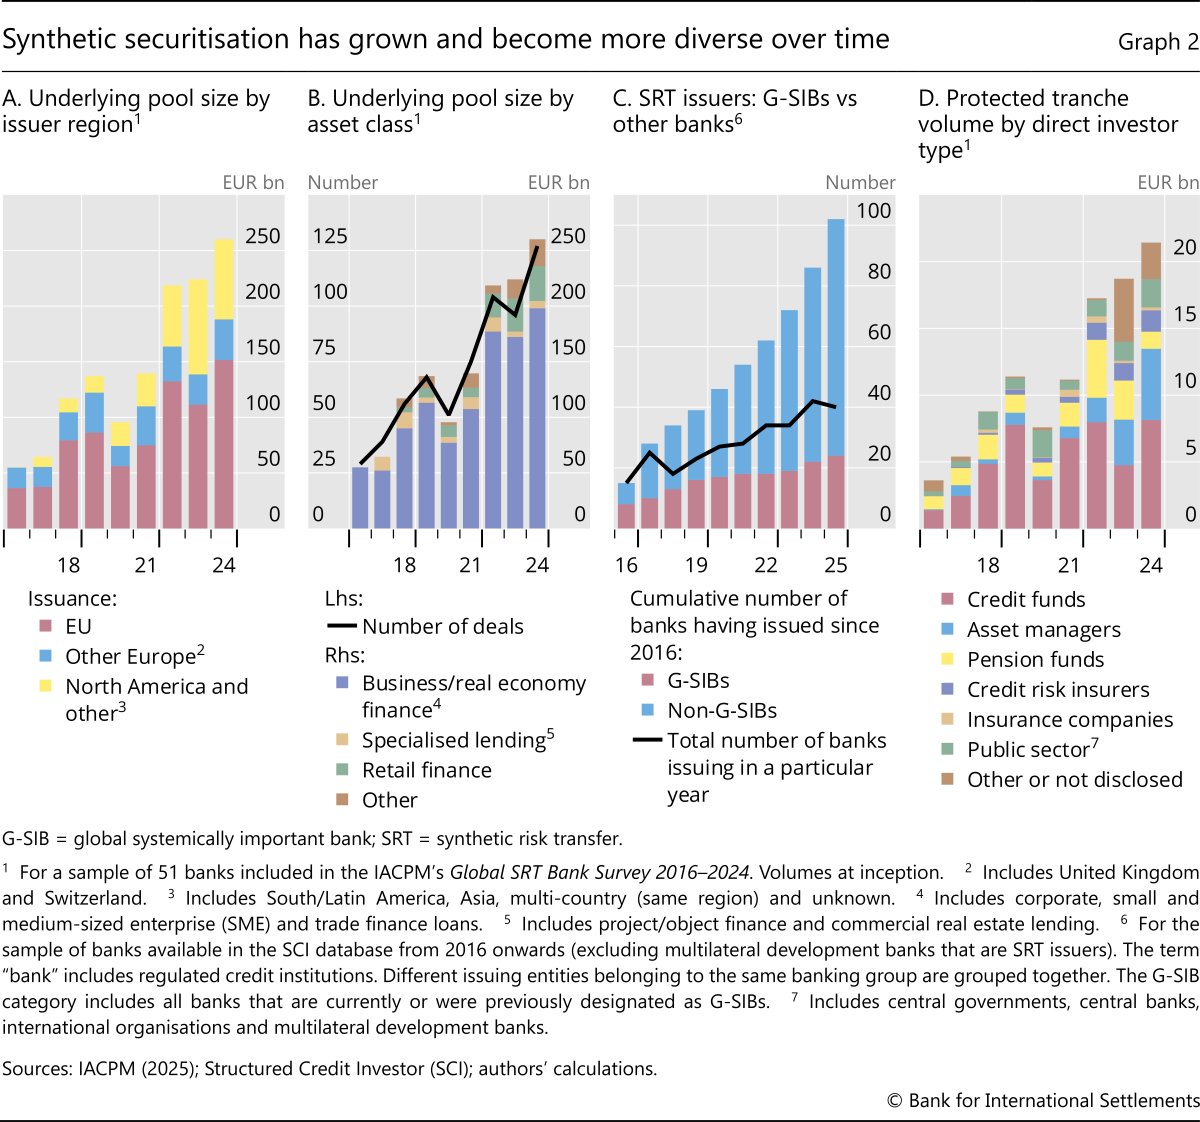
The global SRT market has expanded fivefold since the mid-2010s. According to the International Association of Credit Portfolio Managers (IACPM (2025)), the annual issuance of SRT tranches grew from less than €5 billion in 2016 to €21 billion in 2024. The tranches issued in 2024 provided protection to underlying loan portfolios amounting to €260 billion, compared with €55 billion in 2016 (Graph 2.A). Given an average SRT duration of three to five years, the total loan amount protected by all outstanding SRTs as of end-2024 was over €700 billion (IACPM (2025)). Estimates in this article, based on Pillar 3 disclosures, suggest that outstanding SRT loans amounted to almost €800 billion as of end-2024 (Graph 3.A), while market intelligence suggests continued growth in issuance in 2025.
Notwithstanding this growth, the global SRT market remains relatively small and concentrated in a few advanced economies. Assets protected by SRTs represented around 2% or less of total bank loans, or about 1% of consolidated total bank assets (BCBS (2026)), in the EU, United States, United Kingdom and Canada as of end-2024. The total loan amount protected is only a small proportion of the estimated global cash securitisation market (FSB (2025a)), though SRTs are more important in Europe (González and Triandafil (2023)).7 SRT market characteristics also differ between the United States and other jurisdictions such as the EU, reflecting distinct financial system structures and regulatory frameworks (Annex C).
Corporate loans remain by far the largest asset class in SRTs, though the range of protected loan types has expanded recently. In 2024, corporate and small and medium-sized enterprise (SME) loans accounted for almost 80% of total issuance (purple bars in Graph 2.B). These loans are a core part of bank portfolios, but they typically generate low returns as most bank income from these borrowers comes from ancillary products and services. Despite their generally good credit quality, banks are incentivised to include these loans in SRTs due to their fairly high capital charges. Over time, the range of loan types in reference portfolios has expanded to include auto loans and residential mortgages (retail finance), as well as capital call facilities, commercial real estate (CRE) and leveraged finance. This trend was supported by the entry of smaller banks8 and more US banks9 into the market.
The range of banks issuing SRTs has become increasingly diverse over time. SRT issuance was historically dominated by a few, mostly global systemically important banks (G-SIBs) in the EU and United Kingdom. Around eight new banks have entered the market annually since 2016, raising the total number of issuers above 100 (Graph 2.C). These banks are European and, to a lesser extent, North American.
Notwithstanding the broader range of issuing banks, the SRT market remains concentrated in terms of region, issuer and loan type. This is confirmed by analysing Pillar 3 disclosures of 44 SRT-issuing banks from Canada, Europe, Japan and the United Kingdom as of end-2024.10 First, EU-domiciled banks represent around half of the global outstanding SRT amount (Graph 3.A). Canadian, UK and US banks account for a sizeable portion of the market, while Japanese banks are less frequent issuers. Second, the top 10 issuers represent 64% of the total outstanding amount. Third, 90% of the protected assets in the sample are wholesale (largely corporate) loans.
A bank's asset size and capital adequacy help explain which banks issue SRTs. Annex B includes an analysis of 28 EU banks that issued SRTs (based on Pillar 3 disclosures as of end-2024) vis-à-vis their peers. A simple regression analysis examining the likelihood of a bank issuing SRTs, based on key fundamentals, highlights two important factors: bank size (total assets) and the CET1 ratio. Specifically, larger banks are more likely to issue SRTs since they have greater resources and expertise and can leverage economies of scale in structured finance. In addition, banks with lower capital adequacy levels are more likely to issue SRTs. For an EU bank with an 19% CET1 ratio (average of the sample), a 1 percentage point decrease in that ratio increases the likelihood that it will issue SRTs by 25 basis points.
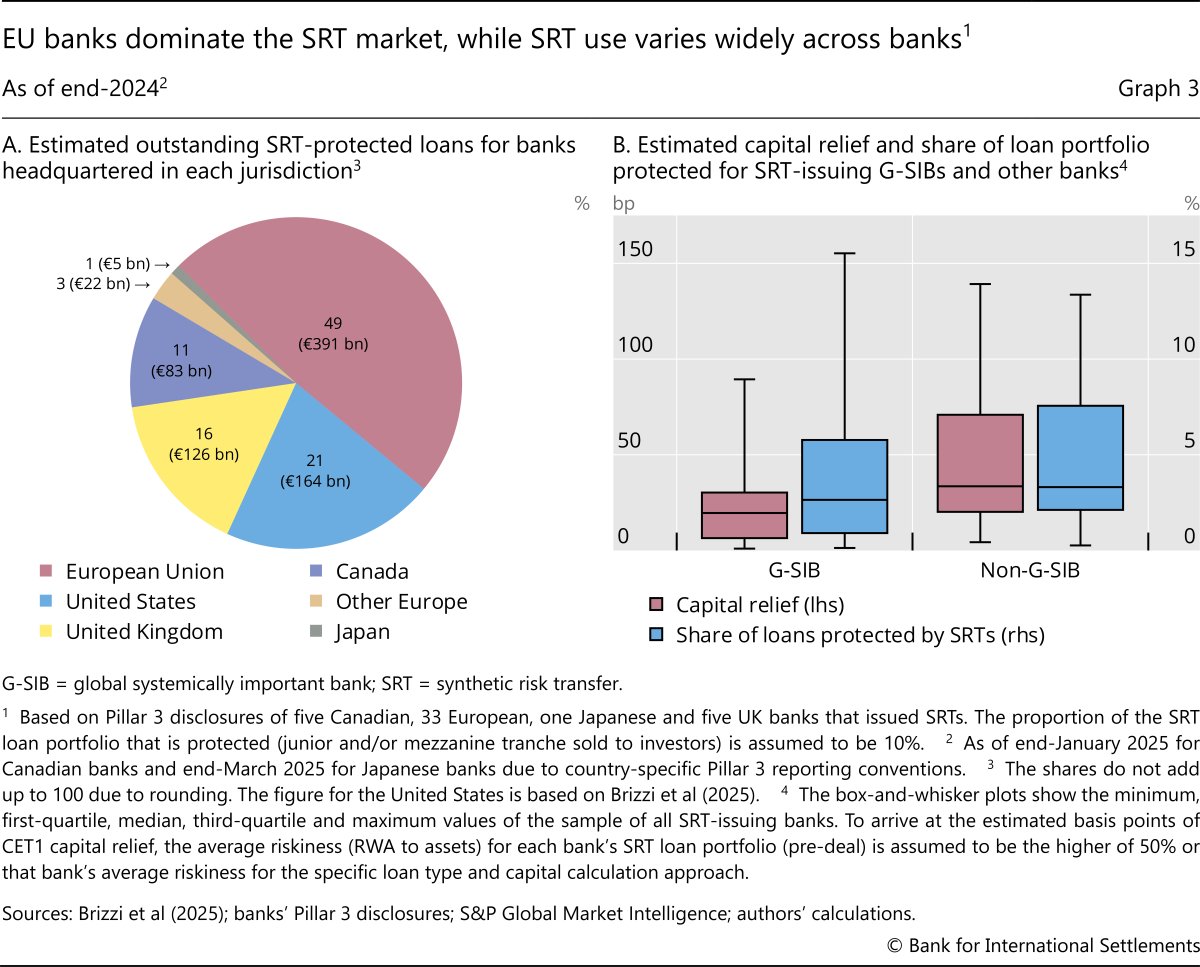
Only a few banks appear to be materially reliant on SRTs in terms of capital relief or the proportion of the loan portfolio protected (Graph 3.B). The average amount of capital relief for the sample of 44 SRT-issuing banks is estimated to be around 43 basis points of CET1 capital, though it exceeds 100 basis points in a few cases. This is a small portion of banks' CET1 ratio compared with a sector-wide average level of 14–16% in Canada, the EU and United Kingdom. Similarly, the average loan portfolio protected by SRTs for the 44 SRT-issuing banks is estimated to be only around 5% of their total loans, though it exceeds 10% for a few banks. The outliers are non-G-SIBs, even though in absolute terms G-SIBs account for half of the outstanding SRT amount.11 These outlier banks are not small: most are designated as domestic systemically important in their home jurisdiction. These banks may rely more on SRTs because of more limited access to capital markets and other credit portfolio management tools given their size and credit rating. Their smaller size also means that a typical SRT transaction (around €2 billion) tends to have greater capital impact.
Although the SRT investor base has expanded and become more diverse over time, it remains concentrated (Graph 2.D). Prior to the Covid-19 pandemic, a few specialised credit funds and pension funds accounted for three fourths of annual SRT investments. However, their share has declined more recently as private credit funds, hedge funds and large multi-strategy asset managers have entered the market.12 Supranational institutions currently represent around 10% of the investor base, with the aim of promoting SRT issuance by banks in less advanced economies or supporting specific activities (eg green or SME lending). Insurers account for less than 10% of SRT investments, offering mostly unfunded protection (liability side of their balance sheets).13 However, the total number of SRT investors is still limited and the market is concentrated (Cortes et al (2025)). In the United Kingdom, for example, the top 10 protection sellers accounted for nearly 60% of SRT volumes in recent years.
Some factors suggest that the SRT market will continue growing. More banks are turning to this instrument to optimise their balance sheet, enhance profitability and manage credit risk. New economic priorities (eg digitalisation, climate transition and defence) may raise loan demand and incentivise banks to make greater use of SRTs in some jurisdictions. Regulatory initiatives in the EU appear supportive of synthetic securitisation (Coelho et al (2025)). The growth of private credit funds and multistrategy asset managers provides additional pools of capital to invest in this market. Back-of-the-envelope calculations suggest scope for further growth (Box A).
SRT risks: a system-wide perspective
SRTs are generally better structured and subject to a more robust regulatory and supervisory framework than they were before the GFC. The reforms adopted following the 2008 crisis included better calibration of capital requirements for securitisation exposures, enhanced supervisory reviews, minimum risk retention requirements, reduced reliance on external credit ratings, stronger disclosures, and the discouragement or ban of re-securitisations (Coelho et al (2025); FSB (2025a); BCBS (2026)). These reforms have helped to align the incentives of banks and investors and ensure true risk transfer, materially strengthening the microprudential underpinnings of SRTs.
Against this background, the remainder of this section sets out emerging risks in the SRT market from a systemwide perspective. While these risks appear limited at present given the market's size and participant profiles, they warrant attention as issuance grows, structures evolve and bank-NBFI interlinkages deepen.
Rollover risk and procyclicality
The most direct source of risk stemming from SRTs is rollover (or flowback) risk for the issuing bank. Market intelligence suggests that banks generally structure SRT maturities to match or exceed the maturity profile of the underlying loans. Yet even when maturities are aligned, rollover risk can arise if the bank intends to maintain or expand lending beyond the SRT's maturity date and therefore needs to replace expiring protection (ESRB (2025)). Rollover risk tends to be more acute for banks with large, oneoff issuances or where multiple transactions mature in close succession. The concentrated nature of the SRT investor base amplifies this risk, as changes in risk appetite or funding conditions among a small group of investors can have outsized effects on issuance volumes and pricing.
Rollover risk implies that banks become vulnerable to shifts in investors' ability and willingness to provide new protection, potentially giving rise to greater procyclicality of credit supply. Banks may find such protection expensive or unavailable precisely when capital needs are greatest.14 A failure to extend protection would force banks to reduce lending growth or let their capital adequacy ratio decline. Tying banks' lending capacity to the SRT investor base suggests that, in the event of a broad economic downturn, the aggregate credit supply could become more procyclical and exacerbate the downturn (BCBS (2026)).
Such a risk has not materialised to date even during episodes of market turbulence. This can be attributed to the strong credit performance in underlying loan portfolios (EBA (2020)),15 the limited reliance so far on SRTs for managing banks' CET1 ratios and the absence of a "maturity wall" in which many SRTs mature at around the same time (EBA (2025)). The presence of dedicated funds that act as stabilising buyers in times of stress (such as during Covid-19) may also help mitigate this risk. Nevertheless, some supervisory authorities have highlighted the importance of incorporating flowback risk into bank capital planning frameworks (PRA (2025)) or have developed methodologies to assess and mitigate it (Finansinspektionen (2021)).
Investor leverage and liquidity risks
Leverage can lead to forced asset sales in times of stress, but the use of leverage in SRT investor portfolios appears to be modest.16 While public information on SRT investor leverage is unavailable, anecdotal evidence suggests that it remains limited. Banks confine SRT repo financing to a subset of investors and typically subject such financing to conservative safeguards: haircuts of 40–60%, daily margining and crosscollateralisation requirements that allow lenders to draw on other assets if needed.17 The seniority and over-collateralisation of financed positions, together with the lower mark-to-market volatility of SRT tranches compared with publicly traded structured credit, likely provide a meaningful buffer before losses are realised. Moreover, the bank providing the financing to the investor is subject to capital requirements for that exposure. Market intelligence suggests that SRT-financing banks are generally distinct from those issuing the instruments, though the fact that many of these banks are located in other jurisdictions complicates the monitoring of these exposures.
Further reading
Anecdotal evidence also indicates that liquidity mismatch among SRT investors is limited. SRT investments are generally held until maturity owing to their bespoke nature, small market size and, in some cases, transfer restrictions and confidentiality provisions tied to the underlying portfolios. Hence, in principle, liquidity mismatch in open-ended funds investing in SRTs may create run dynamics in times of stress (ESRB (2025)). However, this risk appears contained in practice: many SRT funds use closedend structures that allow them to manage redemptions without having to sell holdings. Most open-ended funds use an evergreen structure less exposed to disruptive redemptions,18 allocate a small fraction of their multi-asset portfolios to SRTs or manage redemptions through bank lines and internal liquidity buffers.
Interlinkages and risk transfer chains
The growing and increasingly complex risk transfer chains among SRT market participants can create hidden vulnerabilities (Table 1, Graph 4). These chains stem from the expanding set of bank issuers and investors, the broader range of financing structures and the diversity of loan types included in SRT portfolios. Linkages across banks, funds and other institutional investors take many forms and continue to evolve, reflecting the wider growth of bank-NBFI interconnectedness documented in recent work (Acharya et al (2024)).
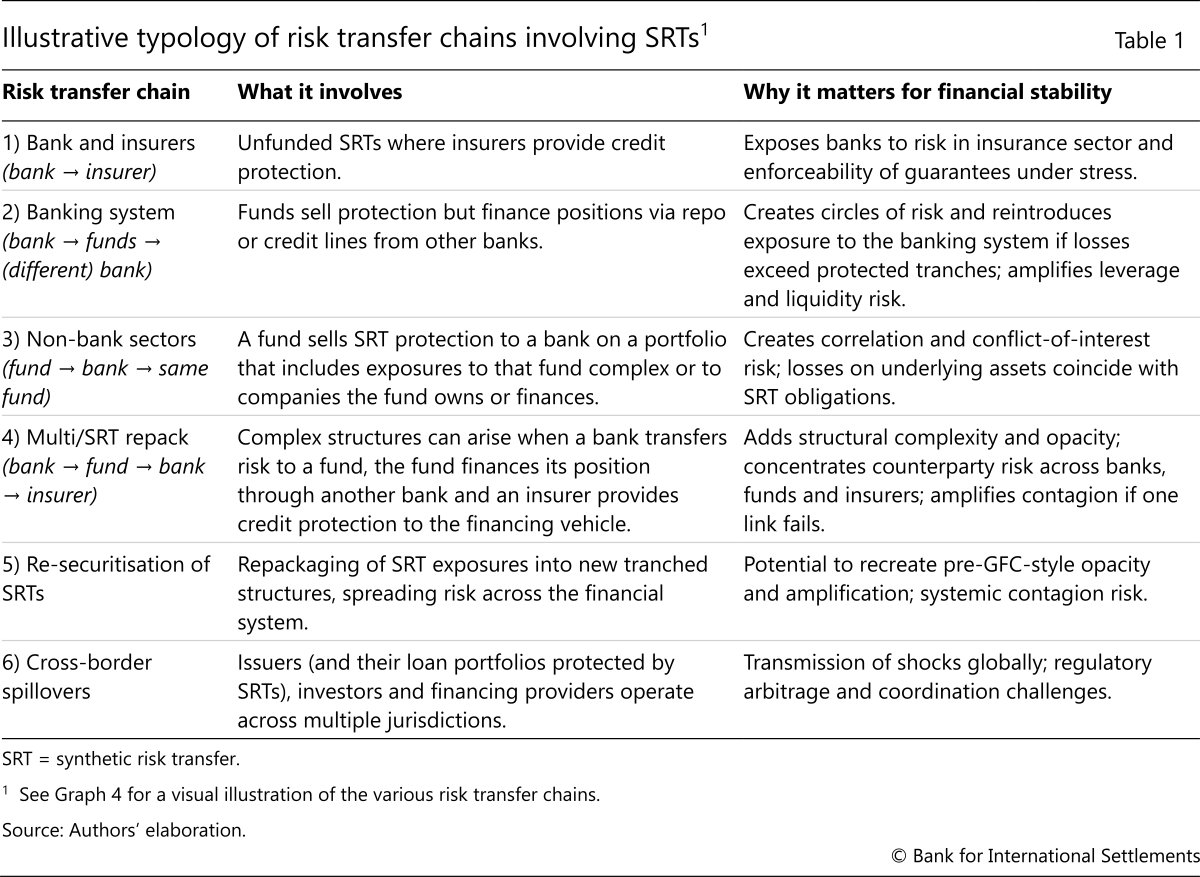
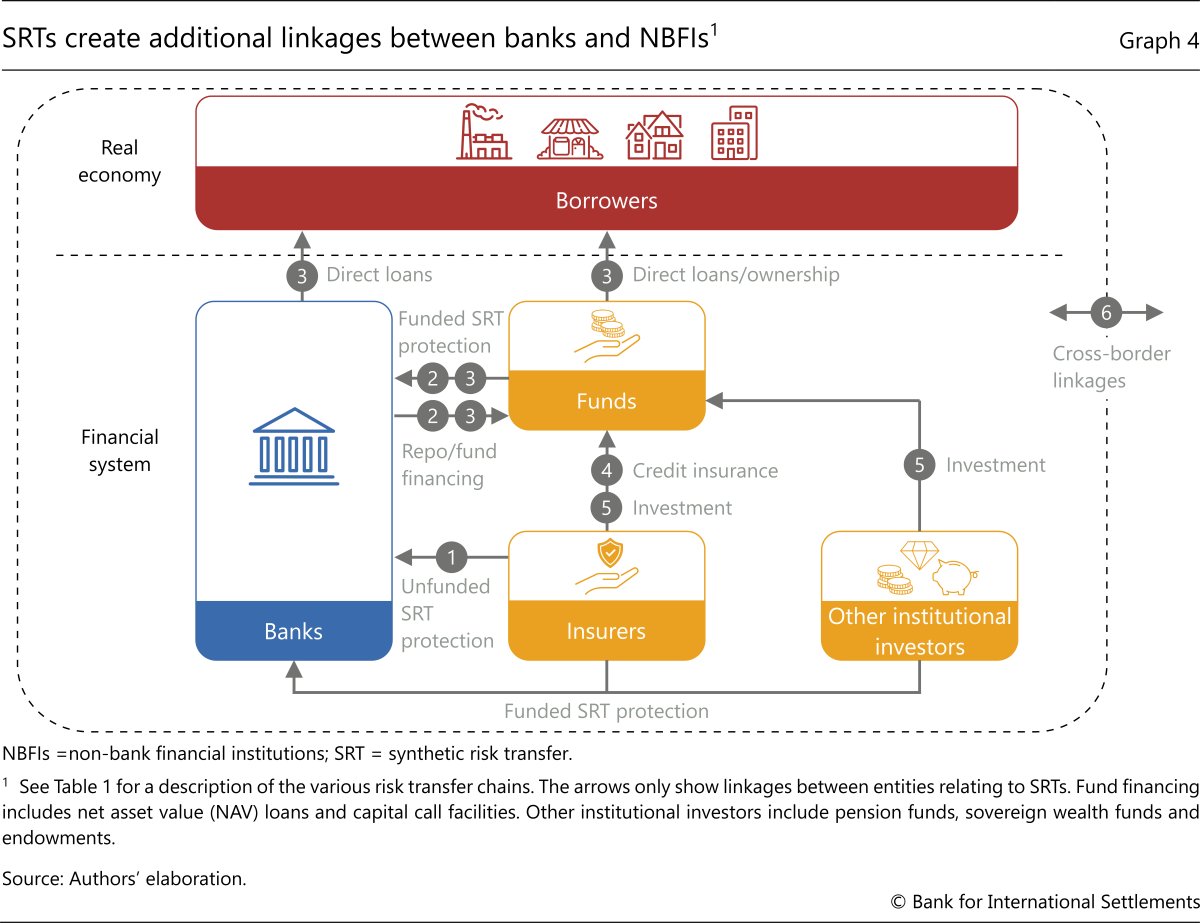
SRTs can create additional transmission channels during stress. One example is "circles of risk" (ESRB (2025)), where credit risk transferred from banks to funds via SRTs can return indirectly to the banking sector as a result of other banks financing the purchases of those investors (type 2 shown in Table 1 and Graph 4). In some transactions, the reference portfolio may include loans to firms that the fund owns or finances or the provision of capital call facilities to the private equity affiliates of those funds (type 3). This raises the risk of credit exposures ostensibly transferred out of the banking sector being indirectly reabsorbed. Repackaging of SRT exposures to other investors (types 4 and 5) adds further layers of complexity and can, in principle, recreate pre-GFC-type amplification mechanisms, although evidence to date of such structures and transmission channels is limited.
The transfer of credit risk across borders through SRTs (type 6) can enhance risk diversification, but it can also increase the transmission of shocks globally. For example, European and Japanese banks reportedly transfer credit risk through SRTs to US-based hedge funds and private credit funds while concurrently providing financing to some of those entities, creating the potential for negative feedback loops. Anecdotal evidence suggests that the scale of these loops remains modest.
Limited and fragmented information on interlinkages and risk transfer chains heightens the potential for SRT-related risks to build undetected. Authorities in many jurisdictions require notification or reserve the right to review SRTs as part of the supervisory process. However, opacity around investor characteristics, funding links and cross-border exposures limits authorities' ability to monitor concentrations, leverage and interconnectedness. This increases the likelihood that vulnerabilities remain unnoticed until stress materialises. In a hypothetical stress scenario, while SRTs would not be the primary shock driver, they could contribute to a procyclical tightening of bank lending capacity and enhance bank-NBFI adverse feedback loops.
Conclusion
SRTs are becoming a significant element of the evolving credit risk-sharing ecosystem between banks and NBFIs. The growth of SRTs carries both benefits and risks for financial stability. If done in a prudent manner, risk transfer can contribute to a more diverse and robust financing ecosystem. However, this depends on whether investors are well placed to assume the risk given their investment horizon, funding structure, sensitivity to marktomarket dynamics and ability to withstand losses in stress.
While the SRT market has been resilient in recent episodes of market turbulence, it has not yet experienced a prolonged credit market downturn. The main risk channels identified in this article – procyclical dynamics from banks' reliance on NBFIs for credit protection, leverage and liquidity vulnerabilities among investors and spillovers from bank-NBFI linkages – are still modest and evolving, but they highlight how SRTs can contribute to the transmission of shocks across the system.
Three main policy implications emerge from the analysis, reflecting both systemwide and banklevel considerations. First, greater transparency is needed to monitor SRT-related risks as the market continues to expand. This includes public disclosures of the capital impact of SRTs and enhanced informationsharing among authorities – including on a cross-border basis – on investor funding structures, leverage and interlinkages. Second, from a macroprudential perspective, the incorporation of SRTs into system-wide stress testing exercises could help shed light on bank-NBFI spillovers under severe but plausible scenarios. And third, at the microprudential level, regulatory and supervisory attention is needed to ensure that the expansion of SRTs does not expose banks to rollover risk and procyclical behaviour. The adoption of internationally consistent securitisation frameworks, together with policies to address NBFI vulnerabilities, would reinforce these safeguards.
Finally, this article raises some broader questions about the role of SRTs in the financial system. These include the extent to which SRTs support additional lending to the real economy; the degree to which their use is shaped by the interaction of capital rules, loan types and economic conditions; and their implications for the overall level and composition of capital in the banking sector. These issues fall beyond the scope of this analysis but merit further investigation.
References
Acharya, V, N Cetorelli and B Tuckman (2024): "Where do banks end and NBFIs begin?", NBER Working Paper, no 32316.
Basel Committee on Banking Supervision (BCBS) (2026): Synthetic risk transfers.
Brizzi, J, J Gerlach and J Kelly (2025): "Banking trends: synthetic risk transfers", Federal Reserve Bank of Philadelphia, Economic Insights, vol 10, no 3.
Cadwalader, KPMG and TWK Advisors LLC (2024): Credit risk transfers (CRTs) – A handbook for US banks.
Coelho, R, R Corrias and J-P Svoronos (2025): "Post-GFC securitisation reforms and new initiatives: a comparative analysis", FSI Insights on policy implementation, no 71.
Cortes, F, G Fernandez Dionis, Y Li, S Ramirez and X Zhang (2025): "Recycling risk: synthetic risk transfers", IMF Working Papers, no WP/25/200.
European Banking Authority (EBA) (2020): Report on STS framework for synthetic securitisation under Article 45 of Regulation (EU) 2017/2402.
----- (2025): Risk assessment report of the European Banking Authority.
European Systemic Risk Board (ESRB) (2025): Unveiling the impact of STS on-balance-sheet securitisation on EU financial stability.
Financial Stability Board (FSB) (2025a): Evaluation of the effects of the G20 financial regulatory reforms on securitisation – Final report.
----- (2025b): Enhancing the resilience of Nonbank financial intermediation – Progress report.
Finansinspektionen (2021): Updated Pillar 2 method for assessing flowback risk associated with securitisation.
González, F and C Triandafil (2023): "The European significant risk transfer securitisation market", ESRB Occasional Paper Series, no 23.
International Association of Credit Portfolio Managers (IACPM) (2025): Global SRT Bank Survey 2016–2024.
Klein, P, A Nitschke and A Pfingsten (2025): Financing the green transition: A case for synthetic capital relief trades.
Moody's (2025): Rating methodology: Banks.
Osberghaus, A and G Schepens (2025): "Synthetic, but how much risk transfer?", unpublished working paper.
Parker, E (2025): "Synthetic risk transfer SRT in 2025", Insights, Mayer Brown.
Pennacchi, G and J Santos (2021): "Why do banks target ROE?", Journal of Financial Stability, vol 54, June.
Prudential Regulation Authority (PRA) (2025): Significant risk transfer financing: Prudential expectations.
Renault, O (2025): "Significant risk transfer (SRT) Chronicles 2025", Pemberton.
Seer Capital (2025): Reg Cap leverage: clearing misconceptions.
Annex A
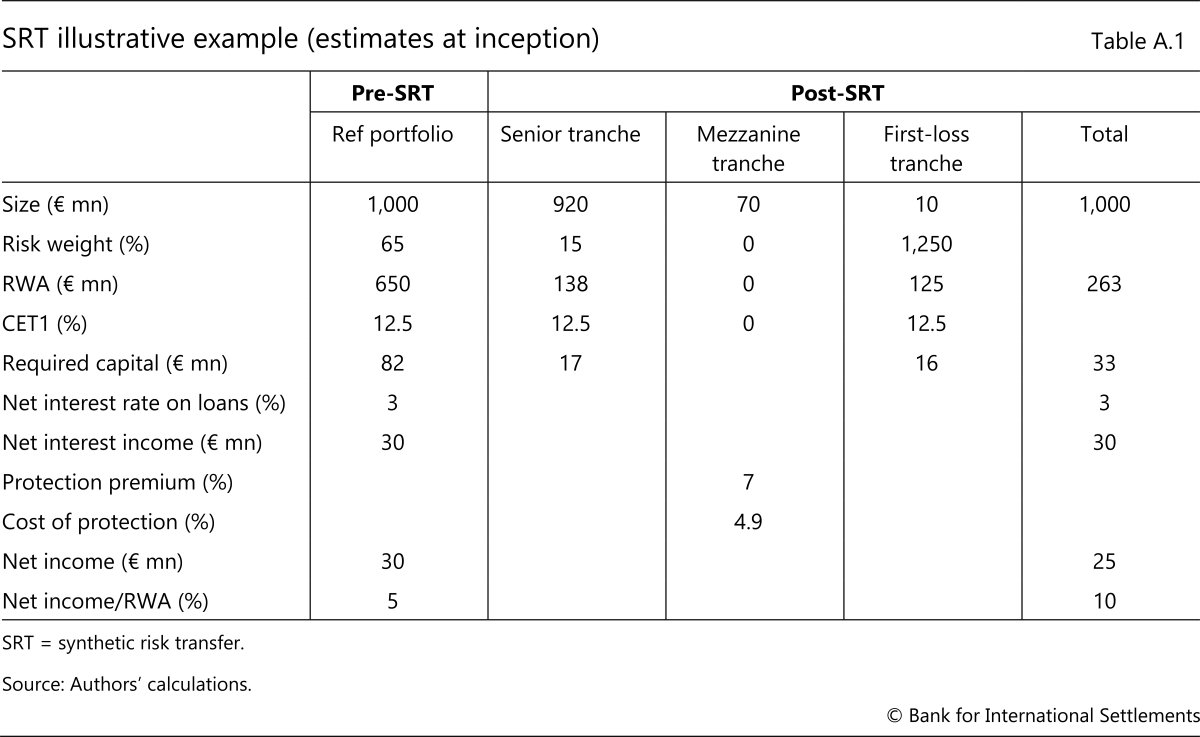
This annex demonstrates how banks can use SRTs to reduce the risk weight of a loan portfolio, thereby improving their capital adequacy ratio and return (all other things equal). The calculations of RWA and net income have been simplified by excluding accounting, tax, amortisation, expected loss and capital redeployment considerations.
Impact on RWA and required capital. Consider Bank A, which holds a €1 billion portfolio of loans on its balance sheet, with a risk weight of 65%. To reduce its RWA, Bank A slices the portfolio into three tranches: the junior (first-loss) tranche, the mezzanine tranche and the senior tranche, with tranche sizes of 1%, 7% and 92%, respectively. Bank A retains the senior tranche, representing €920 million of the exposure, which carries a risk weight of 15% as per EU capital rules. The bank also retains the first-loss tranche (1% of portfolio), which is subject to a 1,250% risk weight assigned to highly risky junior securitisation tranches. The mezzanine tranche (7%) is hedged through a CLN sold to investors, reducing its risk weight to 0%. As a result, Bank A reduces its RWA from €650 billion to €263 million (Table A1). Assuming a 12.5% CET1 ratio, the use of the SRT allows the bank to lower its required capital to €33 million (€263 million × 12.5%), compared with €82 million without the SRT.
Impact on income. Assume Bank A charges borrowers a 3% interest rate on its loan portfolio (net of funding costs), generating an annual income of €30 million. While net income is the same after implementing the SRT, Bank A hedges a portion of the credit risk at a premium of 7%, which costs €5 million. Consequently, its postSRT net income decreases to €25 million. However, owing to the reduction in RWA, the bank's net income as a percentage of RWA rises from 5% pre-SRT to 10% post-SRT.
Annex B
This Annex aims to shed light on the characteristics of banks that have issued an SRT. The analysis focuses on EU banks given the large sample and uniform disclosures and regulatory framework.19 It highlights differences in financial indicators between banks that issued SRTs and those that did not in 2024. Several observations are worth noting.
First, banks that issued SRTs were generally larger in size. The median total assets of the 28 SRT-issuing banks exceeded €290 billion, which is more than four times the size of the 78 non-SRT-issuing banks. This is not surprising, as larger banks typically have greater resources and benefit from scale in structured finance. In addition, the fixed costs associated with issuing SRTs can be prohibitively high for smaller banks.
Second, on average, SRT-issuing banks tended to have lower CET1 ratios compared with their non-SRT-issuing counterparts (Graph B.1.A). All else being equal, banks with lower CET1 ratios would be expected to use SRTs to enhance their capital ratios.
Third, publicly listed SRT-issuing banks, on average, have a lower price-to-book ratio (PBR) compared with non-SRT-issuing banks (Graph B.1.B).20 A lower PBR means that issuing common equity may dilute value for existing shareholders and could trigger an unfavourable market reaction. Consequently, banks with lower PBRs are more likely to reduce RWA using SRTs to help raise their CET1 ratio.
Fourth, SRT-issuing banks tend to have a higher return-on-equity (RoE) (Graph B.1.C). However, there is a causality issue to consider. On one hand, SRTs can enable banks to free up capital, allowing them to engage in more profitable activities and thereby enhancing their RoE. This is particularly relevant for banks that prioritise RoE over earnings in their performance targets (Pennacchi and Santos (2021)). On the other hand, investors are more inclined to provide credit protection to banks that are perceived to be more resilient because they report higher profitability.
Fifth, SRT-issuing banks exhibit higher loan concentration, defined as the ratio of corporate to total loans (Graph B.1.D). This aligns with market observations suggesting that banks use SRTs mainly for corporate loans to manage concentration risks and optimise their overall capital structure.
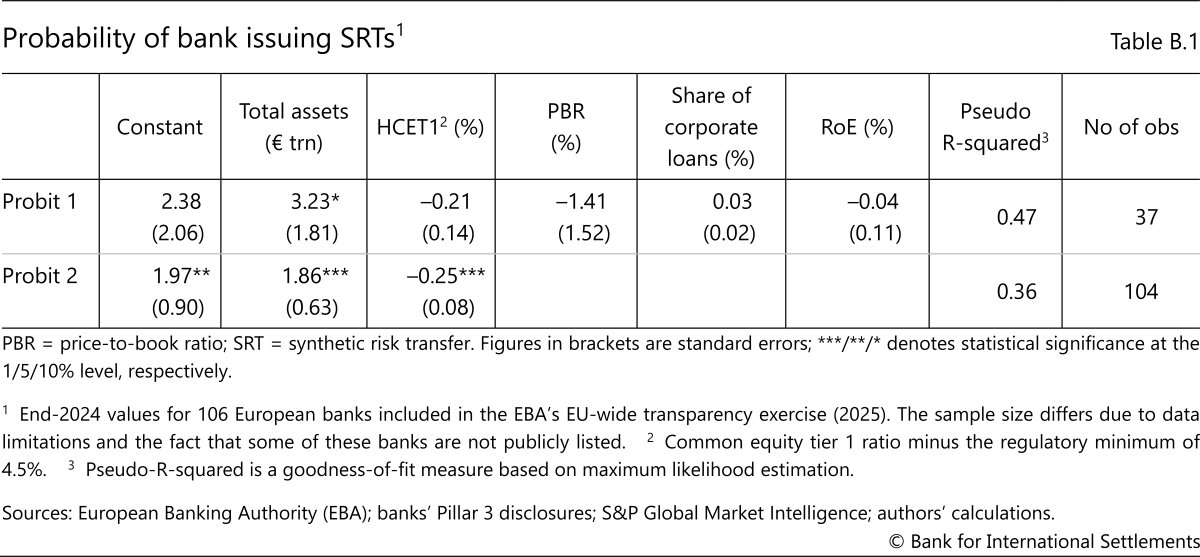
To assess how various factors influence the probability of a bank issuing SRTs, we estimate the following probit model:21
Prob (SRT issuancei > 0) = Φ(constant + βi × financial strength variablei ), where Φ(·) represents the standard normal cumulative distribution.
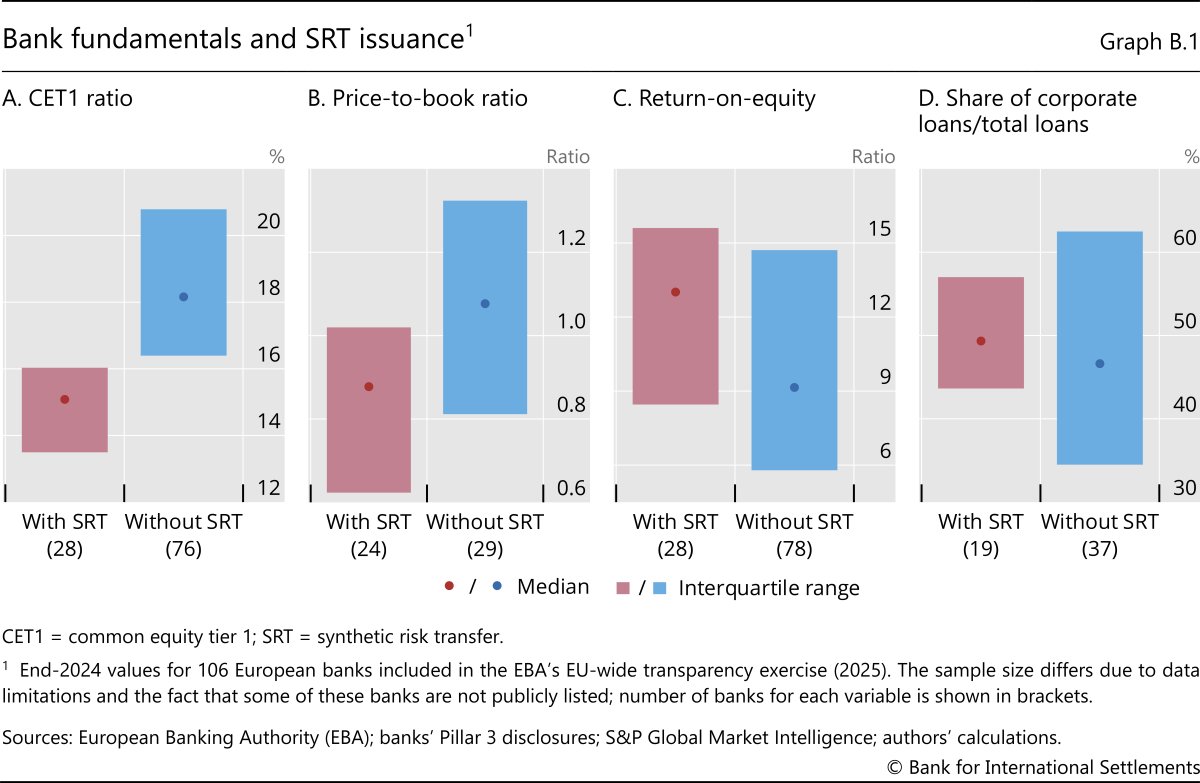
Table B.1 presents key estimation results. The analysis begins with a general model (Probit 1) that includes all of the variables mentioned above, but RoE and loan concentration are found to be statistically insignificant. Further examination leads to a more parsimonious model (Probit 2) with only total assets and CET1 ratio being statistically significant in affecting the probability of a bank issuing SRTs. Specifically, for a bank with an average CET1 ratio, a 1-percentage point decrease in the CET1 ratio increases the probability that it will use SRTs by 0.25%, all else being equal.22 Similarly, a larger bank in terms of asset size is more likely to issue SRTs. It is important to note that these estimations are based on cross-sectional data, which do not account for the dynamic nature of SRT issuance over time, and further research is needed to incorporate temporal dynamics into the analysis
Annex C
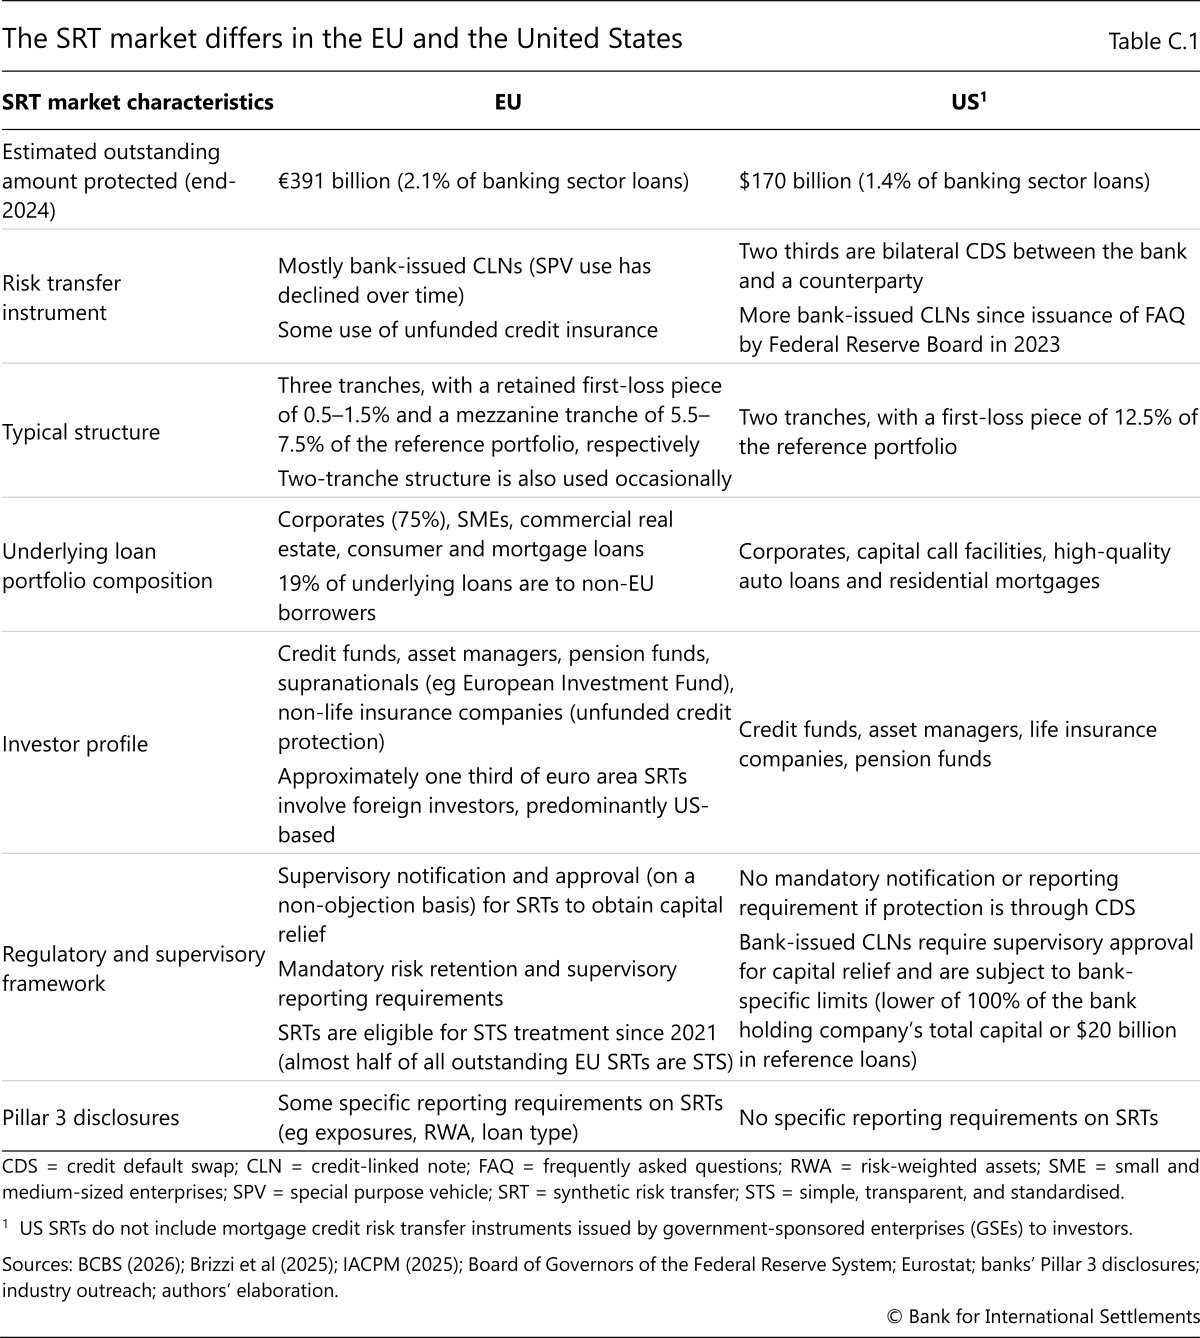
This Annex compares SRT market characteristics in the United States and other jurisdictions such as the EU (Table C.1). In the EU, given the bank-centric financial system, broad adoption of Basel II and III, and supportive regulatory and supervisory framework, banks have long used SRTs to transfer credit risk. The SRT markets in Canada and the United Kingdom are broadly similar to that of the EU in terms of regulatory capital treatment, structural features, loan portfolios and the investor base. In the United States, the existence of deep capital markets for corporate borrowers and the availability of government-supported SME loans may have reduced the need for SRTs for these asset classes, while differences in capital rules have resulted in distinct loan types protected by SRTs. Supervisory notification expectations, reporting requirements and public disclosures also differ across jurisdictions (BCBS (2026)).
Footnotes
1 The views expressed in this publication are those of the authors and not necessarily those of the BIS or its member central banks. We are grateful to the International Association of Credit Portfolio Managers (IACPM) for organising industry outreach and to Burcu Erik for excellent research assistance. We also thank Puriya Abbassi, Jeremy Brizzi, Sebastian Doerr, Mathias Drehmann, Gaston Gelos, Maciej Grodzicki, Tamar Joulia-Paris, Ulf Lewrick, Benoît Mojon, Richard Murdoch, Woojung Park, Jitendra Patil, Daniel Rees, Bertrand Rime, Brendan Rowan, Andreas Schrimpf, Hyun Song Shin, Nikola Tarashev and Chen-Helen Zhang for helpful comments and suggestions.
2 Credit risk transfer is the name given in the United States to securities issued by government-sponsored enterprises (GSEs) to synthetically transfer a portion of mortgage credit risk to investors.
3 It is difficult to assess how the capital freed up by SRTs is used by banks. Anecdotal evidence suggests that it has been reallocated to higher-return businesses, used to increase loans in the same business line or used to maintain a bank's capital ratio (eg after an acquisition). Klein et al (2025) find that banks use SRTs to shift their lending toward riskier green corporate loans. Osberghaus and Schepens (2025) find that euro area banks using SRTs have redirected freed up capital towards new lending.
4 There is no collateral in unfunded transactions (other than potentially for margin purposes, eg for a bank CDS with an eligible guarantor). The risk weight of the tranched assets is replaced by the risk weight of the guarantor, such as a supranational institution or highly rated credit risk insurer.
5 Investors mitigate the counterparty risk in SRTs issued by smaller banks through a third-party custodian or segregation of cash collateral, or through provisions for the collateral to be moved to another bank if the issuing bank's credit rating deteriorates. Anecdotal evidence suggests that such practices have protected investors in the few cases of SRT-issuing bank failures to date.
6 These include, for example, SRT guidelines by the European Banking Authority (EBA) and the extension of the "simple, transparent and standardised" (STS) framework to synthetic securitisations in the EU in 2021 and the issuance in 2023 of a Federal Reserve FAQ on using CLNs as a risk mitigant.
7 According to the Association for Financial Markets in Europe (AFME) and IACPM, the underlying loan pool protected by SRTs that were issued in 2024 (€188 billion) exceeded the size of all true sale securitisations (€144 billion) in Europe – comprising the EU, United Kingdom and other European countries – if the retained parts of those securitisations (ie not placed in the market) are excluded.
8 Smaller banks generally use more basic approaches to estimate their capital requirements. According to IACPM (2025), the share of loans accounted for by such banks has increased from less than 5% in 2016 to 20% in 2024, which shifts the asset profile of SRTs towards more retail exposures.
9 The relatively higher – compared with Europe – risk weights for certain asset types in the United States (eg capital call facilities, high-quality auto and residential mortgage loans) make them more amenable to SRT inclusion.
10 Pillar 3 disclosures for US banks do not provide sufficient information on SRTs to be able to estimate the extent of their use for each bank or to compare them with banks from other jurisdictions.
11 Anecdotal evidence suggests a similar trend in the United States, with some regional banks being most active (in terms of capital relief or relative to the size of their balance sheet) in the SRT market.
12 Market intelligence suggests that pension funds, along with sovereign wealth funds and endowments, are the main indirect investors in SRTs through their participation in specialised credit funds and diversified asset managers.
13 The relatively short duration given the types of loan protected and the lack of an external credit rating of most SRTs reduces their appeal as an investment product for insurers.
14 Credit rating agencies also monitor banks' reliance on SRTs. For example, Moody's (2025) notes that a capital improvement of more than 100 basis points may reflect overreliance on SRTs and other risk transfer transactions, since they provide materially less protection to bank creditors than equity.
15 There is no evidence to date of weakening underwriting standards due to risk transfer reducing banks' incentives to monitor loans properly. Osberghaus and Schepens (2025) argue that banks using SRTs reduce monitoring relative to other banks that are lending to the same firm. However, the fact that the bank continues to hold the senior tranche and manage the loan, and that it retains an ongoing relationship with the protection provider(s), should help mitigate any misalignment of incentives. Moreover, some jurisdictions (eg EU) require banks to keep an economic interest in the securitised portfolio ("skin in the game") and to not differentiate lending standards by portfolio.
16 Differences in SRT market characteristics across jurisdictions may also affect the use of leverage (Annex C). For example, US transactions typically have thicker tranches (ie a greater proportion of the loan portfolio needs to be sold to investors) in order to maximise capital relief given the capital rules in the United States, which incentivises greater use of leverage by investors to enhance returns.
17 Drawing on Seer Capital (2025), if one assumes that only part of the SRT investor base (ie asset managers and credit/hedge funds) are potential users of leverage, that half of them actually use leverage and that users generally borrow around half of the SRT amount they purchase (given the haircuts), then the total leverage outstanding in the SRT market would be around €10 billion.
18 An evergreen fund has no fixed end date and is designed to recycle capital on a continuous basis. Investors have the ability to enter or exit on preset schedules rather than wait for fund life cycles.
19 The sample is drawn from the EBA's annual EU-wide transparency exercise, which covers 119 major banks across the EU. However, due to data availability and limitations, the sample size is reduced to 106 banks. This analysis relies on bank-level data from Pillar 3 disclosures, linking them with bank fundamentals. Notably, it does not explore how banks select loan portfolios for SRTs.
20 Focusing on the PBR reduces the sample to 53 publicly listed banks, of which 24 issued SRTs.
21 A probit model is a type of regression model used when the dependent variable (eg SRT issuance) is binary, ie it takes on two possible outcomes.
22 One standard deviation of the CET1 ratio is 8%.