Renminbi propels the growth of EME currency trading
Box extracted from chapter "Global FX markets when hedging takes centre stage"
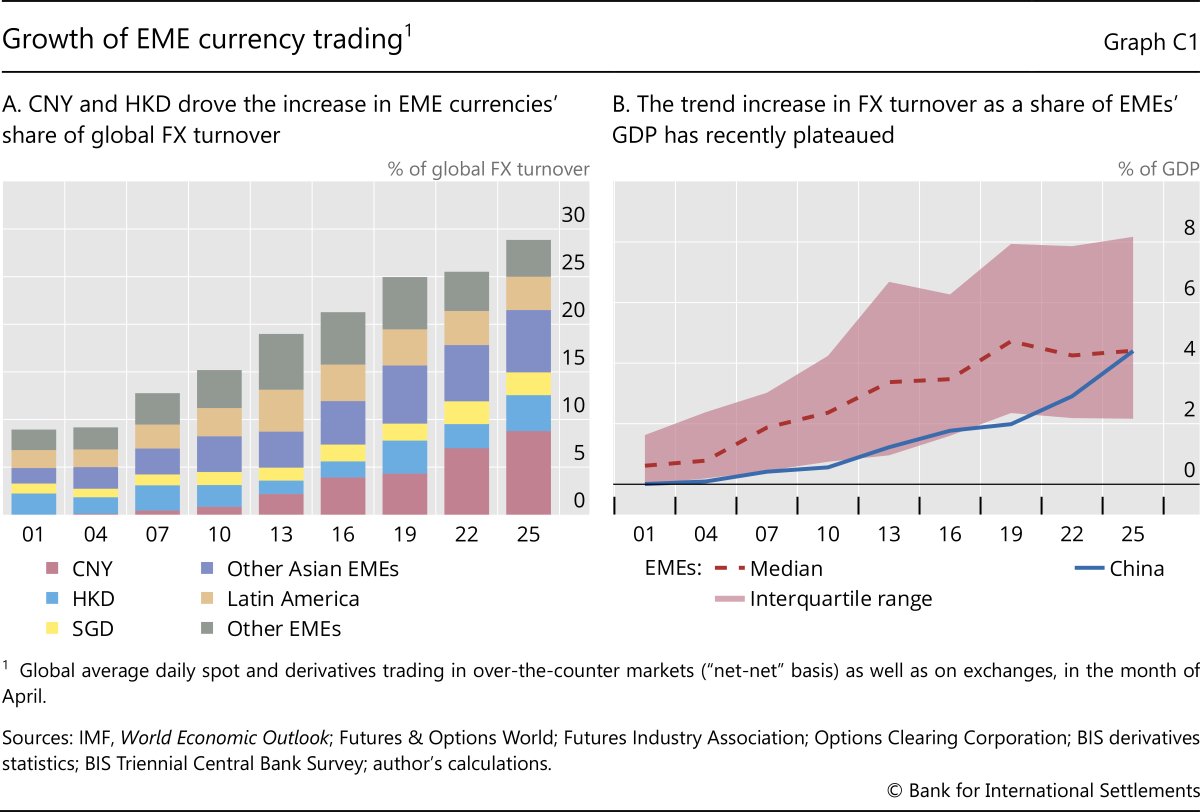
Emerging market currencies' collective share of global foreign exchange (FX) turnover rose to a new high of 29% in April 2025. This compares with 26% in April 2022 and less than 10% in the 2000s (Graph C1.A). Trading in the currencies of emerging market economies (EMEs) averaged $2.8 trillion per day in April 2025 – $2.7 trillion in over-the-counter markets covered by the BIS Triennial Central Bank Survey plus $0.1 trillion on exchanges.
The rise in EME currencies' global share was propelled largely by trading in the Chinese renminbi (CNY) and Hong Kong dollar (HKD). CNY was by far the most traded EME currency, accounting for 8.8% of global turnover in April 2025 (Graph C1.A). This was up from 7.0% in April 2022 and cemented the CNY's status as the fifth most traded currency overall. Indeed, in April 2025 USD/CNY surpassed USD/GBP as the third most traded currency pair, behind only USD/EUR and USD/JPY. HKD was the next most traded EME currency at 3.8% of global turnover, up from 2.5% in April 2022, followed by the Singapore dollar (SGD) at 2.4% and the Indian rupee (INR) at 1.9%.
Exchange rate volatility made an important contribution to the increase in CNY and HKD turnover in April 2025. Like for other major currencies, high volatility boosted inter-dealer activity as well as intermediation by principal trading firms (PTFs) and positioning by hedge funds. PTFs' and hedge funds' share of overall activity in CNY rose to 8%, in line with the global average, and in HKD their share climbed to 11%.
Alongside such cyclical factors, the trend increase in CNY activity was supported by the currency's growing use for trade and investment. For example, CNY-denominated cross-border bank credit to borrowers in Asian EMEs has been rising steadily since 2021. That said, USD continues to be the dominant vehicle currency for FX transactions involving CNY: as much as 96% of all CNY transactions were against USD in April 2025. Also, relative to economic activity, FX trading in CNY remains much lower than that in other major currencies, though it is rising quickly (Graph C1.B).
Aside from CNY and HKD, most other EME currencies saw relatively modest increases in trading volumes. Indeed, the upward trend in FX turnover as a share of GDP plateaued, with turnover relative to economic activity in the median EME unchanged between April 2022 and April 2025 (Graph C1.B).
This moderation in growth went hand in hand with a stabilisation in the share of international trading. Trading with non-residents had increased rapidly in the 2000s and 2010s, propelling the overall growth of FX activity in EME currencies (Graph C2.A). In recent years, however, the international share of trading has not changed much for the majority of EME currencies.
This steadying in the pace of internationalisation was explained in part by the faster growth of spot trading compared with derivatives trading. Among EME currencies, a larger share of spot trading than of derivatives trading takes place onshore – with residents of the currency area. For many years the growth of derivatives trading had outpaced spot trading, but between April 2022 and April 2025 spot trading grew faster. Exchange rate movements in April 2025 prompted EME and other non-US investors to hedge a larger proportion of their USD assets, which boosted activity in spot markets.
For all but a handful of currencies, FX derivatives trade mainly in offshore markets, beyond the reach of FX and capital controls that apply to transactions onshore (y-axis in Graph C2.B). Notable exceptions include the currencies of global financial centres, like HKD, SGD and the United Arab Emirates dirham (AED).
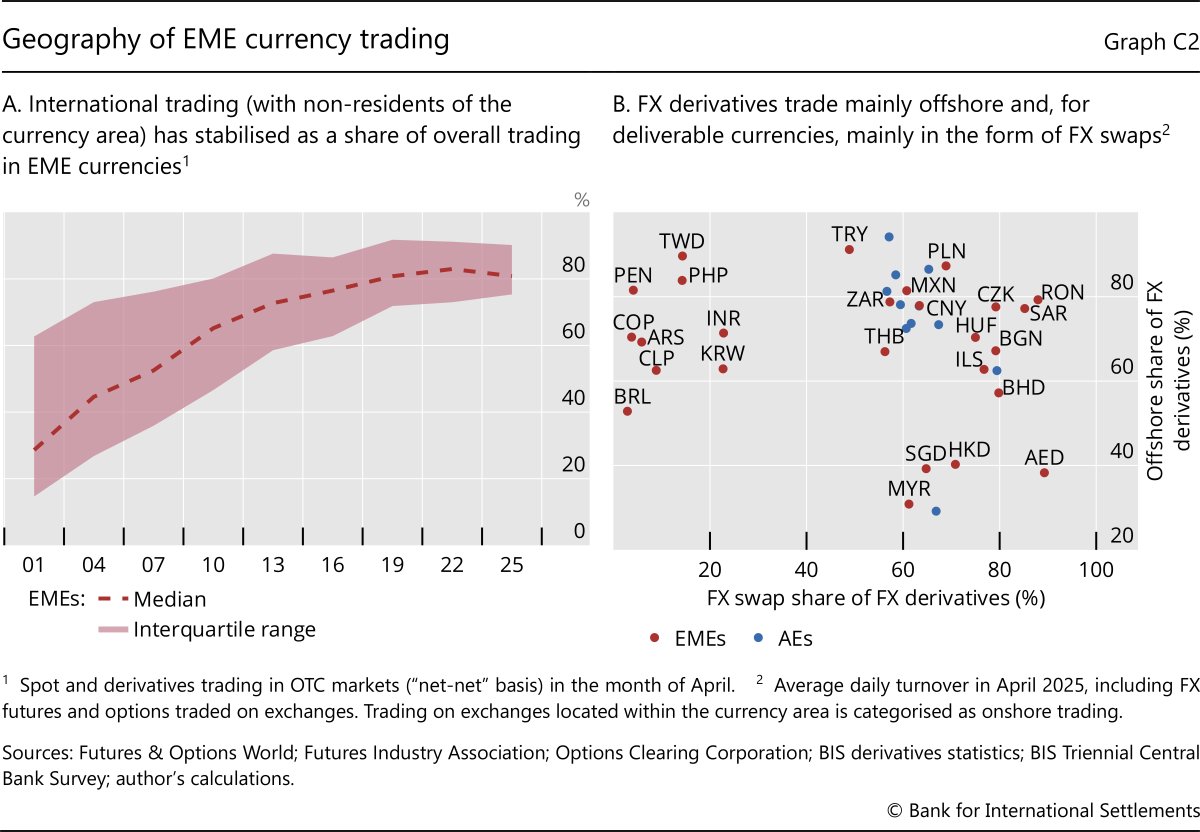
Where controls restrict a currency's deliverability abroad, trading fragments between onshore and offshore markets, thereby depressing market liquidity. Fragmentation is most noticeable in the instruments traded. For deliverable currencies, FX swaps are used by residents and non-residents alike to fund and hedge foreign investments; accordingly, FX swaps account for the largest share of derivatives trading (x-axis in Graph C2.B). In contrast, for non-deliverable currencies, such as the Colombian peso (COP), INR and Korean won (KRW), trading concentrates in non-deliverable forward contracts (NDFs). While authorities in some economies permit such contracts to trade onshore, NDFs overwhelmingly trade offshore between non-residents.
Even though the Brazilian real (BRL) and Malaysian ringgit (MYR) are non-deliverable currencies, a relatively low share of FX derivatives denominated in these currencies trade offshore (y-axis in Graph C2.B). BRL is unusual because futures traded on the Sao Paulo exchange account for a sizeable proportion of FX derivatives trading, in contrast to other currencies where futures trading is negligible. Importantly, there are few restrictions on non-resident participation in BRL futures, which helps to concentrate liquidity onshore. Similarly in Malaysia, FX controls are relatively liberal for non-residents, which reduces the cost of transacting MYR onshore.
The views expressed in this publication are those of the author and not necessarily those of the BIS or its member central banks.