Bubble conditions in US equities and gold?
Box extracted from Overview chapter "Volatility challenges risk-taking"
Throughout the recent market rally, US equities and gold surged in lockstep. The sharp price increases of both assets and their growing presence on the radar screens of non-specialised media have attracted substantial investment flows from retail investors and sparked a debate over the possibility of asset price bubbles.
Bubbles are characterised by rapid and accelerating price surges – reminiscent of an explosive behaviour – followed by sharp corrections. However, the identification of a bubble remains an open question in the academic discourse: there is no reliable evidence that price declines following strong increases are predictable, making it difficult to disentangle irrational price movements from rational market responses to the underlying (and potentially unobserved) fundamentals. Statistical approaches, instead, abstract from fundamentals and focus squarely on the time series properties of the price process. More specifically, they leverage on the notion that bubbles typically feature "explosive behaviour" – the property that the underlying data-generating process exhibits non-stationarity and drifts upwards, hence giving rise to accelerating, or explosive, price surges.
 To establish this, researchers can rely on so-called unit root tests while postulating that if a bubble exists the process exhibits roots above unity, which implies explosiveness.
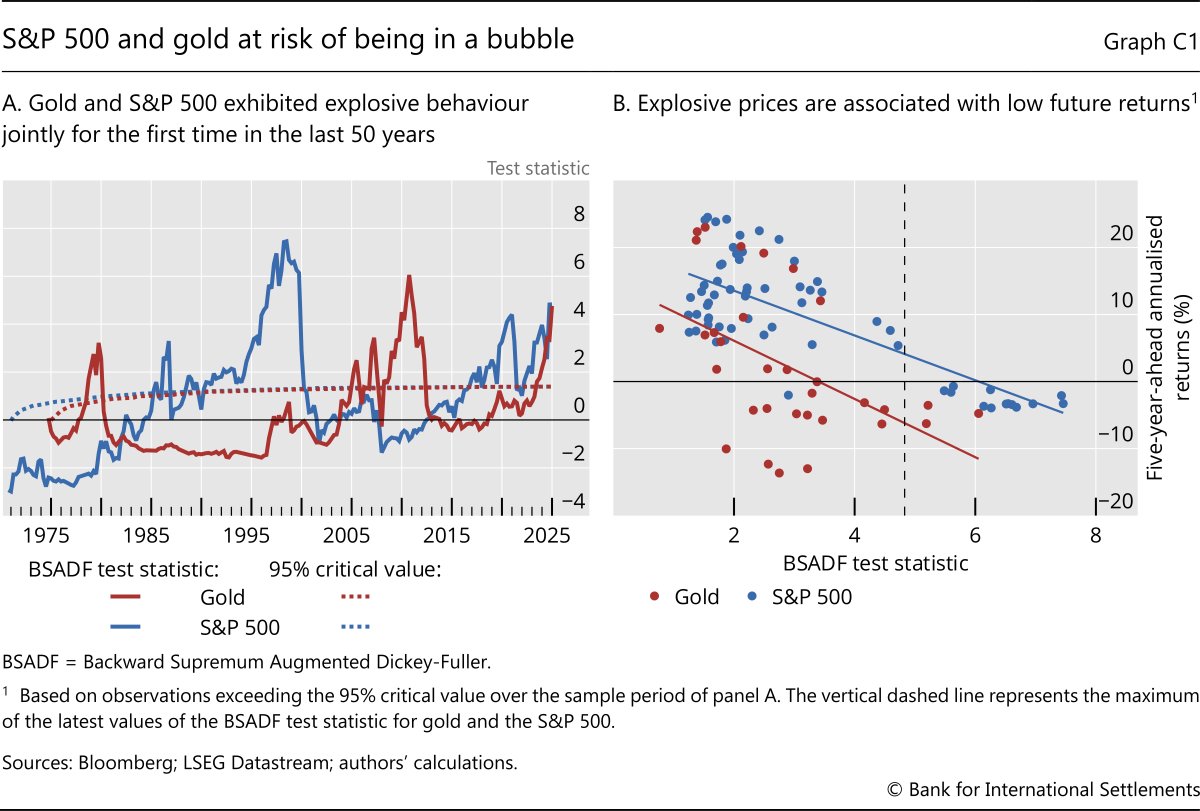
A widely used statistical test to detect the explosiveness of a price process suggests that both the S&P 500 and the price of gold have entered explosive territory in recent months. Historically, the prices of US equities and gold have breached the explosive behaviour threshold at different times (Graph C1.A). This was often followed by a significant correction, such as in 1980 for gold (after having surged during the Great Inflation) and the burst of the dotcom bubble for US equities. Note, however, that these corrections took place over a variable and potentially long time frame: while the test has reliably detected past bubbles, it provides no information on when bubbles may burst. Hence, during the development phase of the bubble, investors jumping on the trend could still benefit from further price increases. Also note that the past few quarters represent the only time in at least the last 50 years in which gold and equities have entered this territory simultaneously. Following its explosive phase, a bubble typically bursts with a sharp and swift correction. Graph C1.B suggests that high values of the test statistics – hinting at an ongoing bubble – are typically followed by periods of negative or subdued returns.
Beyond statistical properties, it is also instructive to monitor other common characteristics of bubbles. A typical symptom of a developing bubble is the growing influence of retail investors trying to chase price trends. At times of media hype and surging prices, retail investors can be lured to riskier assets that they would normally shun, compounded by herd-like behaviour, social interactions and fear of missing out. Indeed, measures of retail investors' interest in markets, such as internet searches, tend to surge at times of frothiness (Graph C2.A).
This time around, there is also evidence that retail investor exuberance and appetite for seemingly easy capital gains have spilled over to a traditional safe haven such as gold. Since the beginning of 2025, gold exchange-traded fund (ETF) prices have been consistently trading at a premium relative to their net asset value (NAV) amid growing retail investor interest (Graph C2.B, blue line). ETF prices exceeding their NAV signal strong buying pressure coupled with impediments to arbitrage.
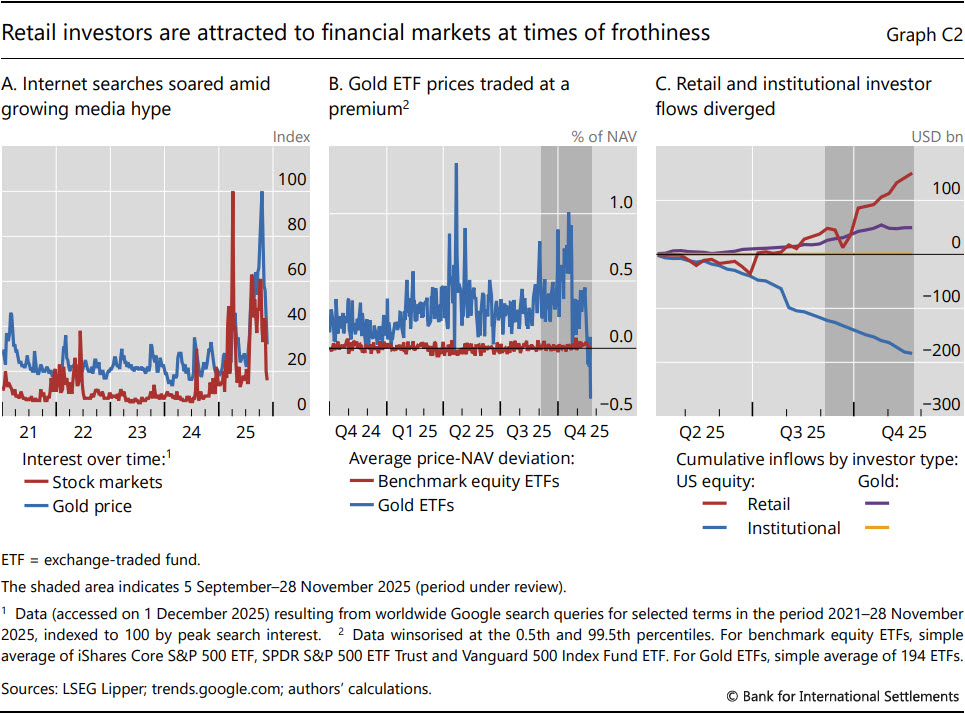
Fund flow data reveal it was mostly retail investors who recently poured money into US equities and gold funds. Furthermore, retail investors have increasingly taken trading positions that run counter to those of their institutional counterparts: the latter were taking money out of US equities or maintaining flat positions in gold, while retail investors recorded inflows (Graph C2.C). Although the influx of retail investors has mitigated the impact of institutional investor outflows, their growing prominence could threaten market stability down the road, given their propensity to engage in herd-like behaviour, amplifying price gyrations should fire sales occur.
The views expressed in this publication are those of the authors and do not necessarily reflect the views of the BIS or its member central banks. E Fama, "Two pillars of asset pricing", American Economic Review, vol 104, no 6, 2014, pp 1467–85. Most statistical tests for asset price bubbles rely on unit root tests; see R Gürkaynak, "Econometric tests of asset price bubbles: taking stock", Journal of Economic Surveys, vol 22, no 1, 2008, pp 166–86. The BSADF test for explosive behaviour performs a sequence of right-tailed unit root tests, keeping the endpoint of the sample fixed while recursively expanding the starting point; values of the test statistic above the critical ones indicate explosive behaviour; see P Phillips and S Shi, "Real time monitoring of asset markets: bubbles and crises", in H Vinod and C Rao (eds), Handbook of Statistics: Financial, Macro and Micro Econometrics Using R, vol 42, 2020, pp 61–80. B Barber and T Odean, "All that glitters: The effect of attention and news on the buying behavior of individual and institutional investors", The Review of Financial Studies, vol 21, no 2, 2008, pp 785–818.