Understanding the swift market recovery after the April 2025 tariff shock
Box extracted from Overview chapter "Markets shrug off trade conflicts"
After the turmoil triggered by the tariff announcements on 2 April, market conditions across the globe stabilised remarkably quickly. In the United States, the S&P 500 resumed its upward trajectory, recovering losses and posting strong gains. Similarly, the VIX, which had more than doubled in the immediate aftermath of the tariff shock, retreated and fell below its pre-announcement levels, despite lingering political and trade uncertainty. This box shows that the market rebound through mid-May was mainly due to backtracking from the initial tariff shock, which offset the impact of the 2 April announcement. The protracted equity rally and compression in volatility from mid-May onwards were largely influenced by non-tariff-related news and developments. The box also illustrates that, in contrast with past episodes, retail investors, rather than institutional ones, bought into the rally.
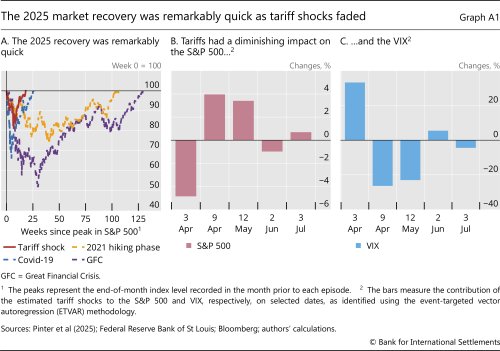
The market recovery from the 2 April tariff announcement was notably faster than the one following the start of the Covid-19 pandemic and other recent market stress episodes (Graph A1.A, red line). For instance, the S&P 500 recovered all early-April losses by the end of the same month and surpassed its pre-stress peak in just under 20 weeks, setting new all-time highs. This stands in contrast to shallower recoveries following other crises, eg the Great Financial Crisis (GFC) (purple line).
The apparent disconnect between lingering uncertainty and market optimism raises questions about what drove the rebound. To shed light on this issue, we use a statistical model of movements in financial market variables. Assuming that a tariff shock was the only driver of the joint movements of financial market variables from 2 to 3 April, we can use the model to decompose subsequent asset price movements into two parts: (i) the impact of the initial tariff shock and subsequent (possibly offsetting) tariff announcements; and (ii) all other unrelated news and drivers. These "other shocks" are residual movements in the data that cannot be explained by the tariff shock; they reflect a multitude of factors such as macroeconomic and monetary policy surprises, corporate earnings news and fluctuations in risk appetite. The decomposition relies on a vector autoregression (VAR) model, estimated using daily data from January 2021, which features seven financial variables: the S&P 500, the VIX, copper prices, the one-year inflation swap rate, the one-year Treasury yield, the term spread (10 years minus one year) and the USD-EUR exchange rate.
The tariff shocks identified by the model can be plausibly linked to market movements on the days of key tariff news (Graphs A1.B and A1.C). For instance, when tariffs were rolled back or paused, such as on 9 April or 12 May, the tariff shock led the S&P 500 to post large positive gains (Graph A1.B) and the VIX to compress (Graph A1.C).
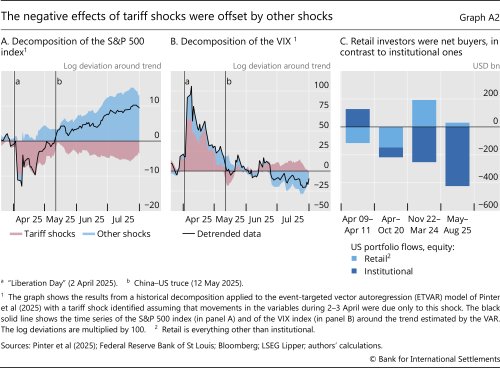
A full historical decomposition of movements in the S&P 500 and the VIX reveals that the initial market rebound through mid-May can be primarily attributed to subsequent revisions of the initial tariff shock, which ended up offsetting the negative effect of the 2 April announcement (Graphs A2.A and A2.B, red area). These include the 9 April pause on tariff implementation and the 12 May China–US truce, both of which contributed positively to equity prices and lowered the VIX.
The continued rally in equity markets and decline in volatility from mid-May onwards appear to have been driven largely by news unrelated to tariffs (Graphs A2.A and A2.B, blue area), for instance, resilient macroeconomic readings and a better than expected earnings season. In contrast, tariff shocks turned increasingly adverse again during June and July, exerting renewed pressure on markets. These effects probably stemmed from news related to tariff negotiations and the 1 August deadline, marking the end of the 90-day pause. Yet these adverse effects appear to have been dominated by non-tariff-related news triggering renewed optimism in risky asset markets. They may have also been amplified by retail investors. Even as institutional investors withdrew from equity markets, retail investors were on net "buyers of the dip", as visible from fund flows (Graph A2.C). These dynamics were somewhat unusual compared with past stress episodes (eg the GFC), when retail investors were net sellers and institutional investors were net buyers.
Overall, our analysis indicates that about 75% of the rise in the S&P 500 between the trough on 9 April and end-July was driven by positive surprises unrelated to tariffs. While policy reversals helped markets look through the initial shock, other factors, such as corporate earnings and the strength of macro fundamentals, ultimately underpinned the resilience of stock markets and risk sentiment.
 The views expressed are those of the authors and do not necessarily reflect the views of the BIS or its member central banks.
  For further details on this event-targeted vector autoregression (ETVAR) framework during the April 2025 shock, see G Pinter, F Smets and U Üslü, "Market whiplash after the 2025 tariff shock: an event-targeted VAR approach", BIS Working Papers, no 1282, August 2025.


