Markets shrug off trade conflicts

Global financial markets maintained a risk-on tone during the review period,1 shrugging off concerns over mounting tariff and policy uncertainty. Despite short-lived bouts of volatility triggered by incoming data and political developments, market sentiment remained upbeat, defying mounting challenges, including unease over the longer-run fiscal outlook in several key jurisdictions.
Equity markets in particular delivered strong returns, led by US stocks, which reached all-time highs. Large cap technology stocks outperformed, buoyed by enthusiasm around artificial intelligence (AI) and strong earnings, despite high valuations. Japanese stocks also posted gains. After having rallied earlier this year, European stocks remained flat, on the back of relatively weaker earnings growth. As is typical during risk-on phases, the rally was accompanied by subdued volatility, with the VIX receding. Credit spreads remained compressed and declined to lows not seen in a decade in spite of default rates ticking up.
The US dollar paused its depreciation after a significant step down in the second quarter of 2025. While dollar depreciation has historically been a marker of risk-on phases in financial markets, the dynamics over the review period did not match historical patterns. The risk-on tone was accompanied by an appreciation of the currency following the unveiling of the US fiscal package in early July. Overall, global financial conditions eased significantly, driven by equity gains and compressing credit spreads in the United States and benign conditions in emerging market assets. Conditions in Europe remained more subdued following a strong half-year.
The risk-on environment was underpinned by expectations of further monetary policy easing in the US and several other jurisdictions, coupled with expected fiscal largesse in the US and Germany. This policy cushion supported investors' optimism by reducing their perceived likelihood of adverse scenarios. Central banks in major advanced economies (AEs) continued reducing policy rates. The ECB, Sveriges Riksbank, the Swiss National Bank and the Bank of England implemented rate cuts. The Federal Reserve kept rates on hold, but some Federal Open Market Committee (FOMC) participants signalled a preference for an easier stance in the future, and signs of a cooler labour market fuelled expectations of rate cuts.
Such sanguine market assessments sit oddly with concerns about fiscal sustainability, which are arising from the dynamics of long-term government bonds. Long-run yields remained elevated in the risk-on environment, with yield curves showing significant steepening at the ultra-long end. This trend was probably driven by mounting unease about the fiscal outlook in certain jurisdictions and lingering concerns over a potential resurgence of inflation.
Emerging market economies (EMEs) capitalised on the global risk-on sentiment, benefiting from a softer US dollar and from market participants tuning out trade conflicts. EME currencies appreciated broadly, supported by both developments in the real economy and technical factors related to hedging activities. Local currency bonds saw modest positive returns, while EME bond issuance picked up. EME equity markets rallied, with notable gains in China, Colombia and Korea.
Key takeaways
- Equity markets rallied as markets shrugged off trade tensions and policy uncertainty and focused on robust corporate earnings, while credit spreads compressed further.
- Short-term bonds priced in greater policy easing, but long-term yields stayed high and yield curves steepened at the very long end on fiscal and inflation concerns.
- Emerging market assets saw gains, benefiting from the risk-on environment and the weakening of the US dollar.
Risk assets plough ahead
During the review period, risk assets showed remarkable resilience, defying the trade conflict and policy uncertainties. Despite occasional volatility due to macroeconomic data surprises, positive sentiment held sway, reinforced by strong corporate earnings and an outwardly resilient macroeconomic outlook.
Global equity markets delivered robust returns, with US stocks setting the pace. US equity markets surged to all-time highs (Graph 1.A, red line), supported by better than expected corporate earnings. US stocks, particularly those of large cap technology companies (the so-called "Magnificent 7") reported solid earnings (Graph 1.B), which further fuelled investors' optimism. Japanese stocks also performed strongly (Graph 1.A, purple line). EME equities joined the rally (black line), outperforming those of many AEs. European equities performed more modestly and finished the period flat (blue line), reflecting weaker earnings growth and a pause in the recalibration of international portfolio allocations that prevailed in the first half of the year.
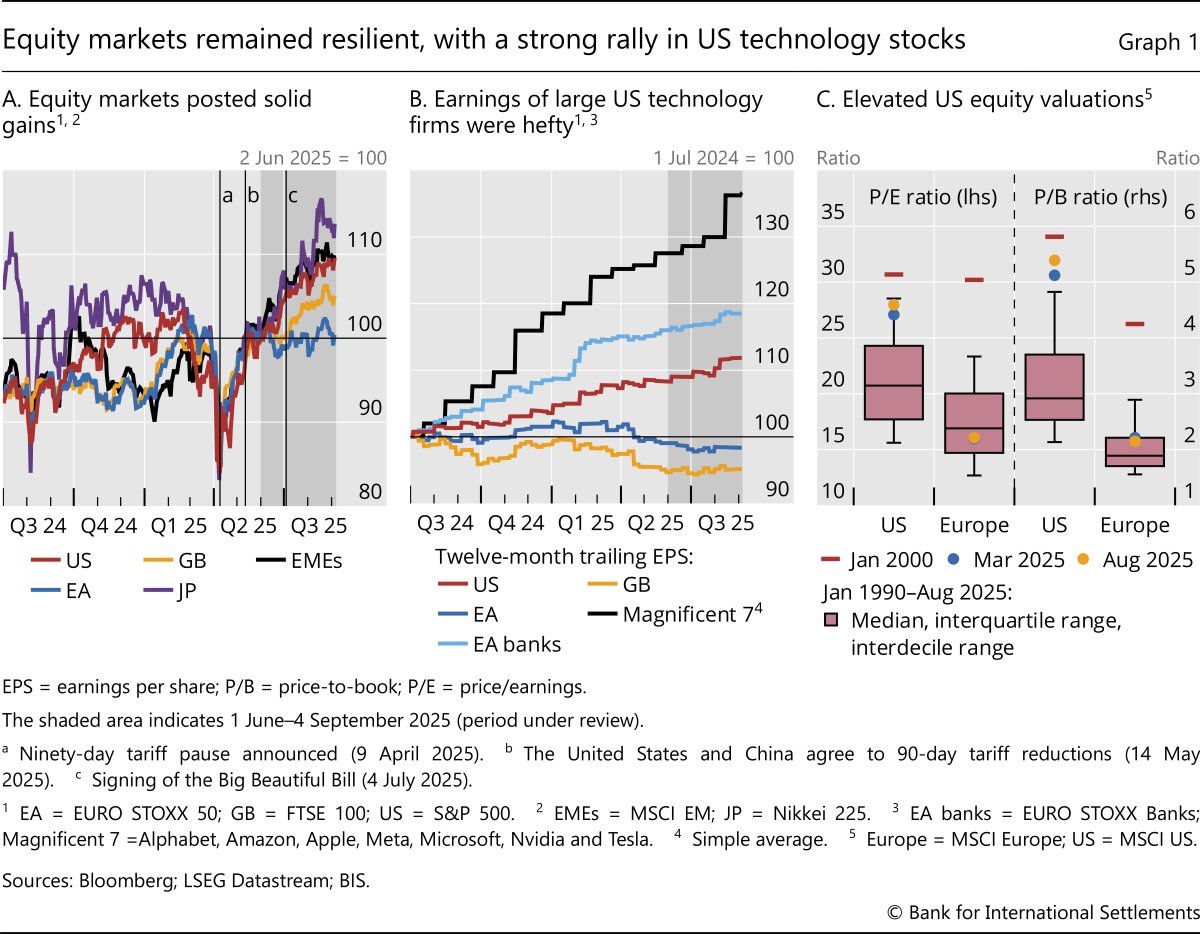
As a result of the stock market rally, equity valuations rose, overtaking their levels before the April shock. In the US, aggregate valuations were close to the top 10% of the historical distribution, and not far from the levels touched at the peak of the dotcom bubble (Graph 1.C). By contrast, European stock valuations were more in line with historical norms.
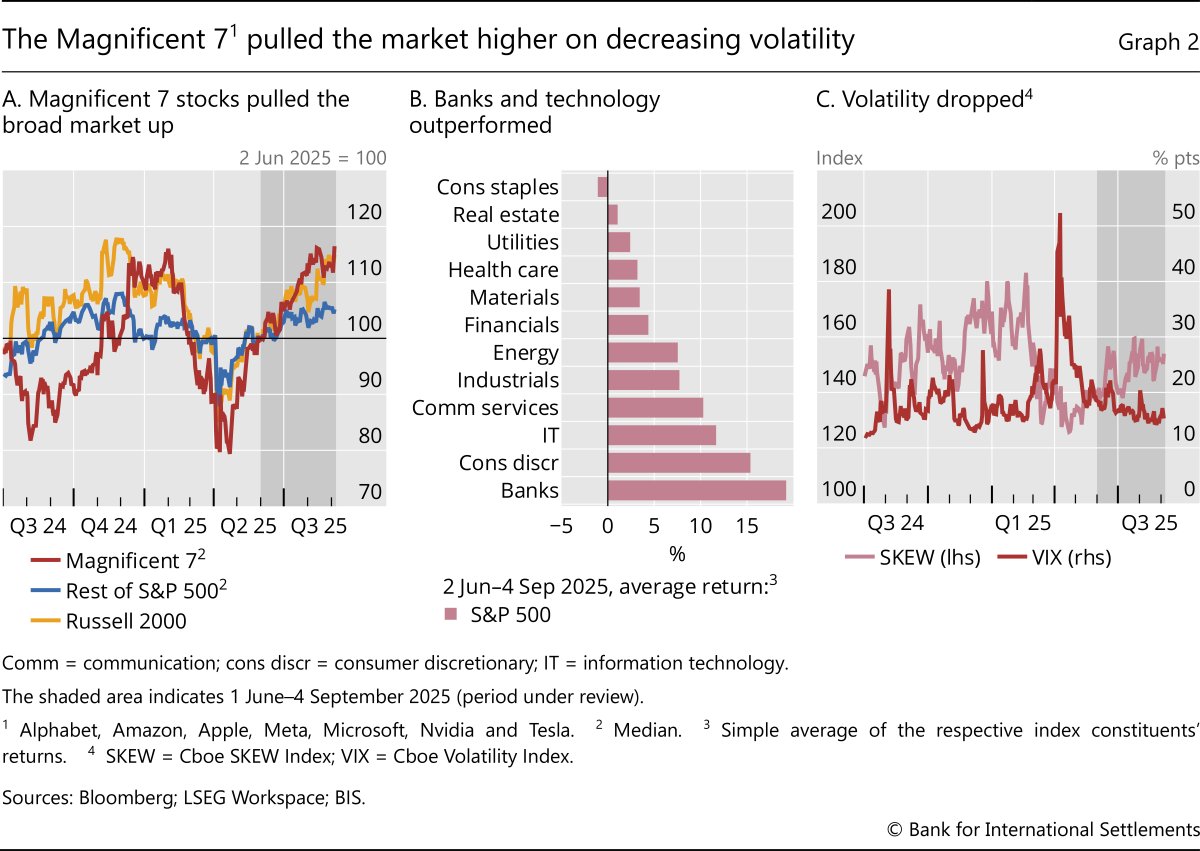
The rally in US equities was fuelled by large cap technology stocks and banks. The Magnificent 7 reported strong earnings and outperformed the rest of the S&P 500 index by about 11 percentage points (Graph 2.A). The AI trade boosted investor enthusiasm, with these companies capitalising on heightened demand for technology-driven solutions, in turn pushing the S&P 500 to all-time highs in August and overshadowing concerns over the future profitability of investment in AI. Other outperforming sectors included consumer discretionary and banks (Graph 2.B), which benefited from tailwinds from the early July fiscal package and a pause in the US-China trade conflict, as well as the upward-sloping yield curve in the case of banks. Investor confidence was further underpinned by resilient economic readings and consumer spending in the US, as well as expectations of policy easing, which offset increasing signs of weakness in the labour market.
The rally took place amid notably subdued volatility, which typically accompanies risk-on environments. Measures of equity market volatility such as the VIX declined (Graph 2.C, red line). Volatility spikes during the period were mostly tied to macroeconomic data releases hinting at a possible slowdown, but ultimately proved short-lived. For example, the disappointing US non-farm payrolls data released in early August and September led to drops in the S&P 500. Another short bout of volatility coincided with higher than expected US and euro area inflation releases in June. Tariff news, by contrast, had an increasingly muted impact, as markets seemed to become less attentive to lingering trade tensions and focused more on factors other than tariffs, such as relatively positive macroeconomic readings and expectations of easier monetary policy (Box A).
Other signs of aggressive risk-taking were visible in options markets. The SKEW index turned more positive after 2 April and remained so over the review period, meaning that prices for upside exposure increased whereas those for downside protection decreased (Graph 2.C, pink line). These price moves may have also amplified the overall equity price increases via shifts in option dealers' hedging activities, as dealers presumably had to rebalance their downward protection hedges by buying equities during the June–July rally.
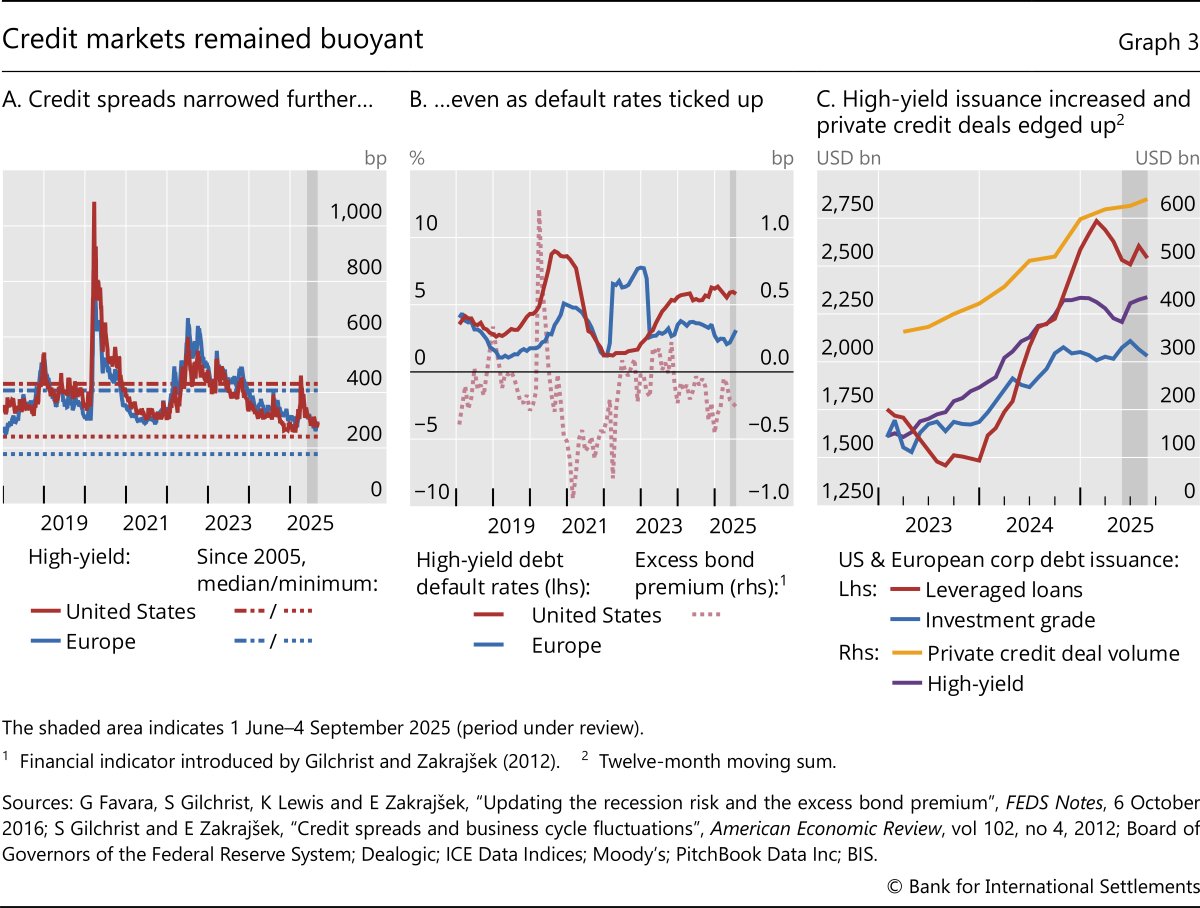
Broad risk-on sentiment was also evident in credit markets. Credit spreads in the high-yield segment compressed significantly in both the US and Europe, to be well below historical norms, and even close to historical lows in the US (Graph 3.A). The narrowing of spreads was associated with rising yields on government bonds, but such compression of spreads is at odds with default rates of high-yield bonds being elevated and marginally ticking up, especially in the US (Graph 3.B, red line). As such, narrow spreads mainly reflected reduced credit risk compensation by investors (pink line). In line with a risk-on environment, high-yield issuance also rebounded and private credit deals edged up (Graph 3.C, purple and yellow lines).
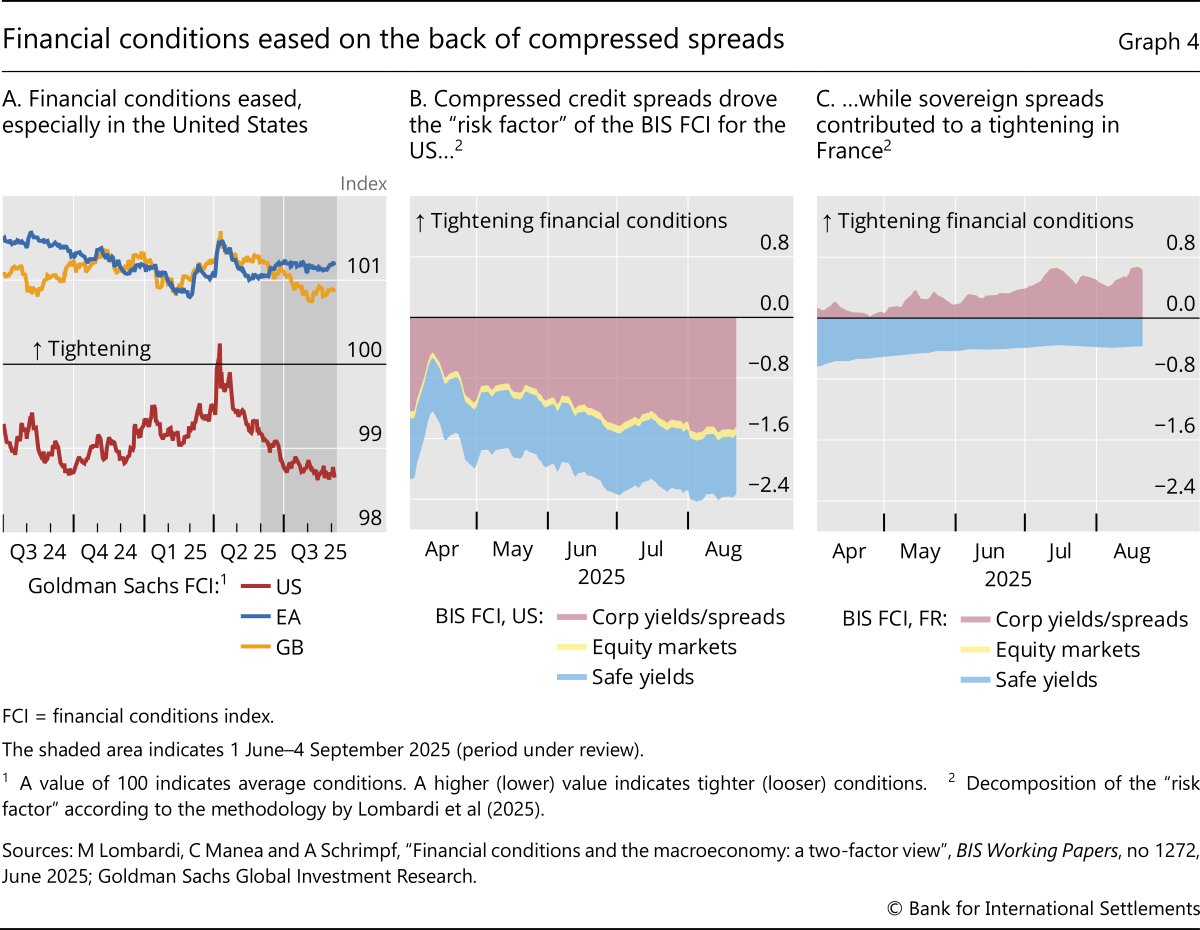
The prevailing risk-on sentiment was a key ingredient of generally easing financial conditions. Conditions relaxed significantly in the US, as well as in the United Kingdom (Graph 4.A). Those in the euro area remained broadly unchanged, with more lacklustre equity performance. Narrower credit spreads and buoyant corporate bond markets were the key drivers of the easing in the "risk factor" underlying the BIS measure of financial conditions.2 In the US, corporate yields and spreads led the risk factor to ease further, despite the relatively high level of government bond yields (Graph 4.B). In France, an increase in credit and sovereign spreads, not only vis-à-vis German bunds but also Italian treasuries (also see below), contributed to a steady tightening of the risk factor (Graph 4.C).
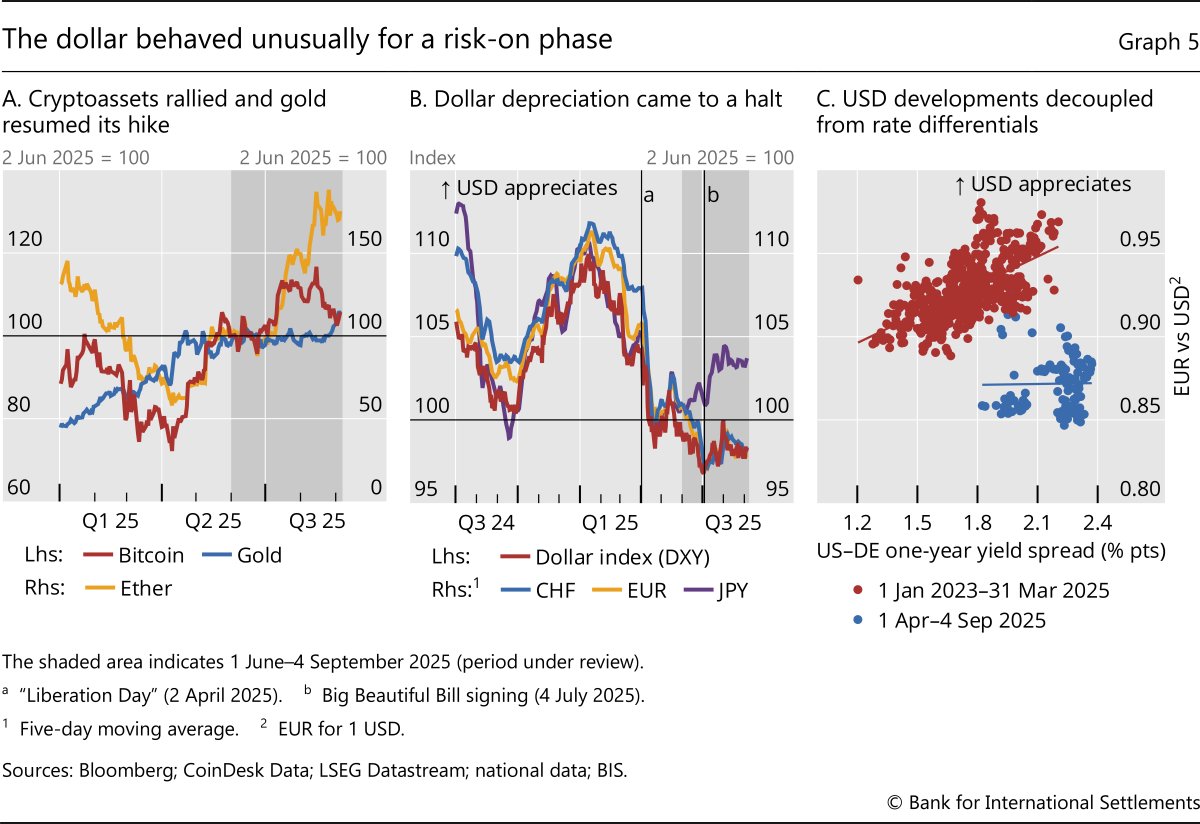
The risk-on environment was also evident from the dynamics of digital assets and gold. Cryptoassets rallied, aligning with the risk-on mood (Graph 5.A) and supported by the GENIUS Act, which provided further tailwinds. In the first part of the review period, gold's appreciation paused, consistent with optimistic investors shifting portfolio flows towards growth-oriented assets, while the demand for safe haven assets waned. Yet towards the end of August gold prices resumed their march upwards, in line with emerging signs of unease about longer-run prospects.
Another unusual development in the general risk-on environment was the dynamics of the US dollar. Initially, the dollar stayed on the depreciation path entered in April owing to shifts in investors' hedging practices and some rebalancing of portfolio flows away from dollar assets (Graph 5.B, red line). The depreciation was sustained against the Swiss franc and the euro (blue and yellow lines), while the Japanese yen diverged from other currencies and lost ground against the dollar (purple line). Yet the greenback's depreciation came to a halt after the unveiling of the fiscal package in July: the dollar appreciated while equity markets were posting strong gains. This appreciation is somewhat at odds with the dollar's tendency to soften in periods of heightened risk-taking.3
US dollar dynamics during the review period also did not square well with interest rate differentials. Typically, higher differentials between short-term yields on US Treasuries and German bunds have been associated with an appreciation of the dollar against the euro (Graph 5.C, red dots). Yet this historical pattern broke down in the aftermath of the April 2025 tariff-related turbulence (blue dots) when positive and widening yield differentials went hand in hand with dollar depreciation. As US rates declined after July while those in the euro area edged up, the interest rate differential narrowed, but the dollar actually firmed. While inflows into US equity and bond funds probably supported it (Box B), the appreciation in this phase might also be related in part to some unwinding of hedging activity that had taken place in April and May.4
Bond markets await further policy easing
The risk-on sentiment was also encouraged by actual and expected monetary easing. In the short segment of the yield curve, market pricing seemed consistent with investors' eyeing policy rate cuts, and more broadly being confident that policy interventions could mitigate the likelihood of adverse scenarios. At the same time, long-term yields remained elevated and the yield curve even steepened at its very long end, possibly reflecting unease over the outlook in the longer run.
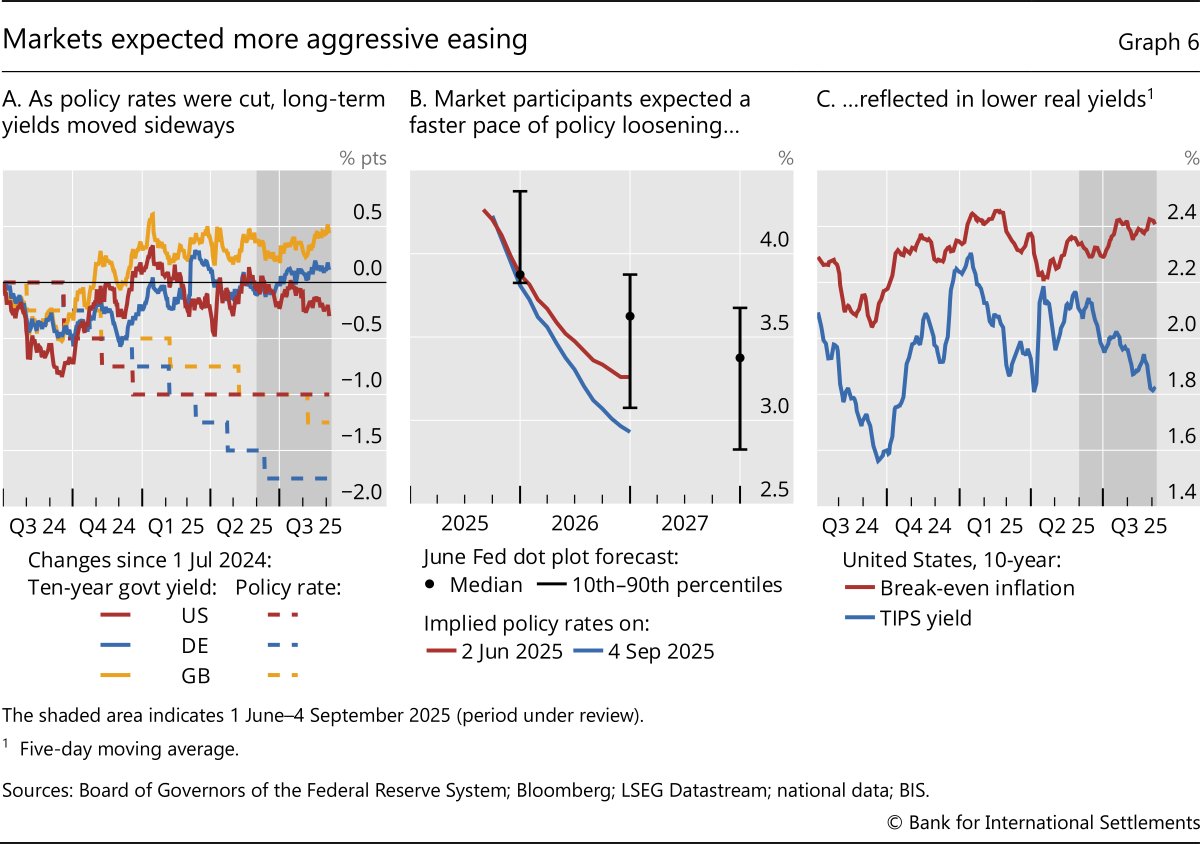
Amid emerging concerns of an economic slowdown, and with inflation apparently in check, central banks in major economies continued lowering policy rates. The ECB and the Bank of England cut their policy rates by 25 basis points (Graph 6.A), and other central banks followed suit. The Federal Reserve kept the federal funds rate on hold at its July policy meeting. Yet US non-farm payrolls releases in early August and September surprised on the downside, while previous readings were also revised downwards, hinting at a cooling of the labour market. In mid-August, the CPI release seemed to at least temporarily dispel concerns over the inflationary effects of tariffs, as core goods prices increased only marginally.
Increasing evidence of a slowdown and subdued inflationary pressures from tariffs so far also led market participants to price more aggressive rate cuts in the near future (Graph 6.B). The dovish tone of the Jackson Hole meeting at the end of August fuelled expectations of upcoming rate cuts and supported further risk-taking. Overall, market participants progressively revised their expectations on the policy stance downwards, relative to FOMC members' own projections made in June.
Notwithstanding the policy easing in major AEs, long-term bond yields stayed elevated across those economies (Graph 6.A). In the US, 10-year government bond yields were dragged in different directions by expectations of an easier policy stance and longer-term concerns over fiscal prospects. While the former was the key driver of a decline in real rates, the latter may have been reflected in break-even inflation rates ticking up (Graph 6.C). Long-term rates generally rose in other AEs, including the euro area and the UK.
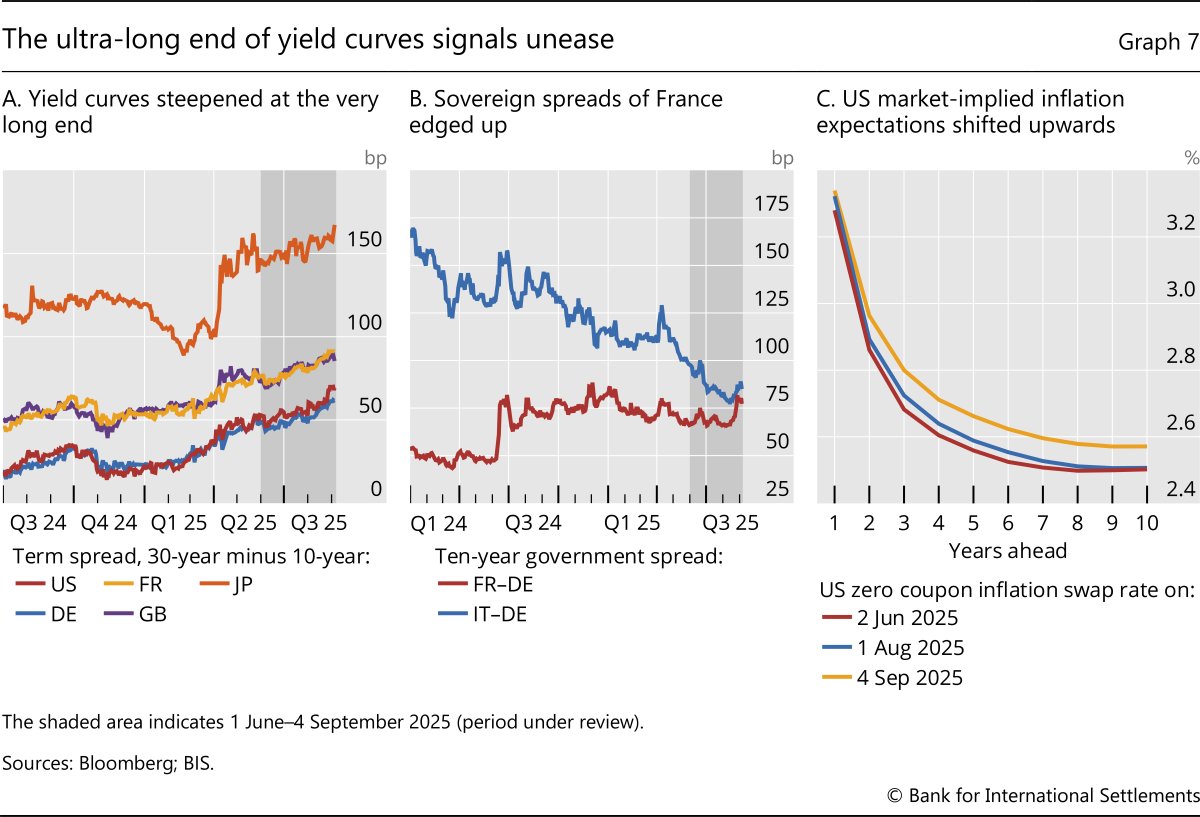
Yield curves steepened considerably at the very long end in all major AEs. This could also reflect structurally weaker demand from long-term investors such as pension funds and insurers. Term spreads between 30- and 10-year government bonds increased steadily over the review period, especially in the UK, France and Germany (Graph 7.A). In the UK, yields on longer-term gilts were particularly affected by weaker demand by institutional investors, following the UK government's liability-driven investment (LDI) reform. In Japan, longer-term rates rose steadily after their spurt in the second quarter, reflecting political uncertainty clouding the fiscal outlook.
In the euro area, fiscal developments also took centre stage. On top of tariff-related uncertainties, the increase of longer-term rates in Germany may reflect expectations of a larger supply of government bonds, given the fiscal expansion plans. Fiscal concerns led the yields on French government bonds to increase even faster, as mounting political challenges could thwart the fiscal outlook. This led to an increase in the spread of French over German government bonds (Graph 7.B, red line). At the same time, other sovereign spreads in the euro area continued to compress. For example, the spread of Italian versus German bonds reached levels not seen since 2010, settling close to the French sovereign spread in August (blue line).
Pressures on long-term rates also reflected rising inflation concerns in the medium to long run. In the US, the entire term structure of market-based inflation expectations shifted upwards by around 10 basis points over the review period, a move that gained further impetus in August after the Jackson Hole meeting (Graph 7.C).
EMEs joined the risk-on rally
EMEs capitalised on the global risk-on sentiment, benefiting from US dollar weakness, subdued corporate bond yields and markets paying less attention to lingering trade tensions. EME currencies, bonds and equities saw gains, with regional variations reflecting differences in local economic dynamics.
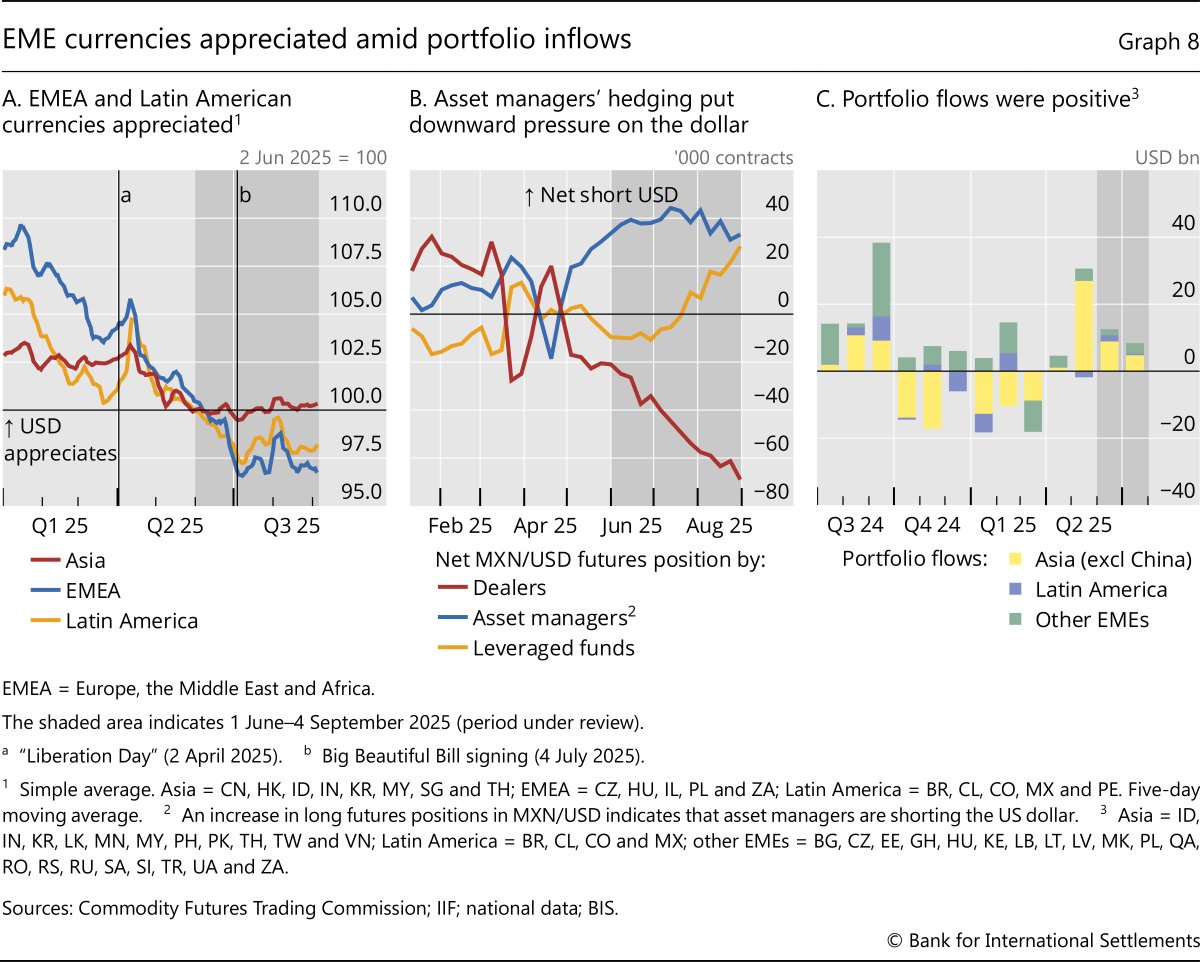
The risk-on environment went hand in hand with the appreciation of several EME currencies. Currencies in Latin America and Europe, the Middle East and Africa (EMEA) led the appreciation, whereas Asian currencies were mostly flat, with some exceptions (Graph 8.A). The appreciation of some EME currencies partly indicated large asset managers raising currency hedge ratios on their US dollar asset holdings after April. Public data on currency futures show that asset managers increased their long positions in EME currencies such as the Mexican peso, effectively shorting the US dollar vis-à-vis these currencies (Graph 8.B). Portfolio flows maintained their momentum from the second quarter and were positive on net (Graph 8.C).
Long-term yields in EMEs showed regional divergence and bond issuance picked up. In Latin America, yields ticked lower, reflecting uneven growth and a generally higher sensitivity to the waxing and waning of US trade policy uncertainties (Graph 9.A, yellow line). Brazil, which was hit by a hefty 50% US tariff, was an exception, even though a policy rate increase aimed at countering inflationary pressures also contributed to higher yields. In Asia and EMEA, yields remained broadly flat, reflecting less monetary policy easing and stable investor sentiment (red and blue lines). EME sovereign bond issuance picked up pace after lacklustre performance in the first quarter, echoing the improved risk sentiment (Graph 9.B, pink bars) as global investors sought higher yields in EME debt markets. Dollar-denominated EME bonds were also supported by the risk-on environment and saw a notable compression in spreads (red line).
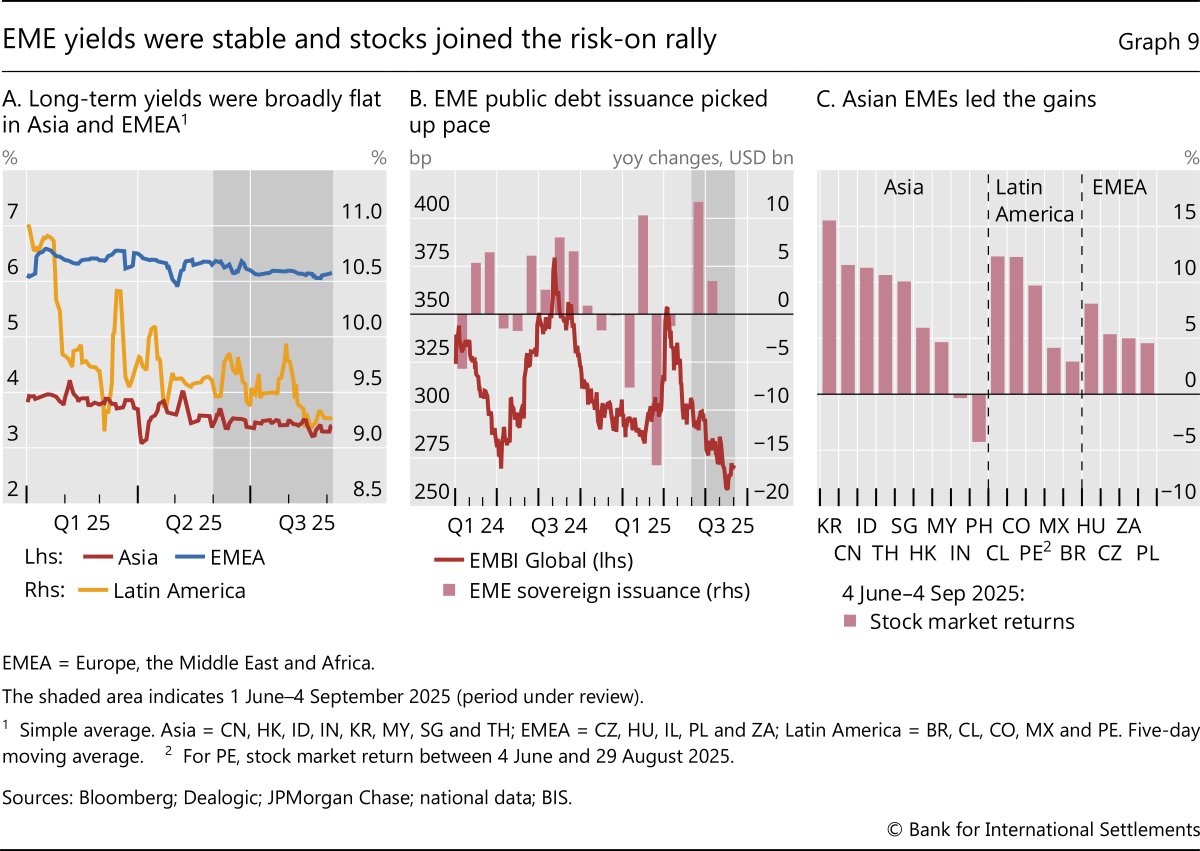
In line with the broad risk-on sentiment, EME equity markets rallied. In Asia, markets in China, Indonesia and Korea led the gains, driven by the 90-day US-China tariff pause in June, which temporarily eased trade tensions (Graph 9.C). China's markets also benefited from stabilising economic data and stimulus measures, such as infrastructure spending, which boosted investor confidence. Equities in Hong Kong SAR rose in tandem, supported by its linkage to Chinese markets, and strong financial sector performance. There was some regional divergence in Latin America, with Colombian equites outperforming those in Brazil and Mexico, even though Colombia faced headwinds amid fiscal and tariff uncertainty.
Footnotes
1 The review period is from 1 June to 4 September.
2 See M Lombardi, C Manea and A Schrimpf, "Financial conditions and the macroeconomy: a two-factor view", BIS Working Papers, no 1272, June 2025.
3 See S Avdjiev, V Bruno, C Koch and H S Shin, "The dollar exchange rate as a global risk factor: evidence from investment", IMF Economic Review, vol 67, no 1, pp 151–73, March 2018.
4 See H S Shin, P Wooldridge and D Xia, "US dollar's slide in April 2025: the role of FX hedging", BIS Bulletin, no 105, June 2025.