Monetary policy operational frameworks - a new taxonomy

Central banks' operational frameworks are at the heart of monetary policy implementation. Yet the conventional classification falls short of capturing their wider implications for banks' incentives and market outcomes. We propose a new taxonomy based on two key dimensions. First is the marginal opportunity cost of holding reserves, which influences banks' incentives to trade reserves in the money market. Second is the quantity of reserves, which affects how banks manage liquidity risks and comply with regulatory and supervisory requirements. The continuous nature of these dimensions allows for a granular classification of operational frameworks. Applying the taxonomy to real-world operational frameworks uncovers unexpected similarities between distinct frameworks and highlights how similar designs can lead to differing outcomes 1
JEL classification: E42, E58
Monetary policy operational frameworks (in short, operational frameworks) are critical for central banks. They encapsulate the mechanisms and tools used to steer the central bank's operational target in line with the desired policy stance and to provide liquidity to the financial sector. As such, the operational framework enables the central bank to achieve its monetary policy and financial stability objectives.
In recent years, changes in balance sheet size and composition have prompted central banks to re-examine how they implement monetary policy. Multiple rounds of quantitative easing (QE) following the Great Financial Crisis and the Covid-19 pandemic led many central banks to transition from operational frameworks with scarce reserves, ie a small volume of reserves, to frameworks with ample or a large volume of reserves.2 More recently, some central banks have combined balance sheet reductions with a reassessment of their operational framework design.
Operational frameworks have traditionally been classified based on where the overnight money market rate – typically the central bank's operational target – trades relative to the interest rates set by the central bank.3 This classification, rooted in the seminal Poole (1968) model, identifies four archetypes, with the "corridor" system and the "floor" system being the most prominent. In a corridor system, the overnight interest rate trades in a "corridor" bounded from below by the interest rate paid by the central bank on overnight deposits and from above by the rate it charges on overnight loans. In contrast, in a floor system the overnight interest rate trades close to the interest rate the central bank pays on deposits.
Key takeaways
- A new taxonomy of monetary policy operational frameworks explores two dimensions: the marginal opportunity cost of holding reserves and the quantity of reserves.
- This taxonomy is rooted in economically relevant dimensions that influence and reflect banks' incentives and, therefore, market outcomes.
- When applied to current operational frameworks, the taxonomy reveals surprising similarities between frameworks regarded as distinct and highlights how similar designs can yield very different outcomes.
While the traditional classification of operational frameworks is helpful for encapsulating how central banks implement monetary policy, it does not fully capture their broader implications for banks' incentives and the financial system as a whole. Two dimensions are especially important: the marginal opportunity cost of holding reserves, and the aggregate quantity of reserves. The former is the difference between the rate earned on lending an additional unit of reserves in the money market, and that earned by depositing it at the central bank. This cost is the key driver of banks' incentives to trade reserves in the money market. The aggregate quantity of reserves affects how banks manage liquidity risks and comply with regulatory and supervisory requirements. The role of reserves in managing liquidity risks has been an important consideration for several central banks that have recently changed their operational frameworks.
The conventional archetypes are too coarse and fail to capture important variations along these key dimensions. For example, corridor systems can operate with widely varying corridor widths – from a few basis points to several percentage points – which imply very different marginal opportunity costs. Similarly, in floor systems the quantity of supplied reserves can vary significantly – from just above the level where the demand curve flattens to very large amounts.4 These differences have implications for banks' incentives and behaviours. Moreover, conventional archetypes can at times be misleading, grouping distinct systems or separating similar ones, hampering comparisons of operational frameworks. These limitations have become increasingly apparent in recent decades, both when central banks' balance sheets expanded and more recently when they contracted.
In this article, we propose a new taxonomy that categorises operational frameworks along the two dimensions: (i) the marginal opportunity cost of holding an additional unit of reserves; and (ii) the aggregate quantity of reserves. The first provides a precise measure of where the money market rate trades relative to the central bank's deposit facility rate, moving beyond traditional labels that indicate only whether the money market rate trades "in the corridor" or "at the floor". Similarly, the quantity of reserves offers a specific measure of where on the demand curve the central bank operates.
Applying the taxonomy to real-world operational frameworks uncovers surprising similarities between frameworks commonly regarded as distinct and highlights how similar designs can yield very different outcomes. For instance, the Reserve Bank of Australia, the Bank of Canada and Sveriges Riksbank operate seemingly different operational frameworks but achieve similar outcomes: a moderately large quantity of reserves paired with a low, yet positive, marginal opportunity cost. On the other hand, the Bank of Mexico, the Swiss National Bank and the Bank of Thailand design their frameworks to achieve a high marginal opportunity cost while maintaining a lower average opportunity cost of holding reserves, but their outcomes vary. Reserve levels in Mexico and Thailand are significantly lower than in Switzerland. Additionally, the marginal opportunity cost of holding reserves in Mexico is much higher than in Thailand and Switzerland.
The remainder of the article is organised as follows. First we briefly review the Poole (1968) model and the archetypal operational frameworks. Then we discuss the new taxonomy in more detail. Finally, we apply the new taxonomy to a select group of central banks. The two boxes examine how international prudential standards affect banks' demand for reserves, and the balance sheet mechanics that influence the level of reserves in the system.
Operational frameworks – a primer
Operational frameworks encapsulate the mechanisms and tools used to steer the central bank's operational target in line with the desired policy stance and to provide liquidity to the financial sector. While multifaceted in practice, the core of any operational framework is the supply of reserves given the prevailing demand.
Poole (1968) was the first to examine these issues theoretically, laying the foundation for numerous models developed since. These models of the overnight market are based on two core features.5 First, central bank reserves are essential to settle payments flowing between banks during the day. Any bank that is short can borrow from the interbank market, but – if short at the end of the trading day – it needs to turn to the central bank and borrow from the lending facility at a premium. Second, banks can lend reserves in the interbank market, with the standing central bank deposit facility serving as the outside option for potential lenders. These features imply a non-linear reserve demand curve (Graph 1): for low levels of reserves, the demand curve is flat at the lending facility rate, while for high levels of reserves, the demand curve is flat at the deposit facility rate. Between these flat segments, the demand curve is downward-sloping.
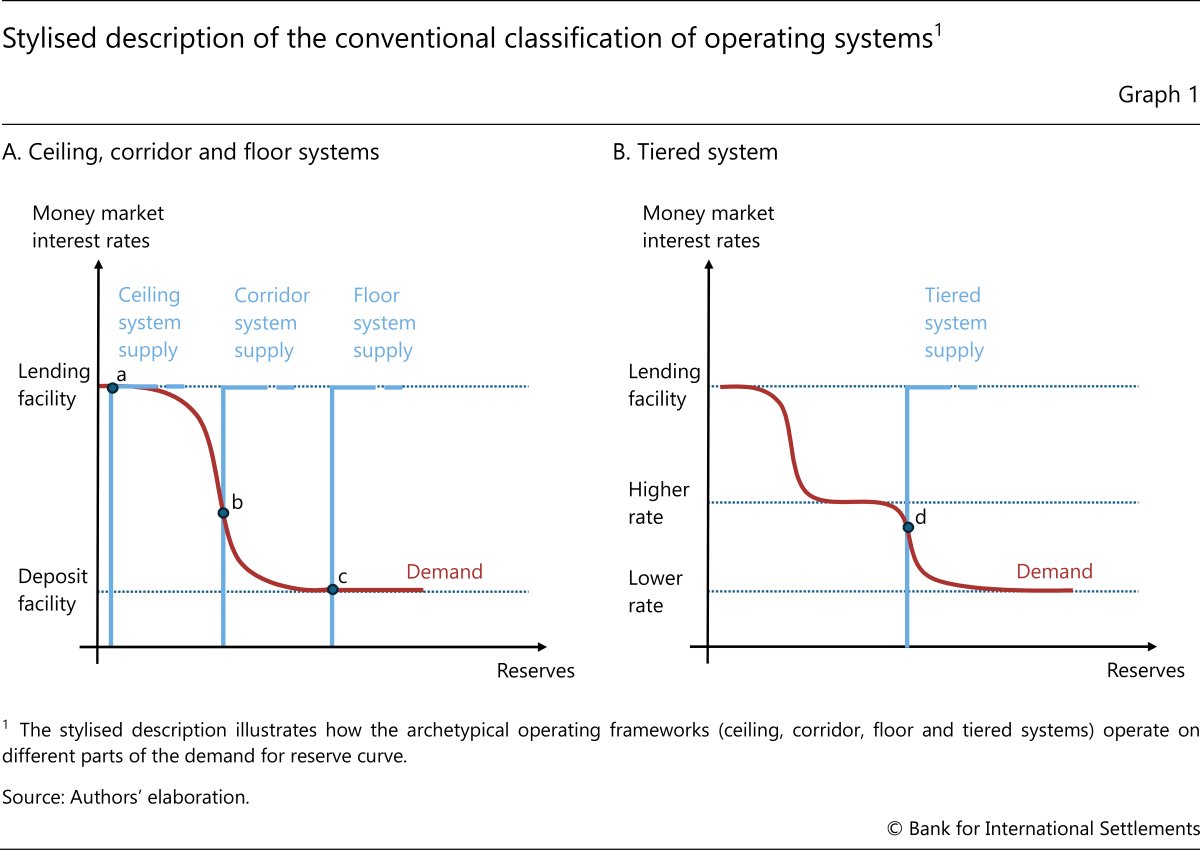
Against the backdrop of these models, operational frameworks are typically classified into four main archetypes: the "ceiling" system, the "corridor" system, the "floor" system and the "tiered" system.6 This taxonomy is based on where the money market rate trades relative to the rates on standing facilities or, equivalently, on which part of the demand curve the system operates:
- In the ceiling system, the central bank operates on the upper flat segment of the demand curve and supplies reserves via its standing lending facility (Graph 1.A, point a). As a result, the money market rate aligns with the lending facility rate.
- In the corridor system, the central bank calibrates the supply of reserves to intersect the downward-sloping portion of the demand curve (point b). Here, the money market rate trades within the corridor defined by the rates of the two standing facilities.
- In the floor system, the central bank provides a sufficiently large volume of reserves so that supply intersects the flat, lower segment of the demand curve (point c). In this case, the money market rate trades at the deposit facility rate.
- In the tiered system, the central bank engineers a second steep segment of the demand curve (Graph 1.B) by remunerating reserves up to a certain level at a higher rate, while reserves exceeding this level earn a lower rate. The central bank sets the supply to intersect this second steep segment, and the money market rate trades between the two renumeration rates (point d).
A new operational framework taxonomy
The traditional classification of operational frameworks is useful for encapsulating how central banks steer their operational target in line with the desired policy stance, but it does not fully capture the implications of each framework for banks' behaviour and the financial system. To address this gap, we propose a new operational framework taxonomy based on two core dimensions: the marginal opportunity cost of holding reserves and the quantity of reserves.
The marginal opportunity cost of holding reserves
The marginal opportunity cost of holding reserves is defined as the difference between the rate at which one additional unit of reserves can be lent overnight in the market and the rate at which it can be deposited overnight at the central bank.7
This marginal opportunity cost plays a crucial role in shaping banks' incentives to either accumulate or economise on reserves at the margin. Thereby, it influences the degree of activity in the overnight money market.8 All else equal, a higher marginal opportunity cost strengthens a bank's incentive to avoid holding more reserves than are strictly needed and to benefit from lending reserves in the money market.
The quantity of reserves
The quantity of reserves is defined as the aggregate quantity of reserves held by banks overnight in excess of any requirement set by the central bank.
Banks hold these reserves overnight as part of their overall portfolio decision, balancing risk and return considerations. Intraday, banks need reserves for payment and settlement purposes. But for banks considering whether and how many reserves to hold overnight, reserves are simply another asset with specific risk-return characteristics. In particular, reserves earn the interest rate on the deposit facility, which may be zero if they are unremunerated. From a risk perspective, reserves are the safest asset in the market, because central banks carry virtually no counterparty risk. From a liquidity risk perspective, reserves, unlike other high-quality liquid assets (HQLA), do not need to be monetised. Hence they are immediately available to meet outflows and are not subject to market risk. To put it differently, the quantity of reserves is the next day's immediately available funding liquidity for banks.9
The aggregate quantity of reserves can therefore affect the extent to which banks hold reserves as part of their liquidity risk management strategy. This may include the use of reserves to fulfil regulatory and supervisory requirements (see Box A). Holding reserves rather than other HQLA may entail some benefits for banks' liquidity risk management and overall financial stability. Bailey (2024), for instance, argues that the supply of reserves by the central bank should take into account the increased size and speed of potential runs given that there are limits to the capacity of private markets and contingent facilities to convert other assets into reserves. Logan (2023) points out that reserves are the most liquid asset and argues that a system with a low quantity of reserves imposes a penalty on good liquidity risk management. That said, Acharya et al (2023) and Borio (2023) argue that the quantity of reserves supplied can fundamentally alter banks' behaviour and business models in ways that increase, rather than reduce, their liquidity risk and dependence on central bank support.10 Indeed, there is empirical evidence that the demand curve for reserves in major advanced economies has shifted outwards in recent years, although identifying the underlying drivers remains empirically challenging.11
The quantity of reserves and the marginal opportunity cost of holding them are two independent but related dimensions. The quantity of reserves is tied to the average opportunity cost of holding them, defined as the average spread between the overnight money market rate and the rate earned on reserves held at the central bank. While central banks can set the aggregate quantity of reserves in the system, they cannot simultaneously set the aggregate quantity and their price; for banks to be willing to hold greater amounts of reserves, all else being equal, the average opportunity cost of holding reserves must decrease.12
The distinction between marginal and average opportunity cost is subtle, but important. In frameworks where the central bank pays a single rate on all reserves held overnight, marginal and average opportunity costs coincide. This occurs, for example, in the archetypical corridor and floor systems. In the former, each unit of reserves incurs a high opportunity cost as the central bank deposit rate is below the market overnight interest rate. In the latter, the market rate trades close to the deposit facility, and again the marginal and average opportunity cost are the same. But in the archetypal tiering system, the central bank pays the policy rate on reserves up to certain bank-specific quotas, and a lower rate on reserves held above the quotas. In such a system, the average opportunity cost is low – or indeed negative, since the policy rate paid on reserves within the quota is higher than the market rate – but the marginal opportunity cost for banks with reserves above their quota is high. This generates incentives for banks to trade reserves in the money market. A similar outcome can be achieved if the central bank offers reserve-absorbing operations during the day at a rate higher than the deposit rate.
Other relevant dimensions
By focusing on the key dimensions that drive banks' incentives, the proposed taxonomy does not capture the full complexity of operational frameworks in practice.13 One issue that has gained attention in recent years are the modalities of how the central bank supplies reserves, in particular whether it fixes the quantity of reserves or their price, or utilises a combination of both. If the central bank fixes the quantity, banks' demand determines the price of reserves. This approach of fixing the supply of reserves is sometimes referred to as "supply-driven". Conversely, if the central bank sets the price at which it injects or drains reserves and meets all demand at that price, it is banks' demand that determines the quantity of reserves, and the framework is typically called "demand-driven".14
The distinction between frameworks that primarily rely on fixing quantities versus prices was prominent in recent operational framework reviews by central banks that have started to shrink their balance sheets.15 Unconventional monetary policies such as quantitative easing, funding for lending schemes and foreign exchange intervention – if not sterilised – increase the supply of reserves and lower the opportunity cost of holding reserves (see Box B for a discussion of central bank balance sheet mechanics and the quantity of reserves). Once a central bank wants to maintain a low opportunity cost of holding reserves and at the same time shrink its balance sheet, it faces a choice: maintain a supply-driven operational framework or move to a demand-driven one. In both cases, the central bank has to account for variation in reserves demand if it wants to keep opportunity costs low and avoid sudden jumps in money market rates. But demand- and supply-driven approaches address this uncertainty differently. The former allows the level of reserves to respond to demand. The latter seeks to estimate variation in demand ex ante and takes it into account when determining the level of reserve supply.
Distinguishing supply- and demand-driven frameworks is not always straightforward, as central banks offer a range of operations that combine elements of both. For example, all central banks operating supply-driven frameworks offer a backstop lending facility designed to meet any additional demand for reserves at a fixed price for eligible banks that can post sufficient collateral. Frameworks commonly portrayed as supply-driven can also be very responsive to demand conditions, as is the situation in Canada. In this case, the supply-driven systems are functionally very similar to demand-driven ones. Conversely, in demand-driven frameworks the central bank may still use operations commonly associated with supply-driven frameworks, such as government bond purchases or fixed-quantity term lending operations, to supply at least a portion of reserves. Such an approach is used, for instance, in the United Kingdom.
Applying the taxonomy to central bank practices
To apply the taxonomy in practice, we make two adjustments to the definition of the quantity of reserves. First, as previously noted, we exclude required reserves, as these are not held for risk-return considerations. Second, we include other non-reserve central bank liabilities that, from a bank's perspective, have similar characteristics to reserves for managing liquidity risk. This adjustment reflects the fact that some central banks absorb reserves by issuing instruments that closely resemble reserves from a liquidity risk management perspective.16
Further reading
Graph 2 presents the taxonomy for 12 jurisdictions in 2024 along the two dimensions: the marginal opportunity cost and the quantity of reserves. To ensure the comparability across countries and time, we normalise the quantity of reserves by total bank credit to the private non-financial sector as a readily available proxy for the size of the banking sector. Several insights emerge from the graph.
First, the taxonomy captures the substantial heterogeneity that exists within each dimension. For instance, marginal opportunity costs range from above 11 percentage points in Mexico, to small negative values in the euro area, the United Kingdom and the United States. Similarly, the quantity of reserves varies widely across jurisdictions, ranging from zero in Korea to close to 65% of bank credit to the private non-financial sector in Japan.
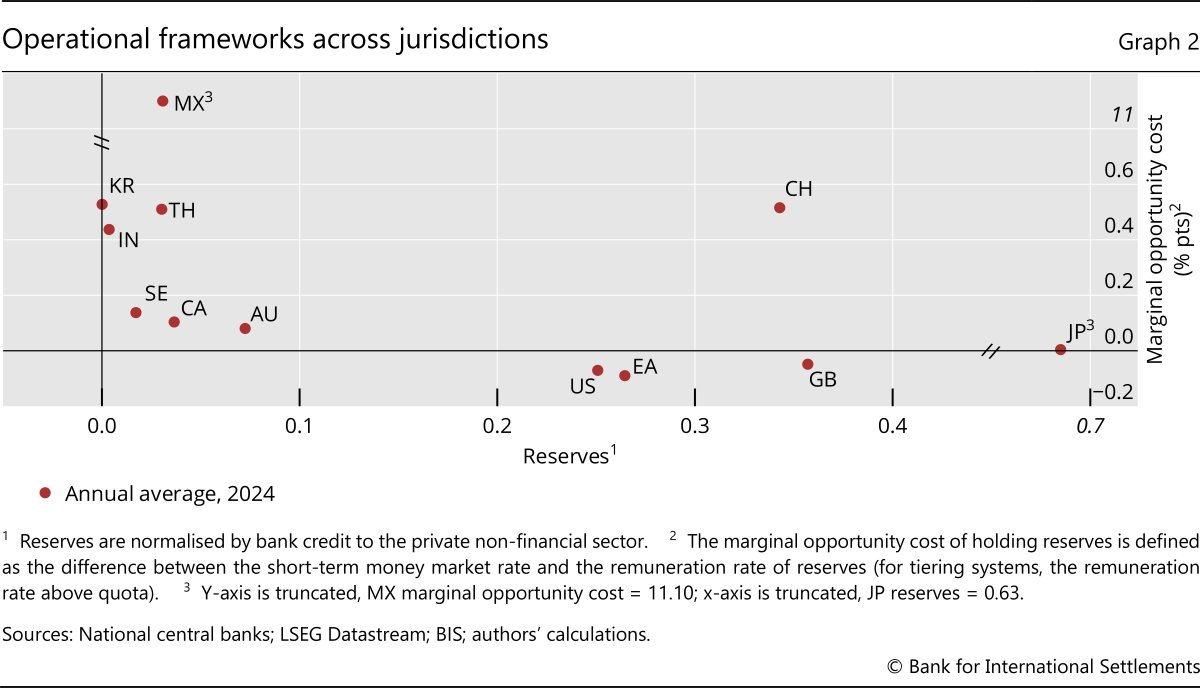
Second, some central banks operate frameworks that align closely with the canonical archetypes. For instance, the Bank of Korea and the Reserve Bank of India implement frameworks with zero (or near-zero) reserves and high marginal opportunity costs, resembling the archetypal corridor system. In contrast, the ECB, Federal Reserve and Bank of England maintain frameworks characterised by large quantities of reserves and zero or negative marginal opportunity costs, aligning with the archetypal floor system. The Bank of Japan operates a similar framework but with a substantially larger quantity of reserves.
Third, the taxonomy highlights surprising similarities between frameworks that are not immediately apparent in the traditional classification. The Reserve Bank of Australia, the Bank of Canada and Sveriges Riksbank operate seemingly different operational frameworks but achieve similar outcomes: a moderately large quantity of reserves paired with a low, yet positive, marginal opportunity cost. The Bank of Canada operates what it refers to as a floor system, remunerating reserves held at the deposit facility at 5 basis points below the policy target rate and supplying reserves through ad hoc fixed-quantity overnight repo auctions at the policy target rate. Sveriges Riksbank conducts full-allotment weekly reserve-absorbing operations at the policy rate and remunerates reserves held at the deposit facility at a rate 10 basis points below the policy rate. It refers to this approach as a "narrow corridor". In contrast, the Reserve Bank of Australia supplies reserves through fixed rate full-allotment repo operations priced at 10 basis points above the policy rate, with the policy rate in turn 10 basis points above the deposit rate, describing its framework as "ample reserves with full allotment". Despite these differences in design, these three frameworks create similar incentives and market outcomes.
Finally, the taxonomy reveals the frameworks where marginal and average opportunity costs diverge – a surprising commonality between Mexico, Switzerland and Thailand. But the tools used to implement such frameworks differ, as well as the ultimate outcomes. The Swiss National Bank remunerates reserves at the policy rate up to bank-specific quotas, applying a lower rate to reserves exceeding these thresholds. The Bank of Thailand and the Bank of Mexico conduct daily reserve-absorbing operations at the policy rate and pay a lower rate at their deposit facility.17 Despite all these frameworks achieving high marginal opportunity costs and low average ones, the specific outcomes in terms of marginal opportunity costs and reserve levels vary. Reserve levels in Mexico and Thailand – counting reserves held at the deposit facility as well as other overnight central bank liabilities as noted above – are significantly lower than in Switzerland. Additionally, the marginal opportunity cost of holding reserves in Mexico is much higher than in Thailand and Switzerland as the deposit facility is not renumerated and thus marginal opportunity costs fluctuate with the money market rate that tracks the policy rate.
While Graph 2 provides a snapshot of monetary policy operational frameworks in 2024, it does not capture the significant changes over the past 15 years (Graph 3).
Consider the cases of the euro area, the United Kingdom and the United States, and to a lesser extent Sweden, which are typical for many advanced economies. Before the Great Financial Crisis, it was standard to utilise operational frameworks with low reserve levels and high marginal opportunity costs. Opportunity costs differed across jurisdictions because of the width of the corridor (ie the difference between the lending and deposit facility rates) and whether it was symmetric or not. But once central banks implemented large-scale QE programmes and long-term lending operations they transitioned to frameworks with large quantities of reserves. And as reserve levels increased – and with this their average opportunity cost fell – central banks allowed the marginal opportunity costs to fall in parallel. The evolution in Sweden is somewhat similar, except that QE programmes only started after the pandemic and balance sheet shrinkage is more advanced. Moreover, Sweden employed daily fine-tuning operations up to 2019, so that average opportunity costs diverge from marginal ones before the onset of QE.
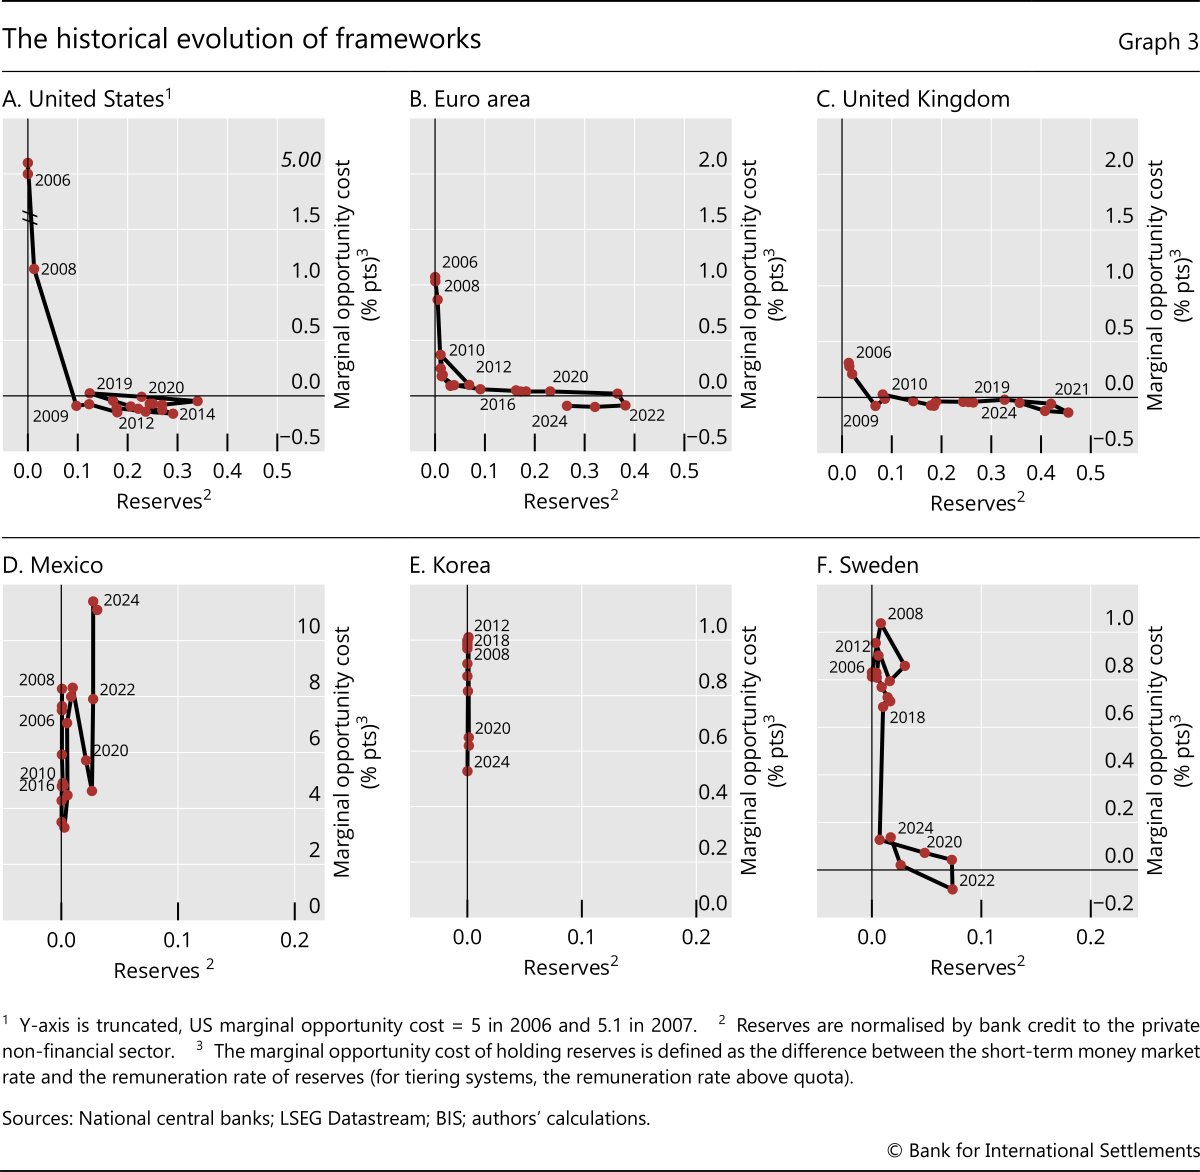
In contrast, operational frameworks in most emerging market economies have remained unchanged over the past two decades as central banks continued to operate with high opportunity costs despite fairly large balance sheets. The evolution in Korea exemplifies the classical "corridor" system. Reserves (above minimum reserve requirements) have been low and marginal opportunity costs have ranged between 50 and 100 basis points because the central bank changed the width of the corridor during periods of stress. In Mexico, the volume of reserves changed because the Bank of Mexico changed the volume of overnight reserve-absorbing operations. At the same time, marginal opportunity costs fluctuated with the monetary policy rate because the deposit rate has been unremunerated, as discussed above. The framework hence provides strong incentives to trade in the money market, which has had a daily turnover of close to 5% of GDP.
Conclusion
This article proposes a new taxonomy for classifying operational frameworks. By focusing on two key dimensions – the marginal opportunity cost of holding reserves and the aggregate quantity of reserves – the taxonomy captures the ways in which central bank frameworks shape banks' incentives and financial market outcomes.
Applying the taxonomy to real-world operational frameworks uncovers surprising similarities between frameworks commonly regarded as distinct and highlights how similar designs can yield very different outcomes. It also sheds light on the evolution of operational frameworks over time, particularly in response to shifts in central bank balance sheet expansions and contractions. This granular approach not only enhances cross-country comparisons but also provides a more accurate understanding of how operational frameworks influence liquidity management and market behaviour.
References
Acharya, V, R Chauhan, R Rajan and S Steffen (2024): "Liquidity dependence and the waxing and waning of central bank balance sheets", NBER Working Paper, no 31050, December.
Afonso, G, D Giannone, G La Spada and J Williams (2024): "Scarce, abundant, or ample? A time-varying model of the reserve demand curve", Federal Reserve Bank of New York Staff Working Papers, no 1019, May.
Bailey, A (2024): "The importance of central bank reserves", lecture in honour of Charles Goodhart, London School of Economics, 21 May.
Bindseil, U (2024): Monetary policy implementation: theory, past and present, Oxford University Press.
Bindseil, U and J Jabłecki (2011): "The optimal width of the central bank standing facilities corridor and banks' day-to-day liquidity management", ECB Working Paper, no 1350.
Blasques, F, F Bräuning and I Van Lelyveld (2018): "A dynamic network model of the unsecured interbank lending market", Journal of Economic Dynamics and Control, vol 90, pp 310–42.
Borio, C (2023): "Getting up from the floor", BIS Working Papers, no 1100, May.
Borio, C, P Disyatat and A Schrimpf (2024): "The double-faced demand for bank reserves and its implications", VoxEU.org, 15 February.
Cantú, C, P Cavallino, F De Fiore and J Yetman (2021): "A global database on central banks' monetary responses to Covid-19", BIS Working Papers, no 934, March.
Cap, A, M Drehmann and A Schrimpf (2020): "Changes in monetary policy operating procedures over the last decade: Insights from a new database", BIS Quarterly Review, December, pp 27–39.
Central Bank of Norway (2014): "Banks' assessment of Norges Bank's liquidity management", Norges Bank Papers, no 4/2014.
----- (2021): "Norges Bank's liquidity policy: principles and design", Norges Bank Papers, no 3/2021.
Drehmann, M and K Nikolaou (2013): "Funding liquidity risk: definition and measurement", Journal of Banking and Finance, vol 37, no 7, pp 2173–82.
European Central Bank (ECB) (2024): "Changes to the operational framework for implementing monetary policy", statement by the Governing Council, 13 March.
Kent, C (2024): "The future system for monetary policy implementation", speech at the Bloomberg Australia Briefing, Sydney, 2 April.
Lagos, R and G Navarro (2023): "Monetary policy operations: theory, evidence, and tools for quantitative analysis", NBER Working Papers, no 31370, June.
Logan, L (2023): "Ample reserves and the Friedman rule", speech at the European Central Bank Conference on Money Markets, Frankfurt, 10 November.
Lopez-Salido, D and A Vissing-Jorgensen (2023): "Reserve demand, interest rate control, and quantitative tightening", SSRN Working Paper, March.
Maechler, A and T Moser (2022): "Return to positive interest rates: why reserve tiering?", speech at the Money Market Event, Geneva, 17 November.
Poole, W (1968): "Commercial bank reserve management in a stochastic model: implications for monetary policy", The Journal of Finance, vol 23, no 5, pp 769–91.
Footnotes
1 The views expressed in this publication are those of the authors and not necessarily those of the BIS or its member central banks. We thank Albert Pierres Tejada for excellent research assistance. For helpful comments, we are also grateful to Claudio Borio, Gaston Gelos, Patrick McGuire, Daniel Rees, Kilian Rieder, Andreas Schrimpf, Hyun Song Shin, Frank Smets, Nikola Tarashev and John Williams. Our thinking regarding the taxonomy, country-specific details and data availability benefited from conversations with central bank practitioners. Special thanks go to Chanutaporn Boonsongsawat, Rodrigo Cano and Per Åsberg-Sommar. All remaining errors are our own.
2 See Cap et al (2020) for a detailed discussion about changes in operational frameworks after the Great Financial Crisis and Cantú et al (2021) for a discussion of central banks' monetary response to the pandemic.
3 Not all central bank operational targets are overnight money market rates. Some central banks have targeted a longer-term rate (eg the three-month or the 10-year rate) or the foreign exchange rate.
4 The former case is often referred to as an ample supply of reserves, while the latter case is often referred to as an abundant supply of reserves.
5 These features remain central to recent papers that incorporate search and matching, bargaining and heterogenous market participants in the money market (eg Lagos and Navarro (2024)).
6 All four archetypes have been used at various times: ceiling systems were common around the turn of the 20th century when standing lending facilities were often the main tool used by central banks to supply reserves; corridor systems were common around the turn of the 21st century; and floor and tiered systems have become more common in recent years as some central bank balance sheets have grown alongside foreign exchange intervention and unconventional monetary policies (Bindseil (2024)).
7 If there is more than one overnight market rate – for example, an interbank unsecured rate and an interbank secured rate – we use whichever constitutes the central bank's operational target. If neither does, we use whichever is a reference rate, or whichever market is larger.
8 See, for instance, Bindseil and Jablecki (2011) and Blasques et al (2018).
9 We define funding liquidity as the ability to settle obligations with immediacy (Drehmann and Nikolaou (2013)). Consequenly, funding liquidity risk is the possibility that over a specific horizon the bank will become unable to settle obligations with immediacy, which depends on future in- and outflows including obtaining reserves from different sources such as the interbank market or selling assets.
10 An example of behavioural shifts by banks in response to central banks' reserve supply is the case of Norway, where the central bank operated a floor system from 1990 to 2011. During this period, the Central Bank of Norway had to consistently increase its supply of reserves to maintain the short-term money market rate near the deposit rate. This trend was especially pronounced following the Great Financial Crisis. In October 2011, the central bank transitioned to a tiering system with a high marginal opportunity cost of holding reserves. Since implementing this new framework, the level of reserves has remained constant. See Central Bank of Norway (2014, 2021).
11 See eg Maechler and Moser (2022), Lopez-Salido et al (2023), Afonso et al (2024) or Borio et al (2024).
12 In theory, once the average opportunity cost of holding reserves reaches zero (ie the central bank operates on the flat part of the reserves demand curve) the central bank can increase reserve supply without the average opportunity cost falling further. However, this might not necessarily be the case in practice, if key money market participants (eg non-bank financial institutions) do not have access to the deposit facility and there are limits to arbitrage for central bank counterparties. Indeed, there has been a "leaky floor" in the United States (for a long time) and the euro area (more recently) where money market rates have fallen below the deposit rate – a negative opportunity cost.
13 The Markets Committee Compendium on monetary policy frameworks and central bank market operations provides a detailed overview across a wide range of dimensions for nearly 30 countries. See www.bis.org/mc/compendium.htm?m=147.
14 Demand-driven frameworks are often implemented via fixed-price full allotment repo auctions, ie banks tell the central bank the quantity of reserves they want (at the fixed interest rate), and the central bank supplies this quantity in full to banks. Meanwhile, one way to implement supply-driven frameworks is for the central bank to hold a variable rate repo auction to allocate a fixed quantity of reserves to bidding banks. Another is for the central bank to purchase a set quantity of securities in the market.
15 See eg Bailey (2024), ECB (2024) and Kent (2024).
16 These instruments cannot be used to settle payments, but they share similar risk and liquidity characteristics with reserves. Whether a central bank non-reserve liability is sufficiently similar to reserves to include in our definition is to some extent a matter of judgment and will depend on the context of each jurisdiction. For the purposes of this article, we include central bank liabilities that mature the following day such as reverse repos with an overnight maturity. This is empirically relevant for Mexico, Sweden and Thailand.
17 The timing and specifics of the reserve-absorbing operations differ in Mexico and Thailand. In Mexico, reserves are absorbed near the end of the trading day through an auction with a maximum price capped at the policy rate. In Thailand, the central bank offers fixed-price full-allotment overnight reverse repos at the policy rate early each morning.