Life insurance companies – the missing relief from rising interest rates
Box extracted from Overview chapter "Markets adjust to 'higher for longer'"
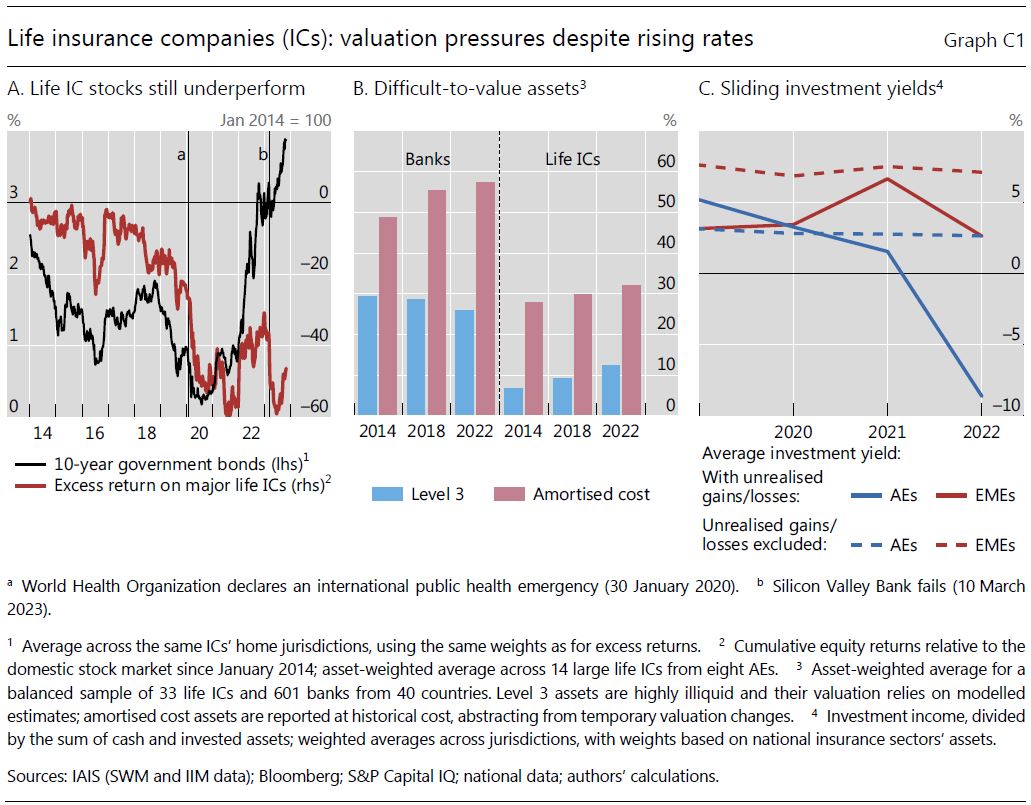
Given that life insurance companies' (ICs) valuations came under pressure during the low-for-long era, a natural question is whether the global monetary policy tightening has brought relief. Since life ICs' liabilities are generally of longer maturity than their assets, a decline in bond yields tends to make the discounted present value of these liabilities rise by more than that of the assets (a "negative duration gap"). To the extent that it remains unhedged, the negative duration gap would be an important headwind, thus helping to explain the underperformance of life ICs' stock prices relative to broader indices up to end-2020. However, this underperformance has not gone into reverse with the rise in yields as policy rates soared over the past two years (Graph C1.A).
In this box, we discuss potential reasons for the lack of relief for life ICs' stock prices. We point to the evolution of the shape of the yield curve and to the risk that – similar to banks' experience in March 2023 – liquidity needs force life ICs to recognise yet unrecognised losses. We conclude by highlighting challenges that life ICs may need to overcome as the effects of monetary tightening play out through the system.
Our analysis draws on several data sources. Two come from the International Association of Insurance Supervisors (IAIS) and underpin its monitoring of risks in the global insurance sector. The first data source, Sector-Wide Monitoring (SWM), is at the national insurance sector level. It covers 30 advanced economies (AEs) and 15 emerging market economies (EMEs), with life ICs accounting for over 70% of total assets in the median country.
 The second source, Individual Insurer Monitoring (IIM), is at the consolidated group level. From it, we obtain data on nearly 50 major life and composite ICs headquartered in 11 AEs and seven EMEs. We complement these yearly data sets, which extend from 2019 to 2022, with longer market and balance sheet data on life ICs and banks.
When it comes to the value of life ICs' equity, there are signs that the level and shape of the yield curve have been pulling in opposite directions. On the one hand, given generally negative duration gaps – two years on average across major life ICs – a parallel upward shift in the yield curve, as observed at the start of the monetary tightening cycle in early 2022, would have boosted the value of equity. On the other hand, the rise of yields at the shorter end of the curve above those at the longer end – ie the inversion of the curve as of late-2022 – could have partly offset this effect by imposing a higher discount rate for life ICs' fixed income assets than for their liabilities. Depending on the specific composition of individual ICs' balance sheets, the asset losses can even surpass benefits on the liability side.
With the surge in discount rates, the exposure of investors in life ICs' equity to unrealised losses – which accumulate on various assets not measured at fair value through profit or loss – has also gained in importance. The level of such losses is inherently difficult to assess for so-called Level 3 assets (ie complex or highly illiquid instruments), for which balance sheet values are typically based on model estimates. There are similar difficulties with assets held at amortised cost (typically loans and mortgages without an active market), which do not reflect changes in market valuations viewed as temporary. The shares of Level 3 and amortised cost assets on life ICs' balance sheets stood at 12% and 32% in 2022, respectively, compared with 26% and 57% for banks (Graph C1.B). By contrast, unrealised losses are known for those securities whose market value affects book equity but not accounting profits. For example, this is the case for parts of sovereign and corporate bond portfolios, with the overall size of these portfolios representing about half of the total investments covered by the IIM data set. Unrealised losses in such portfolios built up in the course of 2022 for life ICs, especially AE entities (Graph C1.C). In all these cases, the key underlying question is whether the accumulated losses may undermine life ICs' performance and capital positions if liquidity needs force them to sell the underlying assets.
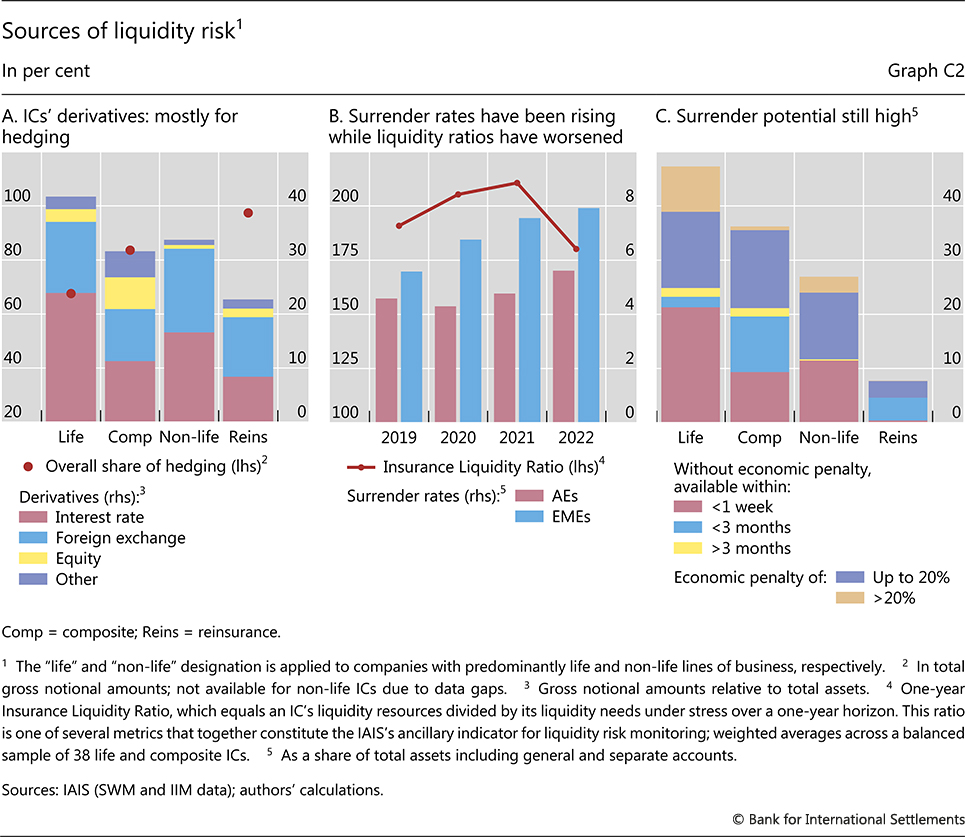
One potential source of liquidity needs are derivatives-related margin calls. ICs in general, and life ICs in particular, hold material gross derivatives positions, mostly for hedging purposes (Graph C2.A). Given their negative duration gap, the risk of falling interest rates is one of the main risks that life ICs seek to hedge, at least partially – about half of their derivatives portfolio is comprised of interest rate derivatives, with a gross notional amount equivalent to about 20% of total assets on average. When interest rates rise, however, ICs incur losses on their derivatives' market value and have to post variation margins. High volatility can lead to additional, initial margin requirements. In each case, margins drain the entity's liquidity.
Liquidity pressure on life ICs could also arise from policy surrenders, which are on the increase. In 2022, the share of surrenders in outstanding life policies reached 5.5% in AEs and 8% in EMEs (Graph C2.B, bars). Policies with guaranteed but low rates, such as those issued during the low-for-long era, could prove particularly susceptible to surrenders, given the availability of alternative investments with higher returns (eg term deposits, investment funds). In the face of surrenders, ICs experience either a decline in liquid assets, if policies are not replaced, or a decline in profits, if policyholders switch to new policies that offer higher benefits.
Even though ICs generally have buffers to cushion an increase in liquidity needs, so that they can avoid realising losses on assets they do not intend to sell, there seem to be pockets of vulnerability. In 2022, a key measure of these buffers, the one-year Insurance Liquidity Ratio (ILR), averaged 180% across the life and composite ICs in the IIM (Graph C2.B, line). This is despite a sharp decline in that year, due to higher interest rates depressing the value of ICs' liquid assets (the ILR numerator) amid rising liquidity needs, eg because of surrenders (the ILR denominator). That said, four of these ICs reported an ILR of less than 100% at end-2022, indicating potential liquidity shortage under stress.
Going forward, the performance of life ICs will depend on how they manage liquidity as well as credit risks. Liquidity management would need to address the risk of margin calls, which are an inherent feature of derivatives positions, as well as surrender risk. For major life ICs, the policies that allow surrenders amount on average to nearly 50% of total assets, a higher share than for non-life and other ICs (Graph C2.C). For about half of these, contractual penalties on policyholders provide protection to the insurer against surrenders; for the other half, any protection stems mainly from tax treatments that raise the effective cost of surrenders. Alongside the risk of liquidity needs, credit risk has come to the fore, as debt servicing costs have increased for many borrowers on the back of soaring interest rates. While life ICs typically focus on highly rated securities, credit losses could emerge from exposure to real estate, a sector particularly hit by the pandemic and monetary policy tightening. Losses could also materialise in private credit, an opaque corner of the system where some life ICs sought to compensate for meagre interest income during the low-for-long era.
The views expressed are those of the authors and do not necessarily represent the views of the Bank for International Settlements or the International Association of Insurance Supervisors (IAIS). For a discussion of the IAIS's most recent Global Monitoring Exercise, see IAIS, Global insurance market report 2023, forthcoming. Non-life ICs are as far as possible excluded from the analysis (they are not separated from life ICs only in Graph C1.C), as they are less exposed to the factors discussed in this box. Major non-life ICs report an average duration of liabilities of eight years and a duration gap of –1.5 years as of end-2022. These numbers are 11 and –2 years for major life ICs. In principle, some sovereign or corporate bonds may be held at amortised cost, where unrealised losses affect neither accounting profits nor capital. However, this accounting treatment is reportedly less prevalent among life ICs than banks. For a recent analysis of the decline in European ICs' credit quality, see J Brinkhoff and J Sole, "Did insurers become risk-loving during 'low-for-long'? The role of returns, ratings, and regulation", IMF Working Papers, no 2022/202, 2022.