Labour markets: what explains the resilience?

The post-pandemic recovery features significant tightness in labour markets – a situation where jobs are plentiful and available workers scarce. This special feature discusses the possible role of supply and demand factors for this tightness and the attendant contrast between buoyant employment and lacklustre output growth. We find that labour hoarding on the demand side, and adverse demographic trends and pandemic-related preference shifts on the supply side, can go a long way in explaining these dynamics. Finally, we relate labour market developments and their persistence to the inflation outlook and monetary policy trade-offs. 1
JEL classification: E24, J1, J2, J3, J63, J64.
Introduction
One constant during the post-pandemic recovery has been the tightness of labour markets. The labour market is said to be "tight" when the imbalance between labour supply and labour demand manifests itself in an abundance of job opportunities along with a scarcity of workers available and willing to take those jobs. This phenomenon has gone hand in hand with a job-rich recovery as economies started reopening after the acute phase of Covid-19, with unemployment plummeting in many countries and employment growing surprisingly strongly given the path of output.
What supply and demand factors in the labour market could explain this labour market resilience? We seek to provide some answers to this question in order to shed light on how current tightness could affect the outlook for inflation. In particular, this outlook depends on unit labour costs, which are more likely to rise when strong labour demand chases workers against the backdrop of constrained labour supply.
Our findings are as follows. First, there is rather widespread tightness in labour markets – especially among advanced economies (AEs). This is the message of standard indicators, such as the unemployment rate and the vacancy-to-unemployment ratio. Second, a constellation of factors have led to labour demand outstripping labour supply. On the supply side, subdued growth in working age population and shifts in labour force participation have played a role. In addition, workers' preferences have shifted in favour of fewer working hours. On the demand side, there are signs that uncertain hiring prospects in some sectors have led firms to hoard labour, ie that tightness begets tightness. Further, excess demand for labour has been concentrated in sectors shunned by workers during the pandemic. These factors can explain why labour markets have been surprisingly resilient even as growth has been losing momentum.
Key takeaways
- Labour markets recovered rapidly after the Covid-19 pandemic and remain tight: in many countries, jobs are plentiful and available workers scarce.
- Labour hoarding by employers, demographic trends and shifting attitudes towards work can explain labour market tightness and how it culminated in a job-rich recovery.
- Going forward, the strength and persistence of the shifts in supply and demand for labour will be an important determinant of inflation dynamics.
The rest of the feature is organised as follows. The next section takes stock of current labour market indicators to assess the degree of tightness in a large number of countries. It then seeks to explain changes in supply of and demand for labour and, in that context, the factors behind the job-rich recovery. The concluding section discusses the implications of the recent dynamics for inflation and monetary policy.
Taking stock of current labour market indicators
Evaluating the state of the labour market can be difficult, and usually relies on a holistic reading of various quantity (eg employment) and price (eg wage) measures. Labour market indicators are indeed subject to significant lags and uncertainty and may provide conflicting signals, in particular when they overlook composition effects across heterogeneous workers and employers. Such caveats aside, since the pandemic several measures do point on balance to widespread labour market tightness in relation to historical norms, albeit with some variation across countries.2
Unemployment rates – the most standard measure of labour market slack – are currently close to the lows seen in the past decade in all major AEs as well as in several emerging market economies (EMEs) (Graph 1.A). In some jurisdictions, such as the euro area, they are at historical troughs. Exceptions to this pattern are China and Malaysia, where unemployment rates are in line with long-term norms and, South Africa, where the unemployment rate is running high by historical standards.
Other metrics generally confirm and, in the case of several AEs, reinforce this picture of tightness. Vacancy-to-unemployment ratios – which capture the availability of jobs relative to those actively looking for one – have generally increased relative to the three-year period preceding the pandemic (Graph 1.B). In EMEs, where data on vacancies are limited, the picture is more mixed than in AEs.3
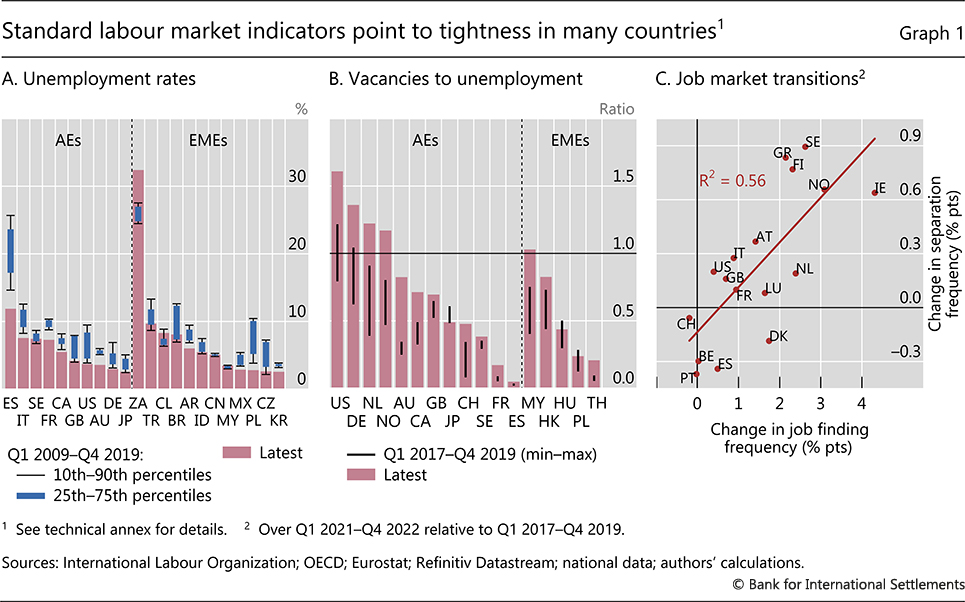
Another set of indicators focusing on labour market flows, the so-called labour turnover, or "churn", also point to significant labour market tightness.4 In AEs, gross flows in and out of employment, ie the rates at which those without a job find one and those with a job leave it, have increased since the pandemic (Graph 1.C). This is consistent not only with falling unemployment rates but also with people feeling more comfortable switching jobs, in search of better opportunities, as the risk of long unemployment spells looks limited.
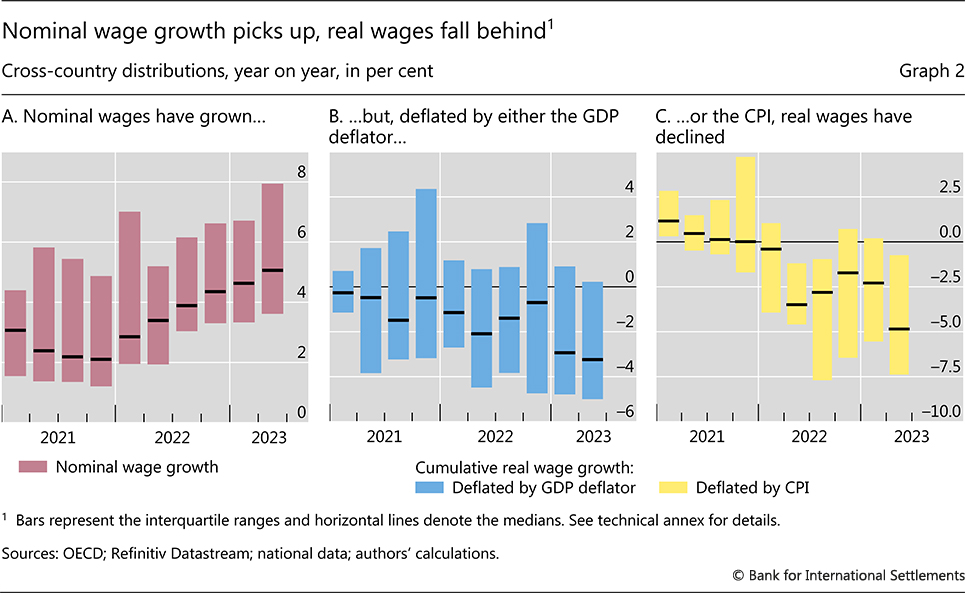
Switching from quantity to price indicators and turning to wage growth, the picture is less clear-cut.5 Wage growth has picked up in nominal terms (Graph 2.A) but has mostly fallen short of inflation, leaving real wage growth in negative territory (Graphs 2.B and 2.C).
Several factors could be at play here. One is the big element of surprise in current inflation, which has made it hard for wages to catch up after a long period of price stability.6 In addition, wages can be slow-moving since they are often set for a horizon of multiple years. It may just be a matter of time before they pick up and workers recoup accumulated losses. Finally, decisive central bank actions have helped to keep inflation expectations, especially the longer-term ones, in check. This, in turn, may have curbed incentives to negotiate for even higher nominal wages or for indexation mechanisms to protect against erosion of real wages by realised inflation.
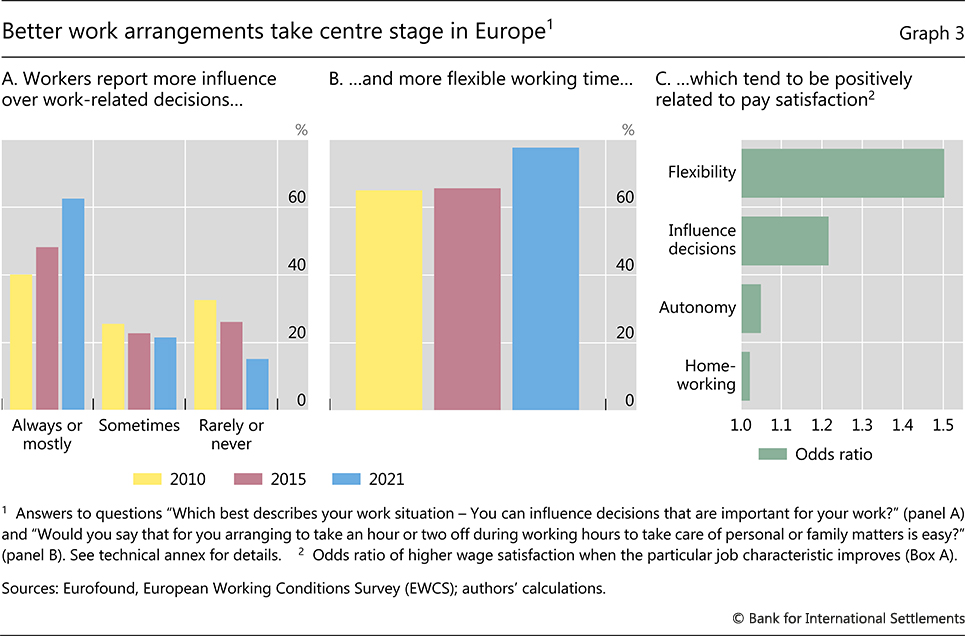
To investigate what could blur the signals from wages as regards labour market tightness, we consider the growing importance of non-pecuniary benefits. Mandatory telework during the Covid crisis has left its imprint on working practices. According to the 2021 European Working Conditions Survey (EWCS), workers now report more autonomy and influence over decisions (Graph 3.A). They also mention more flexible hours (Graph 3.B).7 Three quarters of workers now find it easy to arrange to take an hour or two off during working hours to take care of personal or family matters, about 15 percentage points improvement compared with the period before the pandemic.
Empirical analysis confirms that flexible work arrangements come hand in hand with higher levels of pay satisfaction (Box A). The odds of higher pay satisfaction are higher for employees benefiting from flexible working arrangements (Graph 3.C). More specifically, the likelihood that an employee belongs to the "highest pay satisfaction" group is 20 percentage points higher if that employee reports "very flexible" rather than "very inflexible" work time. Confirming these large empirical magnitudes, Maestas et al (2023) estimate that the value of non-pecuniary benefits can be the equivalent of wage increases as large as 4–9%. This cross-sectional evidence suggests that nominal wages may not have grown as fast as they otherwise would have after the pandemic as more employers substituted pay rises with non-pecuniary benefits.8
Understanding the drivers of slack and the job-rich recovery
To understand how current labour market tightness could affect wage formation and inflation, one needs to consider the respective roles of the supply and the demand for labour, and their possible evolution going forward. While distinguishing the two may be conceptually clear and simple, in practice the lines separating supply and demand can be blurry. With these caveats in mind, we first provide empirical proxies for labour supply and demand, and then discuss their relative trends.
Proxies for labour supply and labour demand
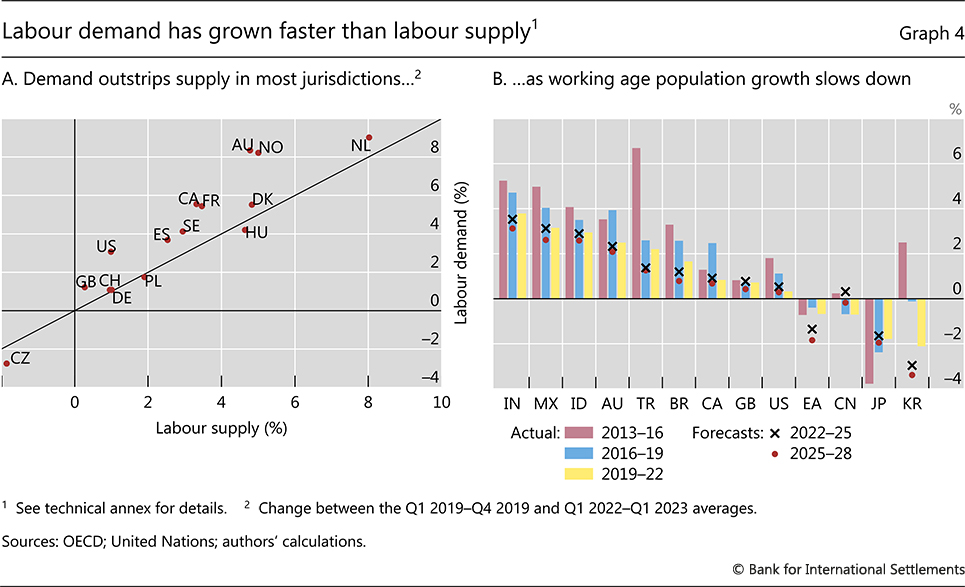
Standard metrics of labour supply and labour demand offer a view of any imbalances in the market. To measure labour supply, we sum the labour force (the working age population that participates in the labour market) and marginally attached workers.9 In turn, we proxy labour demand by adding employment (satisfied demand for labour) and unfilled vacancies (unsatisfied demand for labour).
Based on these metrics, the demand for labour has expanded more rapidly than the supply of labour since 2019. This is true for several jurisdictions, most notably Australia, Canada, France and the United States (Graph 4.A). Labour demand outgrowing labour supply owes to a constellation of factors, which we discuss next distinguishing between supply and demand side developments.
Developments on the labour supply side
The working age population has grown more slowly since the pandemic than during the 2010s in many countries (Graph 4.B). In most European and some Asian countries, it shrank, intensifying pre-pandemic trends. In a few cases (eg Australia and Canada), reduced migration has been a key factor.
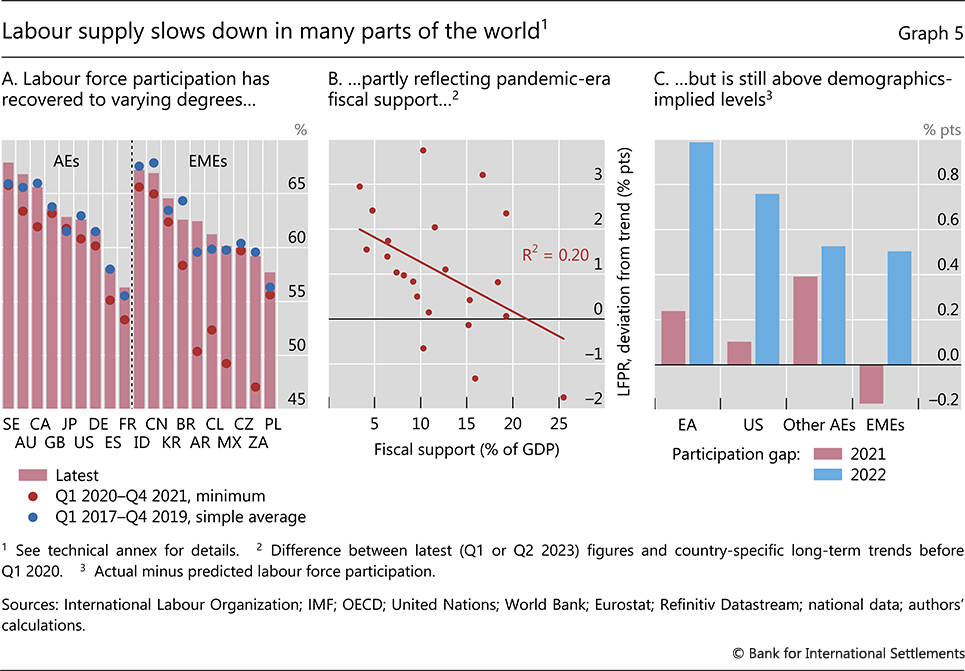
Labour force participation rates have also faced downward pressure, from both cyclical and structural forces. After large declines during the pandemic, the labour force participation rate has generally recovered, but there are some notable exceptions (Graph 5.A, red dots compared with the columns). In Canada, the United Kingdom, the US and quite a few EMEs (including China), participation rates are still below pre-Covid benchmarks (blue dots compared with the columns). In part, this reflects cyclical forces, as the pandemic's legacy is still lingering. In addition to being held back by health concerns,10 participation has been recovering more slowly where pandemic-related fiscal support was larger (Graph 5.B).11 Downward pressure could also stem from population ageing, which tends to imply a decline in labour force participation rates. The positive gap between current participation rates and demographics-implied levels should close in most jurisdictions (Graph 5.C).12
Developments on the labour demand side
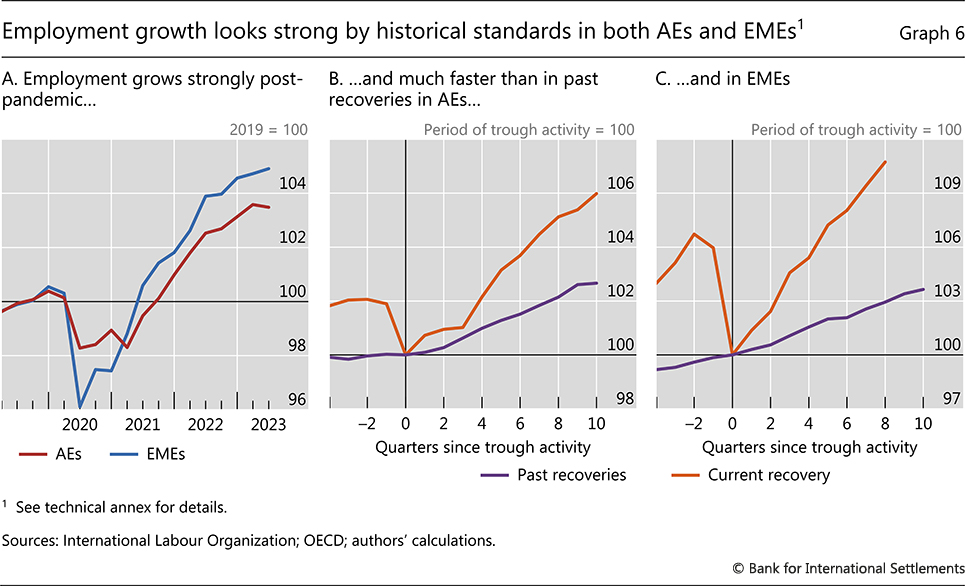
Employment (the "satisfied" portion of labour demand) has grown rapidly since the Covid recession trough, in both AEs and EMEs (Graph 6.A). In EMEs, for instance, the rebound has been particularly strong, with employment expanding by almost 10% since the pandemic troughs. Compared with the typical past rebound, employment in AEs and EMEs has expanded 3 and 7 percentage points faster, respectively, in the current expansion (Graphs 6.B and 6.C).
In contrast to past experience, the current expansion has been "job-rich" as opposed to "job-less".13 One indication is that unemployment rates have dropped approximately twice as fast than one would expect on the basis of historical experience and current output growth. Okun's law estimates reveal that a 1 percentage point increase in GDP growth now corresponds to a 0.3 percentage point drop in unemployment, compared with only about 0.15 percentage points in past recoveries.
It is possible to shed light on the factors behind the current job-rich recovery by dissecting the employment-output nexus. To do so, we rely on a simple identity whereby GDP is the combination of output per hour, hours per worker and employment (Graph 7). We take GDP as given – determined by aggregate demand at cyclical frequencies – and consider the relative evolution of its components.
Four non-mutually exclusive factors could help to account for the recovery's job-rich nature. While some are hard to quantify, one can get a sense of their relevance.
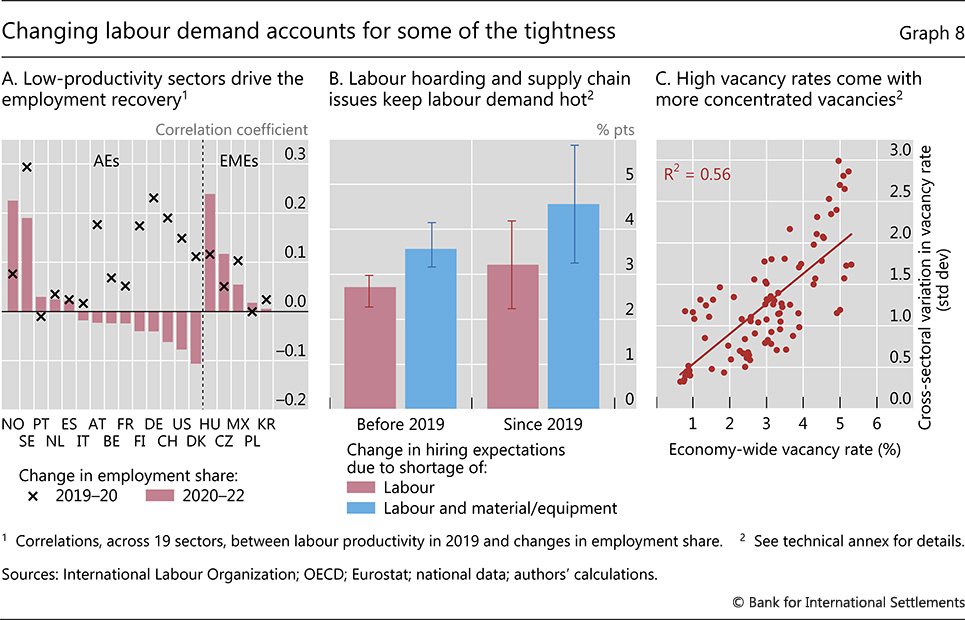
First, output per hour – a measure of productivity – has been subdued, especially in the euro area (Graph 7, red bars). One possible reason is the recovery's sectoral composition. As a result of large rotations in consumption post-Covid, much of the recent employment creation has taken place in lower-productivity sectors, such as the contact-intensive "services, recreation and accommodation" (Graph 8.A, red columns). That said, the magnitude of this effect seems small. Estimates reflecting AE data suggest that a service-intensive expansion implies around 0.15 percentage points lower productivity growth on average over two years than a manufacturing-led one. Another possible reason is a pandemic-induced erosion of skills. But again, this seems unlikely to be material, given that unemployment spells were short and employer-employee relations were maintained through furlough schemes in many countries.14
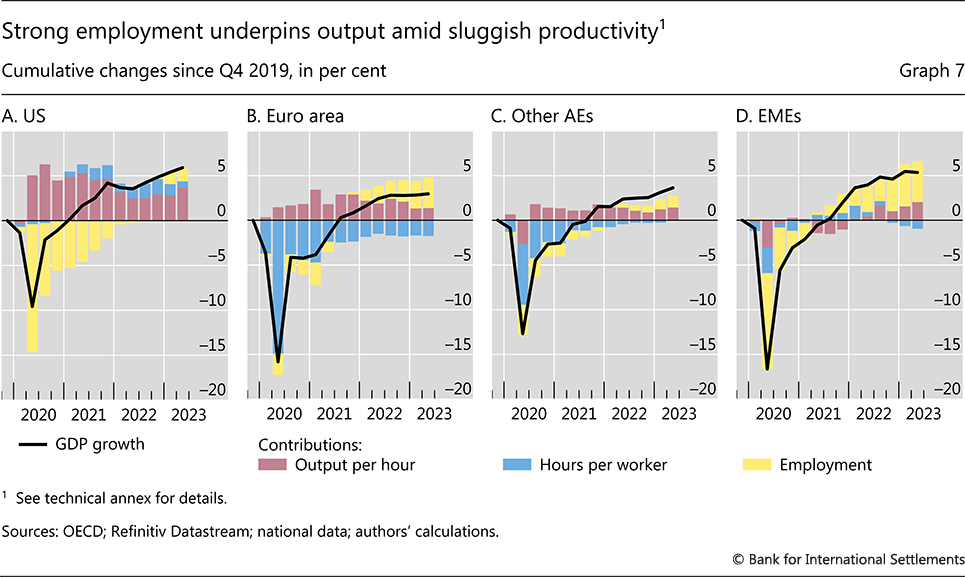
Second, firms may have been hoarding labour. Flat, if not declining, hours per worker coinciding with buoyant employment is consistent with this interpretation (Graph 7, blue bars). This development is, again, particularly visible in the euro area, in part reflecting the prevalence of worker retainment programmes. One should also consider that a tight labour market can foster labour hoarding. The prospect of hiring difficulties materially limiting output induces firms to add labour as a precaution (Graph 8.B). If so, tightness may beget tightness. But hiring intentions also increase when firms face difficulties in sourcing their non-labour inputs. In the post-Covid recovery, these may reflect supply chain disruptions (Graph 8.B, blue bars). Such difficulties may lead firms to switch to more labour-intensive substitutes, including in-house production.
We estimate the extent to which hiring intentions relate to hiring difficulties and difficulties to source inputs (Box B). Our objects of interest are "net hiring intentions" (HI) - ie the fraction of firms planning to expand their workforce minus the fraction planning the opposite. On the basis of estimates using data from 2019 onwards, we find that HI increases by 3.2 percentage points in response to a one standard deviation increase in the fraction of firms reporting labour bottlenecks.15 This estimate rises to 4.6 percentage points if we add the impact from a one standard deviation increase in the fraction of firms reporting materials as a bottleneck. Translated into actual hiring, this could imply employment increasing by as much as 1.3%.
Third, workers may want to work fewer hours. Survey evidence suggests so, with the pandemic being one of the drivers.16 This would be observationally equivalent to labour hoarding since average hours worked would fall and employment would rise.
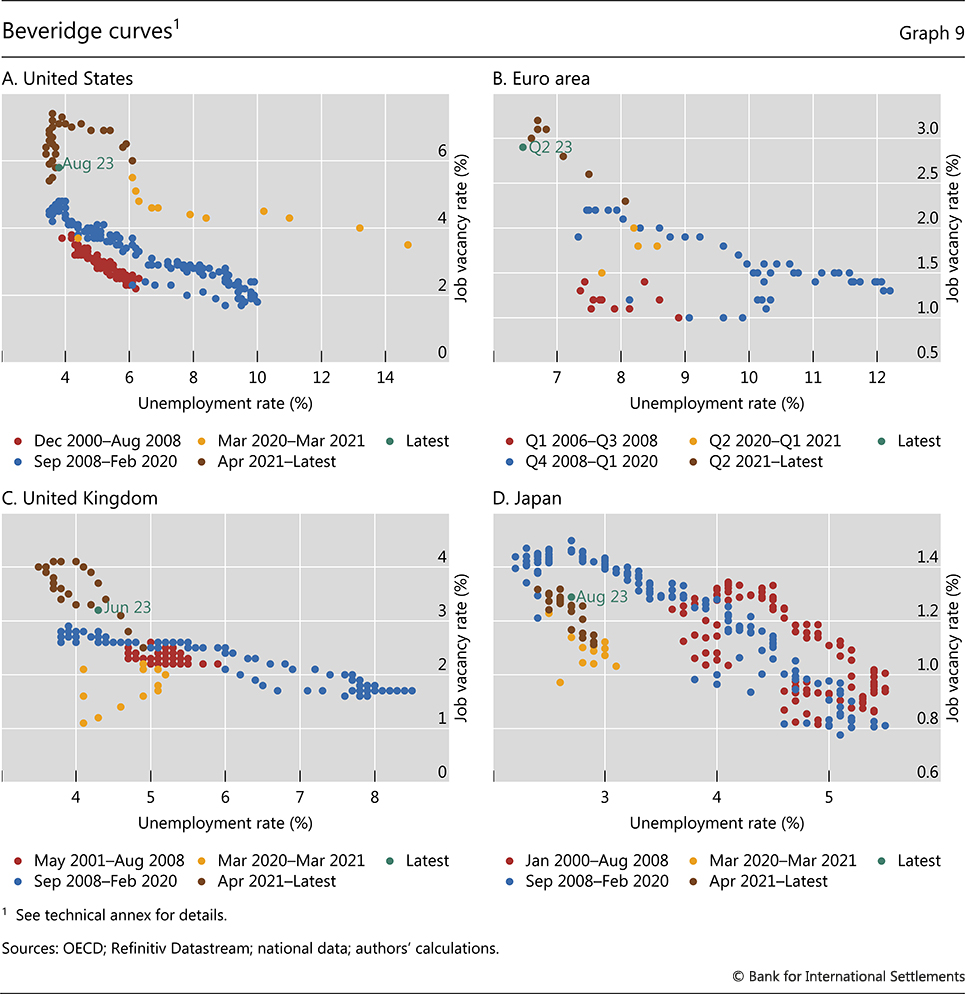
In turn, "unsatisfied demand", as captured by vacancies, is unusually large. That is, there are more job openings on offer for the same level of unemployment than in the past – the Beveridge curve has shifted outwards (Graph 9). This is particularly visible in the US but also in the UK. Such a shift has therefore materialised even in jurisdictions where worker-firm relationships have remained in place. In these cases, the driver for the abnormal excess demand goes beyond the challenge of finding workers with the right skills or experience.
There are several possible explanations for unsatisfied demand. One is the sheer speed of the recovery, as a more rapid return of GDP to its pre-Covid level has usually translated into larger increases in the vacancy-to-unemployment ratio. Another possibility could be that people have been shunning the sectors where labour demand has been higher. For instance, anecdotal evidence suggests that the experience with Covid-19 has reduced labour supply in contact-intensive sectors. Indeed, unfilled vacancies in such sectors – notably, recreation and accommodation – have been especially high in the later stage of the recovery. Furthermore, lingering health concerns from Covid could also be playing out. Yet another possibility is the sectoral reallocation. Additional labour demand in the post-Covid period has emanated from a small set of sectors, as high aggregate vacancy rates have come hand in hand with more dispersed vacancy rates across sectors (Graph 8.C).17,18
Policy considerations
While by no means the only factor, labour market tightness is key to assessing future wage growth and possible related inflationary pressures. This is because, in tighter markets, there is a greater likelihood that bargaining power will shift in favour of workers and pass-through between wages and prices will gain strength (BIS (2023) and Borio et al (2023)). The evolution of the labour market will reflect the intensity and persistence of the demand and supply factors driving the job-rich post-pandemic recovery examined above.
On the one hand, the specific factors behind the unusually strong labour market tightness may quickly fade away. The pandemic's legacy has been, by and large, short-lived, and reallocation movements are now largely completed. In addition, changes in work preferences curtailing labour supply have proven mostly temporary and labour hoarding could easily dissipate if the global economy keeps slowing down. And, since willingness to work trails the business cycle, the recovery in participation rates is likely to continue even as the economy cools down (Hobijn and Şahin (2021)).
On the other hand, even if the pandemic experience does not leave a long-lasting imprint on the behaviour of workers and firms, structural, longer-term forces may keep labour markets tight. Labour supply may remain subdued because of adverse demographic trends, and the current reconfiguration of global supply chains – the so-called reshoring movement – could reinforce the shift in firms' business models from "just in time" to "just in case". This would lead firms to build extra buffers, including on the labour side, which could then generate upward pressure on wages and, in turn, prices. The implications for inflation would be even greater short of a pickup in labour productivity growth.
The balance of these forces, which naturally varies across countries, will be an important factor influencing monetary policy. There is an agreement that a stance committed to bringing inflation back to target is essential to limit the erosion of real wages. Sustaining this commitment will be particularly important in economies where labour market tightness is more persistent, the bargaining power of labour is stronger and/or wage adjustments take longer (eg because of multi-year contracts). In such economies, the monetary policy trade-offs will be starker.
References
Abraham, K and L Rendell (2023): "Where are the missing workers?", BPEA Conference Draft, Spring.
Arce, O, A Consolo, A Dias da Silva and M Mohr (2023): "More jobs but fewer working hours", ECB Blog, 7 June.
Barrero, J, N Bloom and S Davis (2023): "The evolution of work from home", University of Chicago, Becker Friedman Institute for Economics Working Paper, no 2023-116.
----- (2023): "Navigating the disinflation journey", Annual Economic Report 2023, June, Chapter I.
Borio, C, M Lombardi, J Yetman and E Zakrajšek (2023): "The two-regime view of inflation", BIS Papers, no 133, March.
Bloom, N, R Han and J Liang (2023): "How hybrid working from home works out", NBER Working Paper 30292.
Bloom, N, J Liang, J Roberts and Z Ying (2015): "Does working from home work? Evidence from a Chinese experiment", Quarterly Journal of Economics, vol 130, no 1.
Choudhury, P, C Foroughi and B Larson (2021): "Work-from-anywhere: The productivity effects of geographic flexibility", Strategic Management Journal, vol 42, no 4.
Choudhury, P, T Khanna, C Makridis and K Schirmann (2022): "Is hybrid work the best of both worlds? Evidence from a field experiment", mimeo.
Donovan, K, W Lu and T Schoellman (2023): "Labor market dynamics and development", Quarterly Journal of Economics, vol 138, no 4.
Emanuel, N and E Harrington (2023): "Working remotely? Selection, treatment and the market for remote work", Federal Reserve Bank of New York Staff Reports, no 1061.
Emanuel, N, E Harrington and A Pallais (2023): "The power of proximity to coworkers: training for tomorrow or productivity today?", mimeo.
Engbom, N (2022): "Labor market fluidity and human capital accumulation", NBER Working Papers, no 29698.
Eurofound (2022): "Working conditions in the time of COVID-19: Implications for the future", European Working Conditions Telephone Survey 2021.
Gibbs, M, F Mengel and C Siemroth (2023): "Work from home and productivity: evidence from personnel and analytics data on information technology professionals", Journal of Political Economy: Microeconomics, vol 1, no 1.
Goodhart, C and M Pradhan (2020): "The great demographic reversal: ageing societies, waning inequality and an inflation revival", SUERF Policy Note, no 197.
Graetz, G and G Michaels (2017): "Is modern technology responsible for jobless recoveries?", American Economic Review, vol 107, no 5.
Hobijn, B and A Şahin (2021): "Maximum employment and the participation cycle", proceedings of the Federal Reserve Bank of Kansas City Jackson Hole symposium, August.
Li, G and C Mulas Granados (2023): "The recent decline in United Kingdom labor force participation: causes and potential remedies", IMF Selected Issues Paper, no 2023/051.
Maestas, N, K Mullen, D Powell, T von Wachter and J Wenger (2023): "The value of working conditions in the United States and implications for the structure of wages", American Economic Review, vol 113, no 7.
Organisation for Economic Co-operation and Development (OECD) (2023): OECD employment outlook 2023: artificial intelligence and the labour market.
Ravenna, F and C Walsh (2022): "Worker heterogeneity, selection, and unemployment dynamics in a pandemic", Journal of Money, Credit and Banking, vol 5(S1).
Yang, L, D Holtz, S Jaffe, S Suri, S Sinha, J Weston, C Joyce, N Shah, K Sherman, B Hecht and J Teevan (2022): "The effects of remote work on collaboration among information workers", Nature Human Behavior, vol 6.
Technical annex
Graph 1.A–B: Seasonally adjusted series; semiannual data for ID. Definitions differ among economies.
Graph 1.A: For BR, percentiles over Q2 2012–Q4 2019; for CN, over Q1 2018–Q4 2019. Latest observations for Q2 2023 except CA and US (Q3 2023) and ID (Q1 2023).
Graph 1.B: Latest observations for Q2 2023 except CH (Q3 2023), DE, ES, FR, HU, NL, PL and SE (Q1 2023).
Graph 1.C: The job finding frequency is the fraction of the unemployed and inactive that become employed in the following quarter. The job separation frequency is the fraction of the employed that become unemployed or inactive in the following quarter. For the US, changes in job finding (hiring) and separation rates as defined by the Bureau of Labor Statistics.
Graph 2: The sample covers AU, BR, CA, CL, CZ, DE, ES, FR, GB, IT, JP, KR, NL, SE, PL and US.
Graph 3: Based on survey responses from the EU countries and CH, GB, NO and TR.
Graph 3.A: Survey question: "Which best describes your work situation – You can influence decisions that are important for your work?"
Graph 3.B: Survey question: "Would you say that for you arranging to take an hour or two off during working hours to take care of personal or family matters is-?" Plot shows the share of respondents saying that it is easy.
Graph 3.C: Odds ratio based on an ordered logit regression of pay satisfaction on the four variables listed in specification (1) in Box A using individual responses to the 2021 EWCS. An odds ratio above one signals greater likelihood of higher wage satisfaction when the explanatory variable takes a higher value. All estimated coefficients are significant at the 1% level.
Graph 4.A: Labour demand is the sum of employment and vacancies; labour supply is the sum of the labour force and marginally attached workers. Marginally attached are persons aged 15 and over who are neither employed nor actively looking for work, but are willing/desire to work and are available for taking a job.
Graph 4.B: Working age population is defined as those aged 15 to 64. Forecasts use data from the UN Population Division, medium fertility variant.
Graph 5.A: Aged 15 and over. Based on seasonally adjusted quarterly series, except for CN (annual) and ID (semiannual). Latest observations for Q2 2023 except for AR (Q1 2023) and CN (2022).
Graph 5.B: The sample includes 17 AEs and five EMEs. Fiscal support is defined as the additional spending or foregone revenues. The numbers are based on official estimates covering cumulative spending in 2020 and the first four months of 2021, estimates as of 27 September 2021. LFPR = labour force participation as a percentage of working age population, aged 15 and over; seasonally adjusted.
Graph 5.C: Euro area = euro 19 excluding LU. Other AEs = AU, CA, CH, DK, GB, JP, NO, NZ and SE. EMEs = BR, CL, CO, CZ, HU, ID, IL, KR, MX, PL, RO and TR. For country groups, population-weighted average across economies. Predicted labour force participation is computed using trend estimates of labour force participation by age cohort (15–24; 25–64; 64 and older) and the corresponding shares of each age cohort in working age population.
Graph 6.A: Median employment growth based on data for 16 AEs and 10 EMEs.
Graph 6.B-C: Median percentage change in employment across output recoveries relative to t = 0 across 16 AEs and 10 EMEs, from Q1 1960 to Q1 2023. t = 0 corresponds to trough activity according to the OECD classification of turning points in the cyclical component of real GDP.
Graph 7: GDP-PPP-weighted averages for regions. Euro area = AT, BE, DE, EE, ES, FR, IE, IT, LT, NL, PT, SI and SK; other AEs = AU, CA, DK, GB, JP, NO, NZ and SE; EMEs = CZ, HU, IL, MX and PL.
Graph 8.B: Change in the net share of firms planning to hire, given a one standard deviation increase in the fraction of firms reporting a particular shortage. The empirical specification controls for capacity utilisation, the fraction of firms reporting demand or financial constraints, as a factor limiting output, and is saturated with fixed effects. The sample covers AT, DE, DK, ES, FI, FR, IT, NL, PT and SE. Sector sample covers all two-digit manufacturing sectors. Vertical lines indicate the 90% confidence interval. Before 2019 refers to Q1 2000–Q4 2018. Since 2019 refers to Q1 2019–Q2 2023.
Graph 8.C: The scatterplot shows the standard deviation of the vacancy rate across sectors against the average. The sample covers BE, DE, DK, ES, FI, FR, NL, NO, PT and SE over Q1 2021–Q1 2023.
Graph 9: For EA, JP and US, job vacancy rate is computed as the number of job vacancies divided by (number of occupied posts + number of job vacancies) multiplied by 100. For GB, job vacancy ratio is computed as the three-month rolling average ratio of vacancies per 100 employee jobs. For US, job vacancy rate for total non-farm. For EA and GB, job vacancy rate/ratio for industry, construction and services (except activities of households as employers and of extraterritorial organisations and bodies). For JP, job vacancy rate for new job openings.
1 We thank Douglas Araujo, Claudio Borio, Gaston Gelos, Marco Lombardi, Cristina Manea, Benoît Mojon, Hyun Song Shin and Nikola Tarashev for comments. Adam Cap, Burcu Erik and Emese Kuruc provided excellent research assistance. The views expressed in this article are those of the authors and do not necessarily reflect those of the Bank for International Settlements.
2 The assessment abstracts from unemployment gaps, ie the difference between the actual and natural rate of unemployment (u*), implicitly assuming a constant u* for the horizon under consideration.
3 The ratio of vacancies to unemployment remains below one in most jurisdictions. But, since data for unfilled vacancies are subject to large uncertainty, changes in the ratio are more informative.
4 Although timely data on job transitions in EMEs are limited, evidence for 2021 also points to labour market tightness in eg Brazil, Chile, Mexico and South Africa (see Donovan et al (2023)).
5 Wages are both an indicator to assess labour market tightness, as well as an outcome variable of labour market tightness. We focus here on the former aspect. The policy section discusses the latter.
6 Borio et al (2023) investigate how institutions adjust to a low-inflation environment, for instance by reducing workers' bargaining power.
7 Between 2019 and 2022, several other non-monetary aspects of job quality improved. In particular, the share of temporary contracts declined while that of job postings offering health-related benefits, retirement schemes and paid time off increased (OECD (2023)).
8 In addition, to the extent that non-pecuniary benefits are associated with reduced job mobility, they would also contribute to lower aggregate wage growth because pay rises tend to be larger for job-to-job transitions. Engbom (2022), for instance, documents that higher labour market fluidity in the form of voluntary quits and job-to-job transitions is associated with higher wage growth.
9 Marginally attached workers are defined as those who are neither employed nor actively looking for work, but willing to work and available for taking a job.
10 Abraham and Rendell (2023) estimate that health concerns, positive wealth effects due to higher asset prices, refinancing at record low interest rates and government cash payments account altogether for 60% of the decline in participation in the US, sometimes showing up as early retirements. In the UK, early retirement and long-term sickness played a key role in the 0.8% shift into inactivity of the working age population (Li and Mulas Granados (2023)).
11 It is also worth noting that marginally attached workers – which standard measures of labour force participation rate tend to overlook – were drawn back into the labour force as labour markets tightened. As a result, the pool of marginally attached workers, which increased significantly during the pandemic, shrank back to pre-pandemic levels. This transition of marginally attached workers into the labour force has led to an overstatement of the recovery in labour force participation.
12 Goodhart and Pradhan (2020) discuss the implications of such changes for inflation.
13 See Graetz and Michaels (2017) for cross-country evidence on jobless recoveries for AEs.
14 The impact of working from home on productivity is ambiguous in theory and too early to discern in the data. Managers and workers have varying opinions about how remote work affects productivity, depending, for example, on how commute time is considered (Barrero et al (2023)). On the one hand, fully remote work can lead to lower productivity because communication becomes less efficient (Emanuel and Harrington (2023), Gibbs et al (2023), Yang et al (2021), Emanuel et al (2023)). On the other hand, hybrid work arrangements may result in productivity gains as workers can tailor time allocation for tasks that require focus and for those that require interaction with others (Bloom et al (2015), Choudhury et al (2021, 2022), Bloom et al (2023)).
15 To be sure, changes in the share of firms reporting hiring difficulties or difficulties in sourcing input observed during the post-Covid recovery are one order of magnitude larger than the one historical standard deviation change considered here.
16 For instance, work-life balance considerations may have reduced preferred hours of work in Europe (Eurofound (2022)). Workers using more sick leave may also explain the reduction (Arce et al (2023)).
17 Furthermore, the interaction between labour demand and labour supply can exacerbate the difficulty of filling job vacancies. Specifically, the tighter the labour market, the more likely it is that the marginal worker is less productive. Ravenna and Walsh (2022) estimate that this labour demand and supply composition effect accounts for a 1.5% fall in measured labour productivity, even as total factor productivity stays constant.
18 This argument may be less relevant from a quantitative viewpoint. Previous recessions have also featured sizeable, and arguably longer-lasting, reallocations (eg out of the overblown construction sector in the wake of the Great Recession). And the sectors that have expanded most post-Covid are those that suffered most during the recession: the reallocation turned out to be much more limited than initially anticipated (crosses with positive values mostly correspond to columns with negative values in Graph 8.A).