Understanding the rally in equity markets
Box extracted from Overview "Perceptions of risk and policy outlook drive markets"
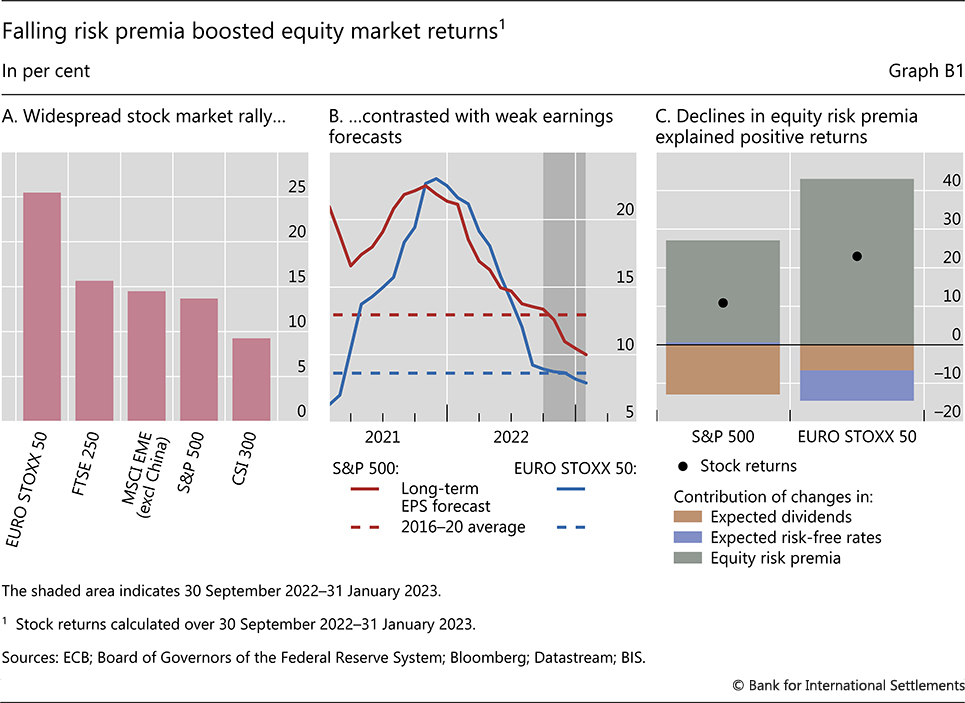
From late September to end–January, major equity markets delivered double–digit returns in Europe, the United States and EMEs. At the upper end, the EURO STOXX 50, a portfolio mostly of large French and German stocks, returned over 25% (Graph B1.A). The S&P 500 delivered a gross return of slightly over 10%, while EME (excluding Chinese) and UK stocks returned almost 15%. Chinese stocks returned slightly less than 10%, with the economy just reopening as the country's zero–Covid policy was ended. Focusing on US and euro area equity markets, this box finds that the gains reflected declines in equity risk premia, ie the compensation for risk demanded by investors, rather than firms' expected performance.
The strong run of global equity markets is hard to reconcile with the macroeconomic backdrop that weighed on expected earnings for most of the period. The long–term outlook for earnings deteriorated in the United States and the euro area. Earnings forecasts had been significantly ramped up in the quarters following the Covid–19 outbreak. But they switched towards a steady and accelerated retreat during all of 2022 (Graph B1.B). The headwinds included expectations of high and volatile energy prices, weak growth forecasts and substantial monetary policy tightening.
In simple terms, a stock's price should be equal to the present discounted value of expected future dividend payments. Thus, valuation changes have two general sources. The first one is changes in investors' perceptions of the firm's future profitability, which determine their expectations of future dividends. The second is changes in the discount rates that investors apply to the expected stream of dividends. Discount rates are composed of "risk–free" rates, capturing the time value of money, and an equity risk premium, capturing the extra compensation required by investors to hold the risky asset. The risk premium fluctuates with investors' perceptions of and appetite for risk – all else equal, a higher risk premium results in a lower price.
We rely on a standard present value model to disentangle the contributions of these sources to the returns of the S&P 500 and the EURO STOXX 50 between September 2022 and January 2023. The model is implemented with monthly averages of daily market data for each index. Expected dividends are estimated using dividend futures for the initial five years and long–term analyst expectations of earnings per share growth at longer horizons. Expected risk–free rates are estimated using zero coupon yields.
 The equity risk premium is then obtained as a residual.
The analysis suggests that the recent market rally owed entirely to the drop in equity risk premia. For both the S&P 500 and the EURO STOXX 50, expected dividends fell during the period, weighing on returns (Graph B1.C, brown bars). Expected risk–free interest rates played an indiscernible role for US equity returns during the period, but exerted a drag on European ones (purple bars), as the pace of ECB tightening picked up. However, substantial falls in equity risk premia more than offset these effects (grey bars), thus leading to the large and positive returns (dots).
The plummeting equity risk compensations required by investors could be explained, in part, by a decrease in the perceived risks. In the United States, perceived equity risks dropped in tandem with a perceived fall in US inflation risk, which moderated the expected pace of monetary tightening. In the case of the euro area, the drop in key energy prices from their extreme highs seen earlier in 2022 and the fading likelihood of a deep recession probably played a major role.
The views expressed are those of the authors, and do not necessarily reflect the views of the BIS. The computations are performed in terms of dividend yields, and then re–expressed in terms of stock returns. Initial uses of the underlying present value decomposition date back to J Campbell and R Shiller, "The dividend–price ratio and expectations of future dividends and discount factors", Review of Financial Studies, vol 1, 1988, pp 195–227. For a more didactic presentation, see the discussion preceding equation (7.1.24) in J Campbell, A Lo and A McKinlay, The econometrics of financial markets, 1997. Dividend data are obtained from the Chicago Mercantile Exchange and Eurex, zero coupon rates are published by the ECB and the Board of Governors of the Federal Reserve, and analysts' expectations are provided by I/B/E/S. The interpretation of these results requires the usual caution. A decomposition implicitly assumes that the model is "correct". The residual, which in other contexts has been likened to "sentiment", subsumes any modelling error.