Perceptions of risk and policy outlook drive markets

Financial markets extended previous gains during the review period.1 As inflation readings gradually fell and the pace of policy tightening slowed early in the period, financial conditions eased and risky asset valuations generally rose on the back of perceptions of declining risks. Expectations of significant rate cuts in the near term appeared to firm up, despite cautious central bank communication about the policy outlook. The US dollar depreciated further, lending additional support to assets in emerging market economies (EMEs). Towards the end of the period, however, market developments proved sensitive to news that challenged investors' sanguine attitude.
Investors' expectations about future policy rate paths stood in contrast to central bank communications. While several major central banks slowed the pace of monetary tightening, they remained cautious about the interest rate path going forward, particularly in view of the persistent strength of labour markets. Nevertheless, interest rate futures continued to relay market participants' expectation that rate hikes will end this year, followed by steep rate cuts stretching well into 2024.
Conditions in government bond markets remained sensitive to perceptions of growth, inflation and the attendant policy response. In Japan, tensions remained in fixed income markets, as investors reassessed the yield curve control (YCC) policy. Broad–based and recurrent open market operations by the central bank smoothed market functioning and contained upward pressure on bond yields.
Risky assets registered gains and the US dollar depreciated through most of the review period, before news tempered markets' optimism about the policy outlook. Stock markets experienced bouts of selling pressure but registered positive returns, despite a still subdued earnings outlook. The concurrent fall in forward–looking gauges of market volatility suggested that valuations were boosted by benign risk perceptions. In a similar vein, credit spreads narrowed further, on the heels of declines in perceived default risks, and corporate bond issuance showed signs of recovery in January. US data releases in February steered investors towards anticipating stronger policy headwinds. This led to a slight dollar appreciation and some reversal of risky asset gains, halting their divergence from subdued bank lending in major advanced economies (AEs).
Financial conditions eased moderately in EMEs, largely mirroring those in AEs. Bond yields fell, amid an upbeat backdrop of resilient growth and falling inflation. Equity markets saw wider fluctuations, swayed by the gyrations of the US dollar. The abrupt end to the zero–Covid policy in China reinvigorated its equity market and contributed to the strong performance of risky assets in economies with close links to China. Yet it failed to turn around the lethargic portfolio flows to the country, while such flows did stabilise or even rebounded for most other EMEs.
Key takeaways
- Perceptions of the future path of monetary policy shaped markets as central banks continued their fight against inflation.
- A benign assessment of the risk landscape supported risky asset valuations, notwithstanding subdued earnings forecasts.
- EME asset performance was generally strong but was also sensitive to AE financial conditions and to the ebb and flow of the US dollar.
Financial conditions eased as policy tightening slowed
Fixed income markets in major AEs remained focused on monetary policy paths during the review period. Signs of abating inflationary pressures kept a lid on bond yields, while expectations of rate cuts in late 2023 firmed up in derivatives markets. By contrast, central banks remained cautious in their guidance about the policy outlook, against the backdrop of persistently tight labour markets. This sober stance appeared vindicated in early February, when US data releases led to some non–trivial increases in government bond yields.
Financial conditions eased further early in the review period and then broadly stabilised. As of early December, a widely used indicator of global financial conditions had retraced half of the tightening observed during 2022. It hovered thereafter around levels close to its long–term average (Graph 1.A). All this took place on the back of decelerating inflation in the United States and other AEs, in part driven by muted fluctuations in commodity prices. In addition, perceptions of upside inflationary risks among market participants appeared to moderate (Graph 1.B).
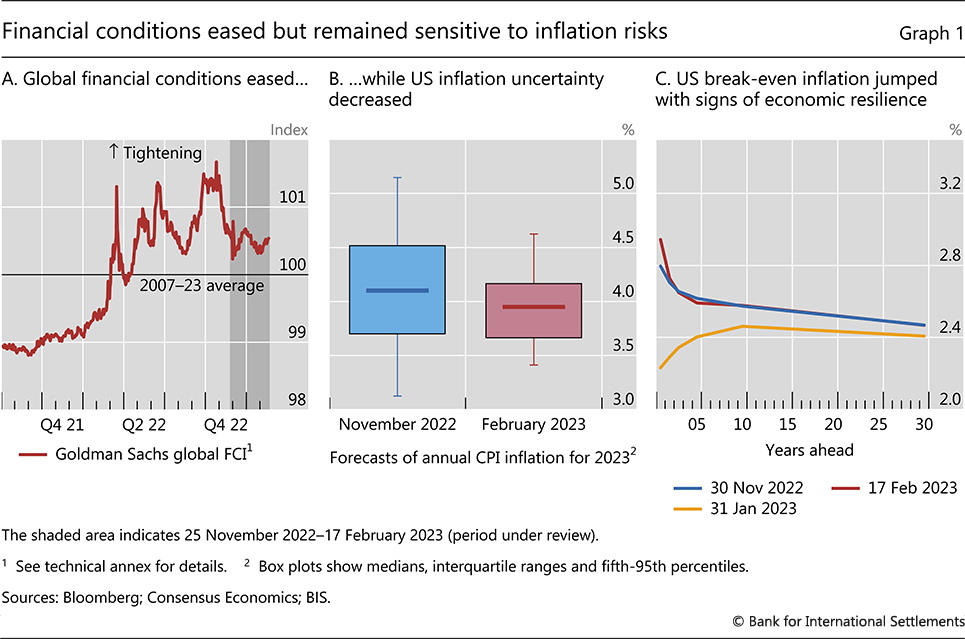
In early February, US data releases brought renewed evidence of strong labour market conditions amid solid growth,2 inducing market participants to reassess their inflation expectations. Near–term break–even inflation rates in the United States at mid–February were more than 60 basis points higher than at end–January (Graph 1.C). And the break–even term structure swiftly inverted, returning to the configuration prevalent early in the review period. In the euro area, inflation break–evens reacted less forcefully to the news, while a protracted disinflation process ploughed ahead. Against this backdrop, investors revised upwards their terminal policy rate projections for the United States, and to a lesser extent for the euro area, while pushing out the timing of expected rate cuts (Graph 2.A). Nevertheless, interest rate futures continued to signal a firm expectation that rate hikes would stop before the end of this year and that policy rates would decline materially in 2024.
In sharp contrast, central banks remained much more cautious in their communications throughout the review period. Admittedly, most central banks did slow the pace of tightening, including the Federal Reserve and the ECB. Moreover, some EME central banks, which had started tightening much earlier, paused. But in general, policymakers gave no indication that easing was on the horizon, reflecting concerns about still elevated inflation – with core inflation substantially above target – and upside risks that persisted on the back of generally tight labour markets.
Market participants' muted inflation fears kept a lid on AE bond yields for most of the review period, in contrast to the previous quarter, when turmoil in a major sovereign bond market spilled over to other segments (see Box A). Long–term yields in Germany briefly surpassed previous 2022 highs in late December (Graph 2.B), as the ECB reaffirmed its guidance of policy tightening. Following the US data surprises in February, nominal long–term yields began to rise again on the back of widening break–evens and moderate increases in "real" (that is, inflation–adjusted) yields within positive territory, with the exception of Japan, where they stayed negative.
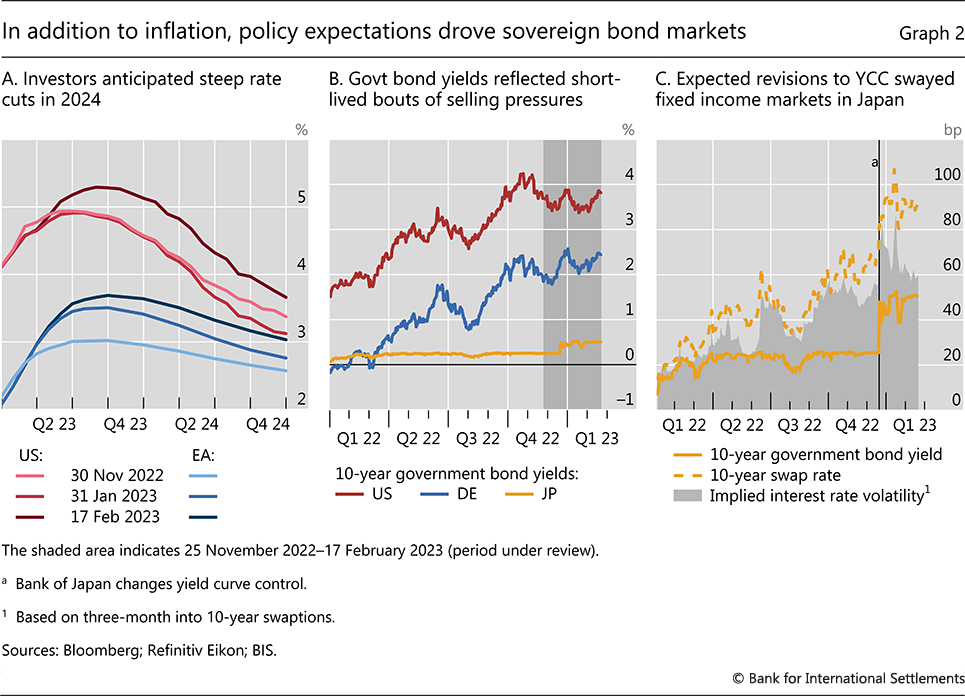
The market for Japanese government bonds (JGBs) experienced some tensions as investors continued to reassess the YCC policy. Long–term yields shifted upwards in December when the Bank of Japan unexpectedly widened the floating band of the 10–year yield (Graph 2.C). Further upward pressures on long–term yields were contained by recurring and broad–based open market operations of the central bank. At the same time, the spread of the 10–year swap rate over the cash yield persisted, as investors appeared to wager on further policy adjustments. And, even after receding from their peaks, forward–looking gauges of volatility stayed elevated, pointing at investors' uncertainty over the interest rate path.
Credit default swap (CDS) spreads indicated that market participants closely followed political negotiations around the debt limit in the United States. While remaining well below stress levels, CDS spreads for the US government briefly approached 35 basis points in January (Graph 3.A), as the US Treasury once again reached its borrowing limit and uncertainties over the debt ceiling negotiations increased. This contrasted with CDS spreads for Germany and Japan, which tightened during the review period.
Sovereign spreads in the euro area narrowed substantially in the new year, as the worst case macroeconomic scenarios feared in 2022 failed to materialise. A significant decline in projected fiscal deficits, in part resulting from less damaging prospects for energy prices, improved the metrics of euro area sovereigns' debt sustainability, thus lowering their funding costs. Most notably, spreads of Italian debt over bunds contracted by about 30 basis points over the last six weeks of the review period (Graph 3.B). Those of other sovereigns resumed the narrowing path briefly interrupted in December.
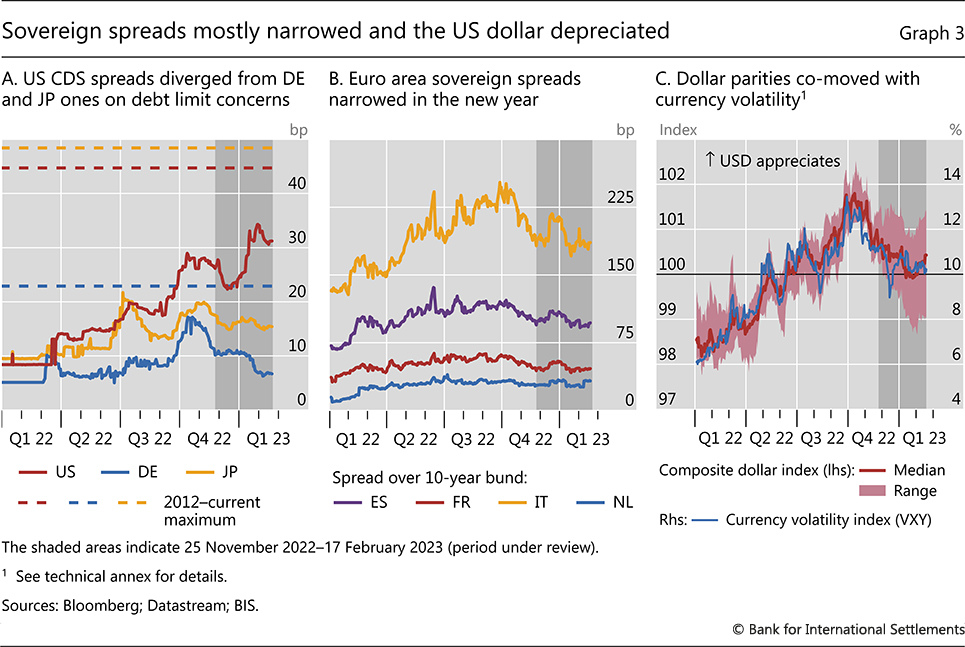
The dollar continued to depreciate through most of the review period as US interest rates lacked upward momentum. The dollar's depreciation over the turn of the year was broad–based (Graph 3.C, red line and area), before reversing somewhat in February. Overall, the dollar retraced almost half of its 2022 gains. Given that the broad dollar index co–moves with gauges of currency volatility (blue line), the depreciation supported risk–taking in currency and risky asset markets.
Risky assets buoyed by falling risk premia
Risky assets extended the rally that had begun in late 2022. Stock and credit market valuations were bolstered by a decline in perceived risks. In this context, corporate bond issuance rebounded strongly in January, after months of limited dynamism, whereas bank lending stayed restrained.
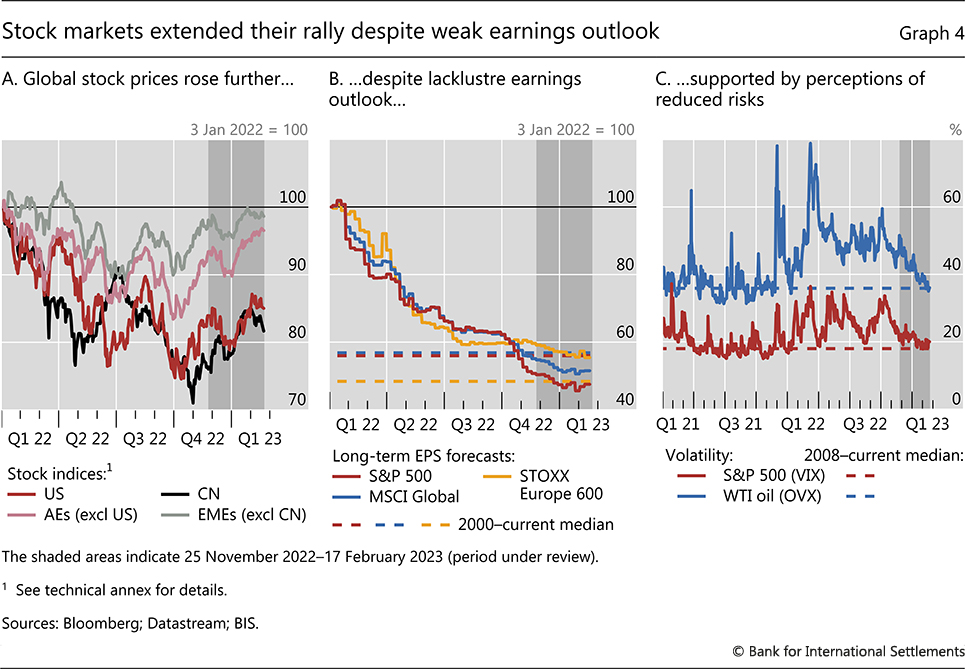
Equity markets continued recovering from their losses earlier in 2022, despite a downward correction in late February. Chinese stocks were boosted by the sudden end of the zero–Covid policy: the CSI 300 index increased by almost 10% between late November and mid–February (Graph 4.A). Other EME stock markets, which had experienced relatively smaller price declines last year, rose back to their pre–2022 levels. Among AEs, the S&P 500 continued to lag other major indices, and the continuously robust performance of European equities stood out. At the sectoral level, the returns of value stocks edged ahead of those of growth and technology stocks.
This strong performance through most of the period under review stood in contrast to firms' recent and expected profitability. Earnings announcements were generally underwhelming, and analysts' near–term forecasts remained downbeat. Moreover, after aggressively ramping up in 2021, longer–term expectations of earnings per share (EPS) declined to around half of their early 2022 levels (Graph 4.B). In particular, those underpinning US stocks stood well below their historical watermarks. Thus, the stock market rally appeared to be driven mostly by declining equity risk premia, ie the compensation that investors require for exposure to risk (see Box B). In line with this decline, equity and commodity option–implied volatilities retracted to their historical averages (Graph 4.C).
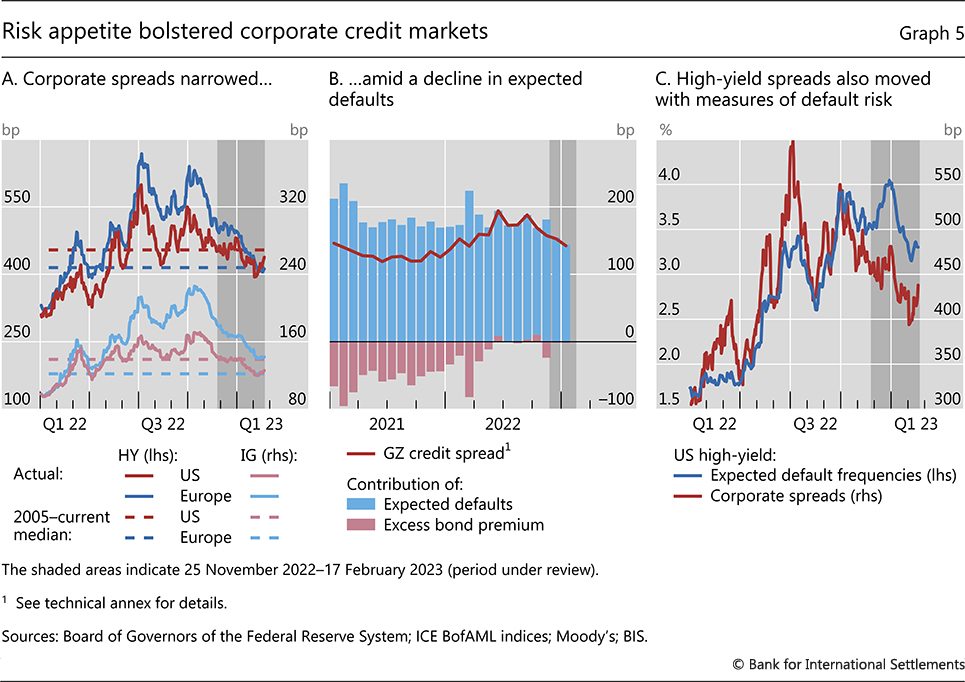
Valuations in corporate credit markets improved along with those of equity markets. Credit spreads narrowed materially during the review period. While the spreads still stayed somewhat above their long–term averages in the euro area, they fell back below such levels in the United States (Graph 5.A). The broad–based drop affected different rating categories. For example, the spreads on BBB credits, a growing segment within investment grade, fell by about 50 basis points, while the spreads on CCC credits, the lowest–quality rung in high–yield, fell by about 250 basis points.
Lower corporate credit spreads seemed to reflect mostly an improvement in investors' default risk perceptions. A decomposition of corporate spreads suggests that their narrowing during the review period owed almost entirely to this improvement (Graph 5.B, red line and blue bars). Similarly, spreads on high–yield corporate bonds declined in line with a fall in expected default frequencies (Graph 5.C). Given that high–yield bonds comprise a sizeable share of floating coupon corporate securities, these bonds might have further benefited from greater investor demand for such securities. Investors generally shift towards floating rate products when rates are rising.
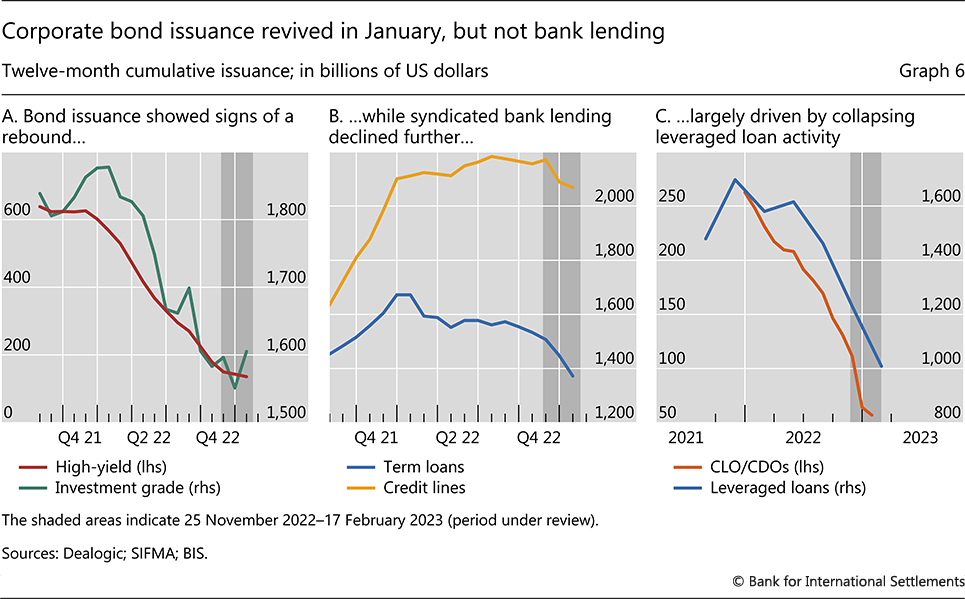
After a challenging 2022, conditions in primary markets for corporate credit came to be more in line with the easing conditions in secondary markets. Corporate bond issuance began to recover in January (Graph 6.A), led by the investment grade segment and issuance by financial firms. Reportedly, corporate bond financing also benefited from the deployment of investor cash that had remained on the sidelines for most of the second half of 2022.
In contrast to the budding recovery of corporate bond issuance, bank lending continued to be restrained. This is in line with the close attention that banks reportedly pay to downside risks in the economic outlook. Syndicated lending remained downbeat (Graph 6.B), particularly in the leveraged loan segment. The persistent pressure in this market segment was in part due to the collapse in the issuance of collateralised loan obligations (CLOs), which had provided an avenue for banks to offload a fraction of high–risk loans from their balance sheets (Graph 6.C). Leveraged real estate lending also faced headwinds, particularly in the euro area, as property values fell amid higher borrowing costs. Moreover, surveys suggested that bank retrenchment was more widespread,3 extending to consumer lending and mortgages. According to these surveys, the underlying drivers included a tightening of lending standards and a drop in loan demand.
EME financial conditions eased moderately
Financial conditions in EMEs moved in tandem with those in AEs, easing early in the review period and remaining broadly stable afterwards. That said, in February EME exchange rates and portfolio flows proved sensitive to some signs of shifting financial conditions in the United States.
EME financial conditions benefited from both global and regional factors, as well as from domestic growth momentum. For one, they were in line with the strong general performance of risky asset markets. In addition, they reflected resilient growth and falling inflation in most EME regions, which faced only occasional setbacks. EME financial conditions remained fairly accommodative also through a patch of negative macroeconomic news in late 2022 (Graph 7.A).
Developments in China stood out owing to a string of positive economic news and despite some persistent headwinds. A significantly better than expected release of Q4 real GDP in China constituted a sizeable positive surprise for EMEs as a group (Graph 7.A). And, as the country reopened after the Covid–19 lockdown, bank lending in January exceeded forecasts, growing at the fastest pace in 10 months. Leading indicators pointed to an upcoming economic expansion driven by services. The non–manufacturing PMI increased sharply, from contractionary to expansionary readings, in January (Graph 7.B). By contrast, manufacturing PMIs did not foretell an expansion, suggesting a limited contribution to commodity demand and limited upward pressure on commodity prices, at least in the near term.
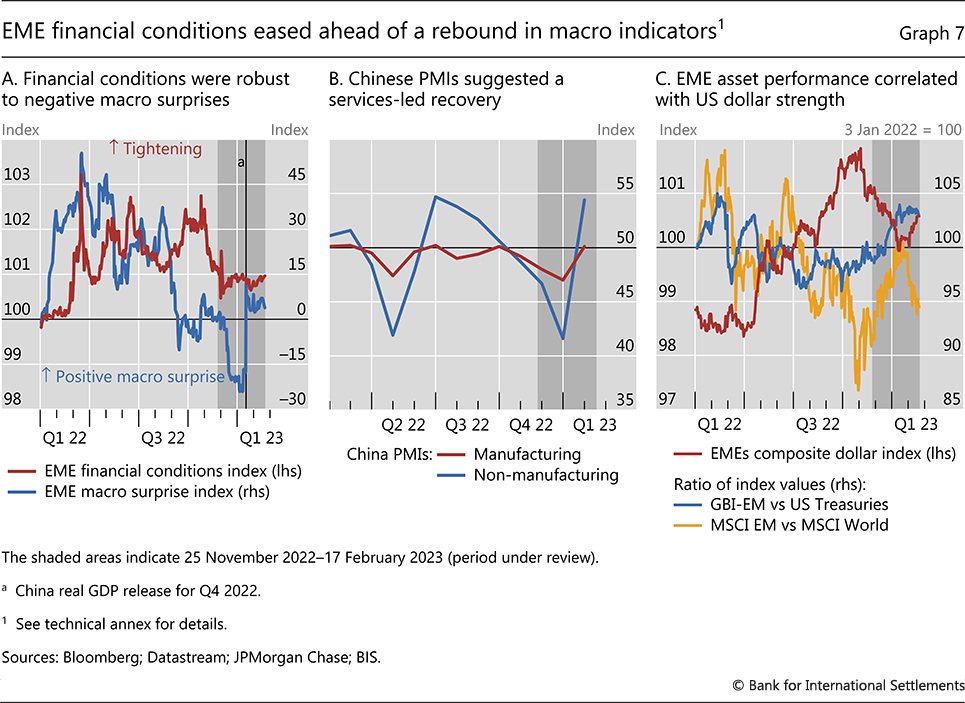
EME equities fluctuated with the ebb and flow of US dollar strength. As EME currencies recouped more than half of their 2022 losses against the dollar, their stock markets followed suit, and turned from under– to over–performance against global benchmarks (Graph 7.C). By contrast, the subsequent bout of US dollar appreciation in February went hand in hand with a soft patch for EME stocks, which again started trailing the global index.
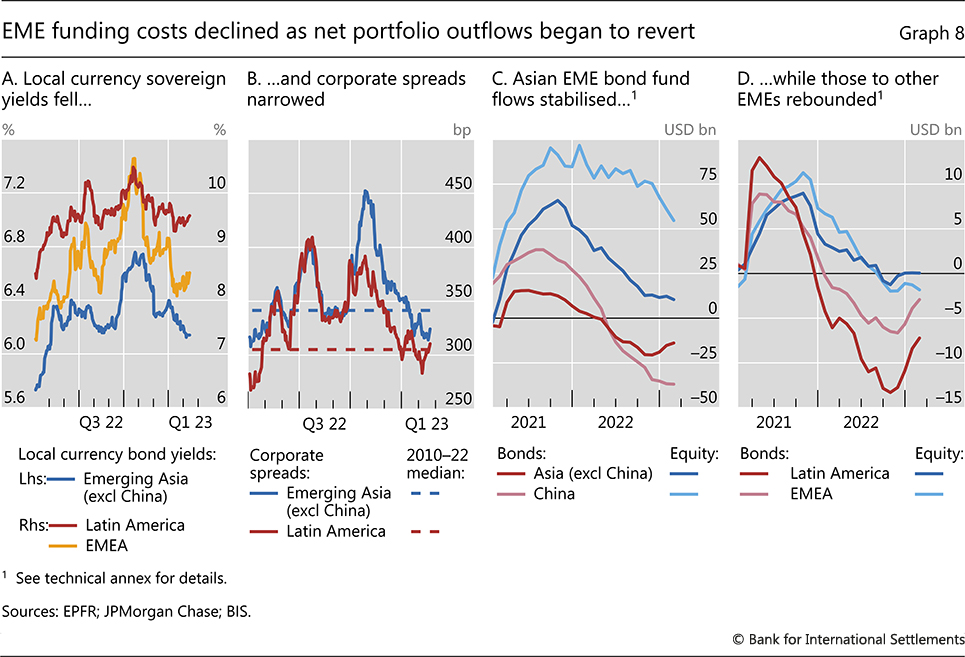
EME fixed income assets saw a more solid performance. As financial conditions improved and central banks halted or slowed the pace of rate hikes, local currency sovereign yields declined further (Graph 8.A). Improved funding costs allowed some EMEs, particularly those in Asia, to restart issuance in sovereign debt markets. Sovereign yields continued to be higher in Latin America than in other EME regions, partly reflecting a more restrictive policy stance amid higher inflation rates. The stretched fiscal positions of some Latin American sovereigns also contributed to the upward pressure on yields.
The cost of credit declined materially for EME corporates as well. Corporate spreads compressed further, to levels within the recent decade's averages (Graph 8.B). Spreads narrowed most rapidly in emerging Asia, amid a streak of positive growth news. Corporate funding conditions in the region also benefited from the stabilisation of credit markets in Korea, where authorities took effective measures to address the strains that emerged late in 2022.
The period under review witnessed a general stabilisation and some reversals of portfolio outflows from EMEs. This pattern was evidenced in equity fund flows, with continued outflows from China being the main exception (Graph 8.C). In terms of bond fund flows, EMEs generally experienced a rebound (Graph 8.D).
In a slight departure from these general developments, bond fund outflows resurfaced in February in country–level data. In addition to expectations that US financial conditions might tighten somewhat, local factors included uncertainties around a possible inflation target adjustment in Brazil and selling pressures in Korean fixed income assets after a recent decline in long–term yields. Other EMEs that experienced outflows in the first half of February included the Philippines, Thailand and Mexico. Foreign investor outflows from bond mutual funds in China also continued (Graph 8.C), as benchmark yields remained below those on US Treasuries and domestic monetary policy remained accommodative.
Technical annex
HY = high–yield; IG = investment grade.
Graph 1.A: Goldman Sachs Financial Conditions Index (FCI): a weighted average of country–specific risk–free interest rates, exchange rates, equity valuations and credit spreads, with weights that correspond to the estimated impact of each variable on GDP. A value of 100 indicates average conditions. A higher (lower) value indicates tighter (looser) conditions.
Graph 3.C: The composite dollar index corresponds to standardised USD exchange rates against AUD, CAD, CNY, CZK, EUR, GBP, HUF, INR, JPY, KRW, NOK, SEK and ZAR. The currency volatility index (VXY) corresponds to G10 currency option–implied volatility.
Graph 4.A: S&P 500 index for the United States; Shanghai Shenzhen CSI 300 Equity Index for China. AEs (excl US): weighted average of S&P/ASX 200, S&P/TSX Composite Index, Swiss Market Index, OMX Copenhagen Index, EURO STOXX 600 Index, FTSE 100 Index, Nikkei 225, OBX Stock Index, S&P/NZX 50 Index and OMX Stockholm Benchmark for AEs. EMEs (excl CN): weighted average of Brazil Ibovespa Index, S&P/CLZ IPSA, MSCI Colcap Index, Prague Stock Exchange Index, Hang Seng Index, Budapest Stock Exchange Index, S&P BSE Sensez Index, Jakarta Composite Index, Kospi Index, S&P/BMV IPC Index, FTSE Bursa Malaysia KLCI, S&P/BVL PeruGeneral TRPEN, PSEi Philippine SE Index, WSE WIG Index, Straits Times Index, Stock Exchange of Thailand Index and FTSE/JSE Africa ALL SHR Index for EMEs.
Graph 5.B: The GZ spread has two components: one capturing movements in default expectations, and another representing the procyclical changes in the relationship between measured default risk and credit spreads – the so–called excess bond premium. Published monthly by the Board of Governors of the Federal Reserve, the two components are taken from S Gilchrist and E Zakrajsek, "Credit spreads and business cycle fluctuations", American Economic Review, vol 102, no 4, 2012, pp1692–720.
Graph 7.A: See entry for Graph 1.A.
Graph 7.C: The EME composite dollar index corresponds to standardised USD exchange rates against CNY, CZK, HUF, INR, KRW and ZAR.
Graph 8.C–D: Aggregation of weekly data across major economies in each region. Cumulative flows for the past 12 months. Data cover net portfolio flows (adjusted for exchange rate changes) to dedicated funds for individual EMEs and to EME funds with country/regional decomposition.
1 The review period covers 25 November 2022 to 17 February 2023.
2 These included strong positive non–farm payroll and retail sales surprises, as well as mild upward revisions to past CPI data.
3 The ECB released euro area bank lending survey results for the fourth quarter of 2022 on 31 January, while the Federal Reserve released the latest Senior Loan Officer Opinion Survey results, which also generally correspond to the fourth quarter of 2022, the following week.