Global growth: drivers and post-pandemic prospects

As the global economy emerges from the disruptions of the Covid-19 pandemic, attention is turning to growth prospects. We project growth over the next two decades by modelling supply-side drivers at the country and industry levels for 33 advanced economies (AEs) and emerging market economies (EMEs). Our analysis suggests that, on pre-pandemic labour productivity growth trends, the global economy would grow by roughly 2.7% per year, driven by EMEs. This outcome is subject to a degree of uncertainty. We quantify the growth impact of three scenarios: persistent pandemic-induced structural changes, a housing market-induced recession and a green energy transition. Our analysis underscores the importance of structural reforms and policies to reinvigorate the supply-side drivers of growth. 1
JEL classification: C54, E27, O47.
The Covid-19 pandemic has had an extraordinary economic impact. The first half of 2020 saw the largest decline in economic activity in almost a century, while the fastest recovery in several decades took place over the subsequent 18 months. The virus remains a significant risk to public health, and many countries face considerable challenges, particularly emerging market economies (EMEs) and developing countries. Nevertheless, a path out of the pandemic is gradually emerging. This naturally raises the question of how global growth will evolve after the enormous disruptions wrought by the pandemic.
In this special feature, we propose a framework for analysing GDP growth and projecting it into the future. We split GDP growth into the sum of aggregate employment growth and labour productivity growth. Taking a medium-run focus, we link employment growth to working age population growth and decompose labour productivity growth into two trend components: country-specific and industry-specific ones.
We then put the framework to work. We first show that the components can explain most of the variation in aggregate labour productivity growth in both advanced economies (AEs) and EMEs over recent decades.
Key takeaways
- Absent policy intervention to reverse pre-pandemic trends in labour productivity growth, global GDP annual growth could slow to 2.7% in the years ahead.
- Pandemic-induced shifts in working arrangements and an orderly climate transition could provide a modest boost – of about 1% each – to GDP levels, but may require significant resource reallocation.
- A housing bust or a disorderly climate transition represent large downside risks to GDP levels – of up to 10% in some countries – with EMEs being most vulnerable.
We then turn to the future and examine possible scenarios for the years 2024–40. Our benchmark is a growth projection in which pre-pandemic trends reassert themselves. Importantly, this is not a forecast or an assessment of the most likely future path of economic activity. Rather, it anchors the analysis in well understood past patterns.
Around that benchmark, we consider additional scenarios that could disrupt pre-pandemic trends. In one such scenario, pandemic-induced shifts in labour productivity persist beyond the health emergency period. Another features a recession triggered by a sharp reversal in house prices, particularly in the context of stretched asset valuations and looming interest rate increases. In the final one, the transition to a low-carbon economy poses novel opportunities, as well as challenges. For each scenario, we consider two alternative cases that further highlight the range of possible outcomes.
We report four main findings. First, if pre-pandemic productivity growth trends reassert themselves, global growth could average roughly 2.7% per year over the next two decades – around 1 percentage point lower than the average in the 2010s. Second, there are considerable differences across countries in terms of pandemic-induced employment and labour-productivity shifts. Those that can take advantage of remote work technologies could see their GDP levels rise permanently by 1% above the benchmark path. In countries that cannot do so, output could be as much as 10% below the benchmark. Third, a repeat of recent housing busts – which caused a protracted decline in labour productivity growth and a shift in employment patterns – could permanently lower GDP levels by 5–10% on average across countries, and by almost 15% in China. Fourth, the climate transition presents both opportunities and risks. An orderly transition, whereby green technology receives timely financing and is productivity-enhancing, would have only modest short-run costs, and it would ultimately raise GDP levels by 1% by 2040. But if the transition is disorderly – with green investment lagging behind financial market expectations – GDP could undershoot the benchmark projections by 3% by 2040.
The rest of the paper is structured as follows. We first lay out the analytical framework and use it to review global growth in the lead-up to the Covid recession. We then outline a set of benchmark growth projections that assume a continuation of the pre-Covid trends. Next, we examine the output implications of three scenarios. The final section reviews the key lessons from the analysis.
A framework for identifying growth drivers
Throughout the paper, we examine growth drivers, in the past as well as in the future, using a common framework. We first decompose country-level GDP growth into the contributions that come from aggregate labour productivity – including both capital deepening and total factor productivity (TFP) – and employment:2

We further decompose aggregate labour productivity growth into four parts (equation (2)). The first is a country-specific factor, assumed to be common to all industries in a given country. The second is a set of industry-specific factors, assumed to be common across countries for a given industry. We assume that the country- and industry-specific factors are uncorrelated. The third is the share of each industry in a country's overall employment, which determines the influence of industry-specific factors on aggregate labour productivity growth. The fourth is a residual. As this component explains a small share of productivity growth, we do not discuss it in our analysis.
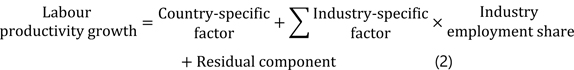
Intuitively, the country-specific factor captures the evolution of economy-wide growth drivers such as the quality of institutions and human capital. The industry-specific factors reflect global technological advancements within individual industries, which are assumed to be accessible to and exploited by all countries.
We recover the components of GDP growth using a combination of data and model-based inference. We observe aggregate employment growth and industry employment shares directly. To uncover country- and industry-specific factors, we also use data on labour productivity by industry and an econometric model (see box).3
Pre-pandemic growth drivers
The global economy grew at a robust pace in the decade before the pandemic. Between 2010 and 2019, growth averaged 3.7%, slightly above the previous two decades (Graph 1, left-hand panel).
EMEs were the engine of global growth. On average, they expanded by 5.3% in the 2010s – by 4.1%, excluding China – and accounted for around three quarters of annual world GDP growth. Although EMEs' growth slowed slightly from the very rapid pace of the 2000s, their contribution to world GDP growth increased because EMEs accounted for a larger share of the global economy. Labour productivity improvements explain the bulk of EME growth since the turn of the century, with employment gains playing a small and diminishing role (Graph 1, centre panel).
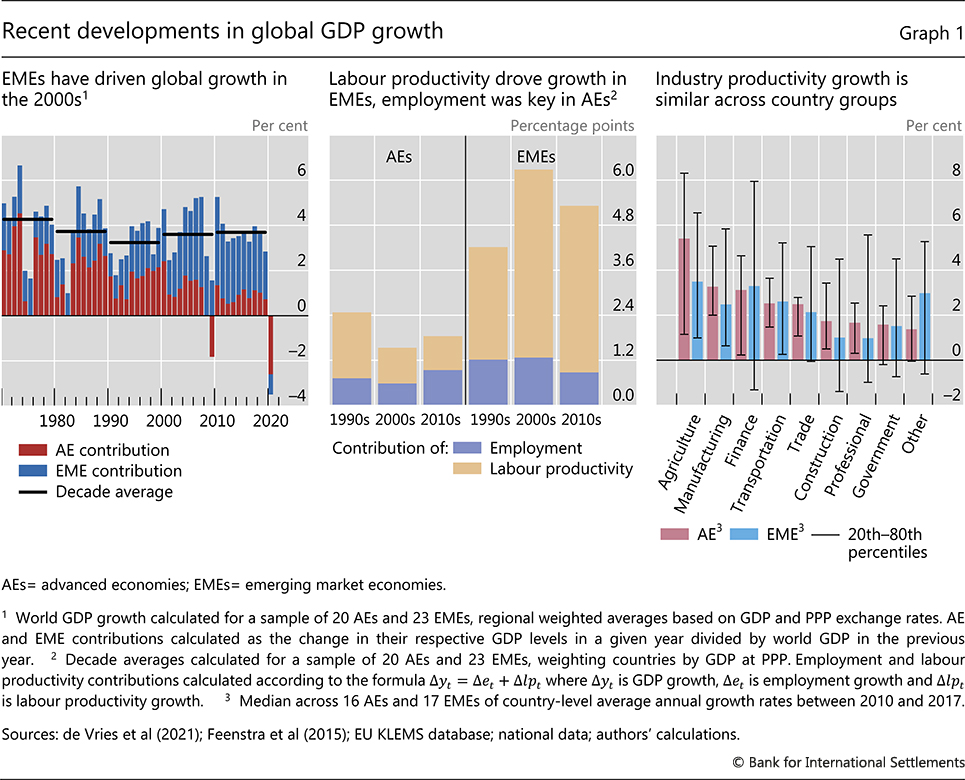
For AEs, the 2010s marked another decade of subdued growth. While GDP expanded slightly faster than in the 2000s, this was entirely due to faster employment growth, as workers who lost their jobs during the Great Financial Crisis (GFC) were gradually reabsorbed into the workforce. In fact, AEs' labour productivity growth was even lower than in the 2000s and only a fifth of that in EMEs. Looking further back, AEs' labour productivity in the 2010s expanded at just half of its pace in the 1990s.
Differences in labour productivity growth between AEs and EMEs were less apparent at the industry level. Simple median productivity growth rates by industry were similar between AEs and EMEs over the 2010s (Graph 1, right-hand panel, bars). In both country groups, productivity grew relatively fast in agriculture, manufacturing and finance, and more slowly in construction and many service industries.4 Having a larger share of their workforces employed in fast productivity growth industries was one reason why EMEs saw faster aggregate labour productivity growth than AEs.
Next, we study the determinants of changes in labour productivity growth over time according to equation (2) above. To do this, we first recover the aggregate labour productivity growth trend for each country as the sum of the estimated country- and industry-specific components (weighting each industry by its employment share). We then attribute a part of the evolution of these trends to one of the three drivers: (i) the country-specific component; (ii) the industry-specific components; and (iii) the industry employment shares. The attribution to one specific driver is achieved by fixing the other two drivers at their levels in 1996, the year in which our sample begins. We perform the attribution for country groups, and for China alone. We describe labour productivity developments until 2019, the eve of the Covid-19 pandemic.
Country-specific factors accounted for the bulk of the labour productivity growth slowdown in AEs since the mid-1990s (Graph 2, top-left panel, red and blue lines).5 On their own, these factors accounted for 70% of this slowdown (yellow bars). Industry factors oscillated from year to year, but accounted for little of the steady downwards drift (purple bars). Changes in employment composition exerted a small drag on labour productivity growth because employment grew faster in industries with lower productivity growth (green bars).
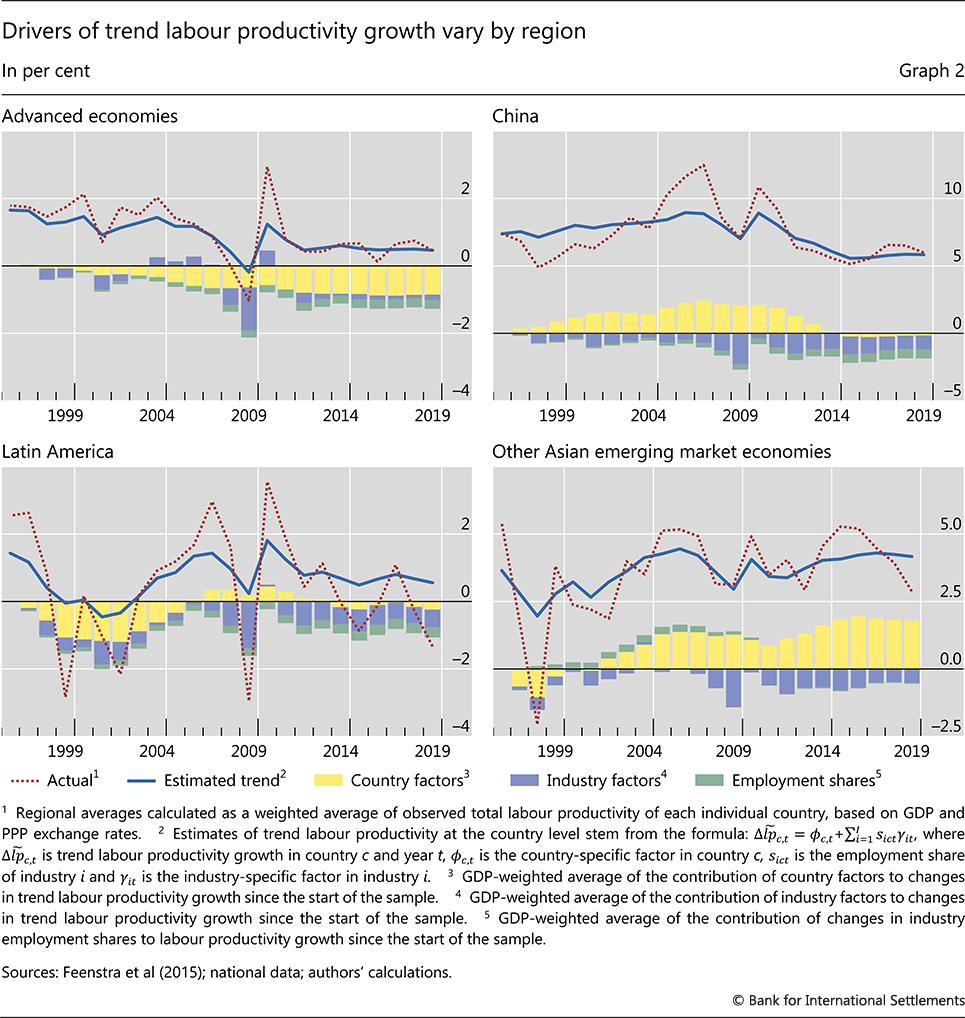
Country-specific factors were also important in EMEs (Graph 2, top-right, bottom-left and bottom-right panels). In China, they accounted for all of the rise in trend labour productivity growth from the mid-1990s to 2010, and for about three quarters of the subsequent decline. Similarly, in Latin America they explained most of the movements in overall productivity growth in the 1990s and 2000s, with a smaller impact in the 2010s. In other Asian EMEs, country-specific factors have drifted up and account for most of the rise in trend productivity growth in the 2010s.
Turning to industry-specific factors, we find that they were more important in EMEs than in AEs. These factors generally weighed on EMEs' productivity growth. Had they stayed at their initial level, overall productivity growth in other Asian EMEs and Latin America would have been around 0.5–0.6 percentage points higher on an annual basis. In China, the fall in labour productivity growth due to industry-specific factors was even larger, at 1 percentage point.
- D Rees (2020): What Comes Next?, BIS Working Papers, no 898, November.
-
P Rungcharoenkitkul (2021): Macroeconomic effects of Covid-19: a mid-term review, BIS Working Papers, no 959, August.
-
C Borio, E Kharroubi, C Upper and F Zampolli (2016): Labour reallocation and productivity dynamics: financial causes, real consequences, BIS Working Papers, no 534, January.
Differences in employment composition explain why industry-specific factors were a bigger drag on productivity growth in EMEs than in AEs. Particularly important in this respect is EMEs' large share of agricultural employment, which is much higher than AEs'. For a typical EME with an agricultural employment share of 25%, the 1.7 percentage point decline in the agriculture-specific growth factor over the sample lowered aggregate productivity growth by 0.5 percentage points on an annual basis. This compares with less than 0.1 percentage points in most AEs, where agricultural employment shares are closer to 2% of the workforce. For similar reasons, EMEs' larger employment share in manufacturing and smaller share in professional services also help explain the difference in the evolution of trend productivity growth between the two groups of countries.
A benchmark global growth projection
We now use our framework to lay out a benchmark projection for global growth over 2024–40, assuming that pre-pandemic labour productivity growth trends reassert themselves.6 This projection should not be taken as a forecast or an assessment of the most likely future path of economic activity. Indeed, we simply use it as a reference point when we explore alternative scenarios.
For any projection, we need to make assumptions about the evolution of employment growth, country-specific factors, industry-specific factors and industry employment shares. For the benchmark, we base employment growth on country-level working age population growth forecasts (United Nations (2019)). We translate these into employment growth by assuming that labour force participation rates remain at their 2019 levels over the projection period. This assumption reflects a judgment about two opposing forces. On the one hand, population ageing is expected to depress labour force participation over the medium run.7 On the other hand, participation rates increased by more than anticipated in many countries during the 2010s and the forces driving these increases could still be at work, including shifts in social norms and policies that encourage later retirement.8
For AEs, we assume that country- and industry-specific factors of labour productivity growth remain at their latest estimated trend values as of 2019 throughout the benchmark projection.9 Likewise, we hold the employment shares in each country fixed at their last pre-pandemic values.
For EMEs, we impose the same assumption but make one departure to reflect the well documented stylised fact that labour productivity growth in EMEs slows to that of AEs as their respective per capita incomes converge. Based on past relationships, we lower the country-specific productivity growth factor in individual EMEs by 0.25 percentage points for every 10% reduction in their per capita income gap with the United States.10
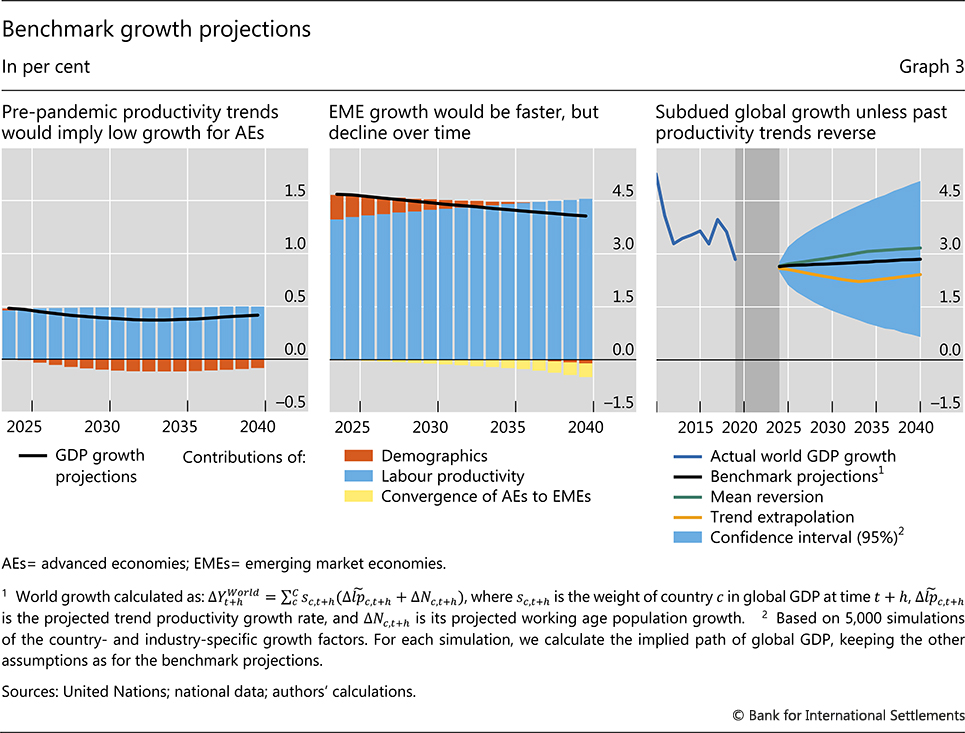
In the benchmark, AEs face sobering growth prospects once the post-pandemic growth rebound has played out by 2024. Projected annual GDP growth for AEs as a whole is below 0.5% in coming decades, compared with 1.9% in the 2010s (Graph 3, left-hand panel). This is largely the result of our low labour productivity growth assumption (blue bars). Added to this is a projected slowdown in employment growth due to population ageing or outright declines in many countries (orange bars).
The benchmark growth projection for EMEs is higher, although annual growth also declines from around 4.7% in 2024 to 4% by 2040 (Graph 3, centre panel). This is below EMEs' 5.3% growth rate in the 2010s. Two factors contribute to this slowdown. The first is a substantial decline in the contribution of employment growth – from 0.7 percentage points in 2024 to –0.1 percentage points in 2040 (orange bars). The second is the decline in productivity growth as per capita income in fast-growing EMEs converges with that of AEs (yellow bars). These are only partly offset by faster-growing countries taking up a larger share of world GDP.
Taken together, these projections point to average global GDP growth of 2.7% over the coming decades (Graph 3, right-hand panel, black line). This is in line with global growth in 2019 but well below the 3.7% average growth rate in the 2010s.
The benchmark projection is just one illustrative path for global growth, ie one in which low pre-pandemic labour productivity growth would persist. Alternatively, if the country-specific labour productivity factors gradually increased from their 2019 levels to their historical means, the projected annual AE GDP growth would almost double from the benchmark level to around 0.8%. Meanwhile, EME GDP growth would also increase by 0.3 percentage points, driven mainly by China. Overall, reflecting the growing share of EMEs, annual global GDP growth would rise to 3.2% by 2040 (Graph 3, right-hand panel, green line). Conversely, if pre-pandemic declines in the country-specific factors seen in the period 2014–19 continue after the pandemic, labour productivity growth would fall further in most AEs and in some larger EMEs, including China. In this case, annual global GDP growth would be about 0.4 percentage points lower than the benchmark, at 2.4% by 2040 (right-hand panel, yellow line).
Alternative growth scenarios
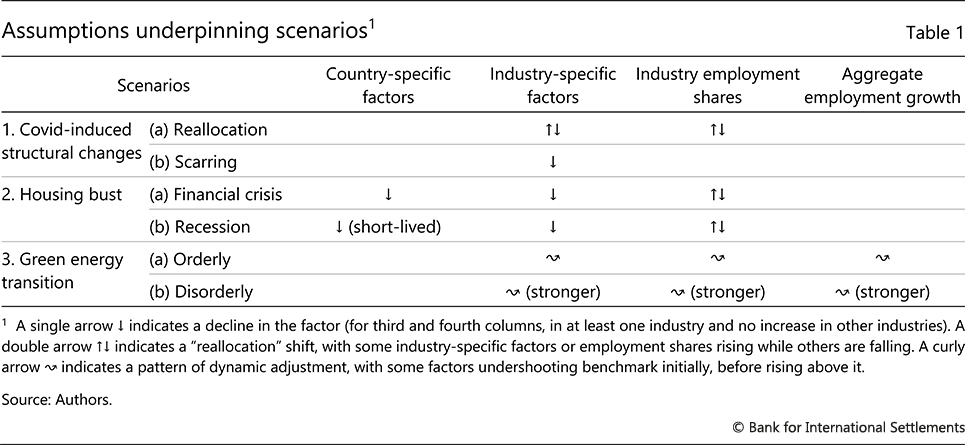
In this section, we examine three scenarios of plausible economic developments that could occur in the coming years and assess their GDP impact. The first scenario involves persistent pandemic-induced structural shifts and scarring effects. The second is one in which the lengthy housing market booms experienced by many countries turn into busts. The third explores the transition to a low-carbon economy. Constructing the scenarios requires new assumptions about the key inputs into our framework, which we summarise qualitatively below (Table 1).
Covid-19-induced structural changes
The pandemic's economic impact could persist long after the health emergency passes. In some countries, the pandemic may steer labour persistently away from high-contact service industries (eg accommodation) towards others that adapt well to remote working and are less exposed to structural demand shifts (eg professional services such as scientific research or consulting). This may increase aggregate productivity. But for economies less able to leverage remote-work technologies, the economic scars from the pandemic could be more disruptive and pervasive.
We consider two cases to illustrate these possibilities.11 In the first, the pandemic continues to induce partially offsetting cross-industry shifts in labour productivity growth and labour reallocation, as was the case in the United States and other AEs during the first 21 months of the pandemic. Calibrating the scenario to this experience, we assume an initial boost to annual labour productivity growth – in information and communication (by 4.6 percentage points), manufacturing (2.8 percentage points), professional services (1.8 percentage points) and finance (1.6 percentage points) – which fades over five years (Graph 4, left-hand panel).12 By contrast, we assume that transportation and accommodation see lower initial labour productivity growth (of –5 and –0.3 percentage points, respectively), with the decline waning over the same period. In parallel with these productivity shocks, we also assume a temporary 1 percentage point reduction in the employment share of the accommodation sector (a "Great Reallocation" shock), which we redistribute equally among the finance, professional services, trade, public and health industries.
This scenario raises output in most economies, particularly those with large employment shares in industries where labour productivity rose during the pandemic (Graph 4, right-hand panel, blue bars). In quantitative terms, however, the output gains are relatively modest, as productivity slowdowns in some industries offset gains in others. Overall, world GDP would be 1% higher than the benchmark by 2040.
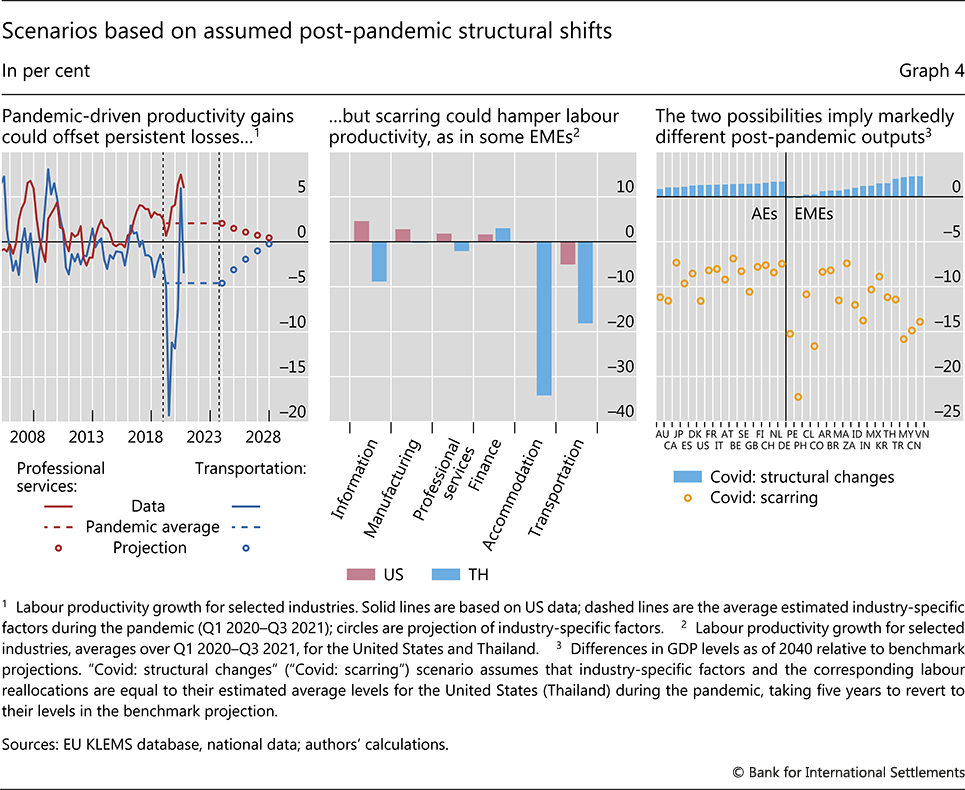
The second case assumes widespread adverse labour productivity shocks as a result of the pandemic, replicating the experience of some EMEs. Based on Thai data, we lower labour productivity growth in the same industries considered above, except for finance (Graph 4, centre panel), and hold labour shares constant at their 2019 levels. As before, we assume that the shocks dissipate over five years. This broad-based labour productivity growth slowdown, representing the persistent "scarring" effects of the pandemic, would lead to substantial GDP losses. By 2040, GDP for the average country would be 10% below the benchmark (Graph 4, right-hand panel). Lost human capital from education interruptions, not accounted for in the scenario, could amplify the output costs, particularly in EMEs.
Housing boom gone bust
The second scenario is a disruptive end to the global housing boom. This risk has gained relevance due to the extended house price appreciation seen in many jurisdictions during the pandemic, coinciding with the prospect of higher interest rates (see Igan et al (2022)). Many past housing busts were followed by subdued economic growth, amplified by financial deleveraging and debt overhang.
We draw on two housing boom-bust episodes to build the scenario: the GFC in the United States and the 2011 crisis in Spain. In the decade after the GFC, the estimated country-specific labour productivity growth factor for the United States fell by 1 percentage point (Graph 5, left-hand panel).13 Similarly, the country-specific factor for Spain declined by more than 1 percentage point after its 2011 crisis, bottoming out only six years later. The accompanying collapse in bank lending, depicted in the panel by movements in credit gaps, highlights the role of balance sheet overhang in creating these persistent economy-wide effects. Sluggish growth recoveries went hand in hand with construction industry adjustments, including a protracted fall in the industry's employment share of 30–50% (Graph 5, centre panel), and a decline in annual labour productivity growth of around 0.6 percentage points.
We consider two calibrations with varying degrees of financial amplification. The first "crisis" case mimics the severity of recent housing crises and assumes that country-specific factors decline by 1 percentage point starting in 2024, taking five years to bottom out and seven more years to return to benchmark. It also assumes shocks to the construction industry in line with historical experience: a 0.6 percentage point fall in labour productivity growth and a 30% fall in the industry's employment share. Relative to the benchmark, this case lowers GDP in AEs by 5% on average by 2040 (Graph 5, right-hand panel, blue bars). The impact in EMEs is more varied, reflecting differences in the size of construction industries and the greater loss of output in faster-growing economies as a result of the same shocks. The impact ranges from 5% in large Latin American countries such as Brazil and Argentina to almost 15% in major Asian economies such as China and India.
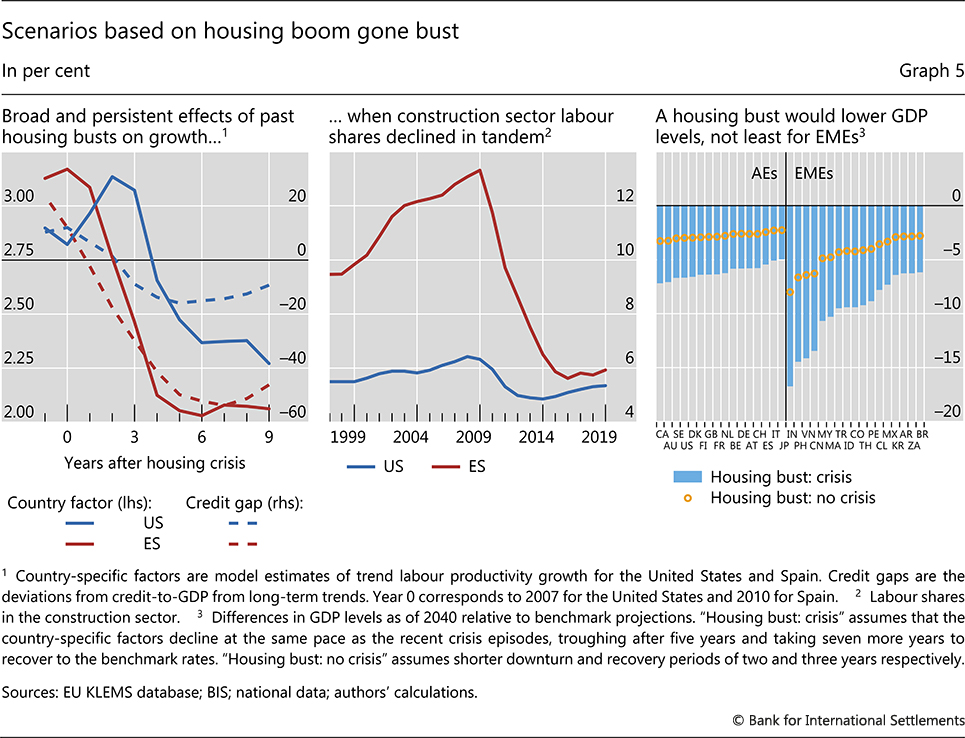
This experience guides our second "no-crisis" case, in which more resilient banking systems post-GFC help avert a financial crisis and mitigate banks' balance sheet overhang even as the housing industry undergoes a tumultuous adjustment.14 We assume shocks of the same sizes as the crisis scenario, but a shorter contraction and faster recovery for the country-specific factors, taking two and three years respectively. The adverse effect on GDP is now smaller (Graph 6, right-hand panel, yellow circles), more in line with regular recessions.
A green energy transition
The final scenario involves the transition to a greener economy. This transition could involve a number of developments including (i) significant investment to replace "dirty" energy sources with greener alternatives; (ii) changes in industry-level productivity growth, depending on whether green technology is more or less productive than the alternative; and (iii) changes in risk premia as investors look to reduce their exposure to carbon-intensive firms and industries.15 To account for these rich economic forces, we follow a two-stage approach. First, we use a multi-industry structural model (based on Rees (2020)) to translate the underlying economic forces behind the scenarios into a sequence of industry-specific factors and employment shares, and changes in aggregate employment. Next, we use these estimates in our framework to determine the GDP implications.
To illustrate the inherent uncertainty of the transition, we explore two cases.16 In an orderly transition, the need for green energy investment is met in a timely manner and this raises productivity in the energy industry as well as in industries that use energy as an input. In a disorderly transition, by contrast, clean-energy technology lags behind investors' aspirations and governments' objectives, which ends up depressing productivity in a persistent manner, particularly in the energy industry.
The orderly transition involves modest short-run costs and persistent long-run gains. Labour productivity growth in carbon-intensive industries, particularly energy, initially declines as "brown" technologies are abandoned and the benefits of new investment are slow to materialise (Graph 6, left-hand panel). Overall, this lowers GDP by around 1–2%, relative to the benchmark projections (centre panel). By 2030 however, the transition toward green energy is largely complete, and labour productivity growth increases in all industries – led by the green energy industry. By 2040, GDP is 1% higher on average (Graph 6, right-hand panel).
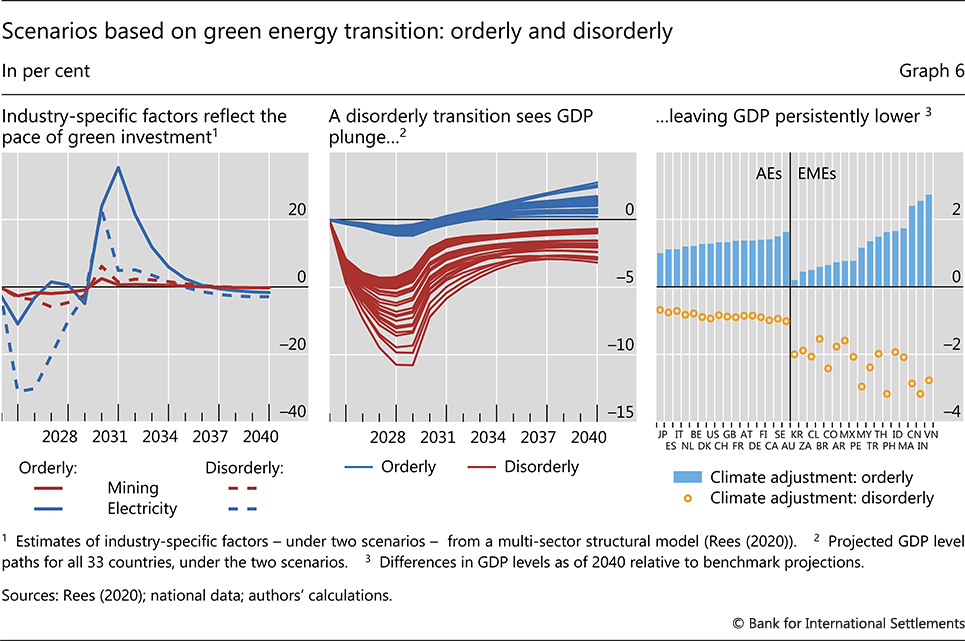
The disorderly transition entails significant costs. A rapid shutdown of carbon-intensive energy sources, without readily available green replacements, causes a short-run contraction of almost 30% in the energy industry's labour productivity. This prompts a sharp reduction in output of between 5–10% in the first five years, relative to the benchmark. As the initial slump in energy investment is assumed to hinder technological progress in that industry, some of the decline in output is permanent – by 2040, output is still 1% below the benchmark projections in AEs, and 2–3% lower in EMEs.
Policy implications
Our analysis has several policy implications. First, it highlights the urgent need to accelerate structural reforms to provide a boost to aggregate supply. Without such measures, the dual headwinds of sluggish labour productivity growth and population ageing could weigh on GDP growth in both AEs and EMEs over the medium term. Slower growth, in turn, would have wide-ranging macroeconomic implications – not least for debt sustainability, macroeconomic stabilisation policy, inflation and therefore for monetary policy, which would have to deal with a more challenging environment.
Second, our analysis suggests that countries have scope to enhance productivity growth regardless of their industrial structure. Indeed, country-wide factors have historically mattered more for aggregate productivity growth than industry-specific ones. This suggests that economy-wide measures, such as improvements in institutional quality and human capital, can persistently boost labour productivity growth, even in economies geared towards seemingly less productive industries.
Third, measures to promote labour market flexibility and resource reallocation are also likely to be beneficial. More agile economies would be more resilient in the face of large economic disruptions, such as those associated with the Covid-19 pandemic discussed in our scenario analysis, and in some cases may even benefit from the attendant shifts in consumer preferences.
Finally, the scenario analysis also underscores the importance of guarding against downside risks. Improving financial resilience against a house price correction and forestalling housing market overheating requires coordinated monetary, fiscal and macroprudential policy action. Promoting an orderly green transition, and the major resource reallocation it implies, requires a broad policy strategy, including international coordination. Lack of progress on these fronts could come at a high cost.
References
Bolton, P and M Kacperczyk (2021): "Do investors care about carbon risk?" Journal of Financial Economics, vol 142, no 2, pp 517–49.
Borio, C, E Kharroubi, C Upper and F Zampolli (2016): "Labour reallocation and productivity dynamics: financial causes, real consequences", BIS Working Papers, no 534.
de Vries, G, L Arfelt, D Drees, M Godemann, C Hamilton, B Jessen-Thiesen, A Kaya, H Kruse, E Mensah and P Woltjer (2021): "The Economic Transformation Database (ETD): content, sources and methods", WIDER Technical Note, 2/2021.
Feenstra, R, R Inklaar and M Timmer (2015): "The next generation of the Penn World Table", American Economic Review, vol 105, no 10, pp 3150–82.
Hornstein, A, M Kudlyak and A Schweinert (2018): "The labor force participation rate trend and its projections", FRBSF Economic Letter, 2018–25.
Igan, D, E Kohlscheen and P Rungcharoenkitkul (2022): "House prices during and after the pandemic: drivers and risks", mimeo.
Lowe, P (2021): "The labour market and monetary policy", speech to the Economic Society of Australia (QLD), 8 July.
Powell, J (2021): "Getting back to a strong labour market", speech at the Economic Club of New York, 10 February.
Rees, D (2020): "What comes next?", BIS Working Papers, no 898.
Scatigna, M, D Xia, A Zabai and O Zulaica (2021): "Achievements and challenges in ESG markets", BIS Quarterly Review, December, pp 83–97.
United Nations, Department of Economic and Social Affairs, Population Division (2019): World Population Prospects 2019, online edition, rev 1.
1 The authors thank Frederic Boissay, Claudio Borio, Stijn Claessens, Deniz Igan, Richhild Moessner, Benoît Mojon, Hyun Song Shin, Nikola Tarashev and Christian Upper for helpful comments and discussions, and Burcu Erik for excellent research assistance. The views expressed in this article are those of the authors and do not necessarily reflect those of the Bank for International Settlements.
2 We focus on labour productivity, rather than capital deepening and TFP in isolation because industry-level capital stock and TFP data are not available for many countries in our sample, particularly EMEs.
3 We estimate the country- and industry-level factors using industry-level labour productivity growth data for 16 AEs (Australia, Austria, Belgium, Canada, Denmark, Finland, France, Germany, Italy, Japan, the Netherlands, Spain, Sweden, Switzerland, the United Kingdom and the United States) and 17 EMEs (Argentina, Brazil, Chile, China, Colombia, India, Indonesia, Korea, Morocco, Mexico, Malaysia, Peru, the Philippines, Thailand, Turkey, Vietnam and South Africa).
4 Given the known difficulties in measuring finance industry output, labour productivity growth rates in that industry should be viewed with a degree of caution.
5 The blue "trend" lines are a smooth version of the red "actual" path of labour productivity growth, confirming that the residual component accounts for little of the medium-run variation in labour productivity growth.
6 There are two reasons for our choice of a projection period. First, we seek to exclude the unprecedented developments in labour productivity since the onset of Covid, which we assume will subside by 2024. Second, we judge two decades to be the longest period over which we can have confidence in our demographic assumptions.
7 This reflects changes in the working age population, with the share of the working age population aged over 55 (who typically have lower participation rates) increasing. See Hornstein et al (2018).
8 See Lowe (2021) and Powell (2021).
9 The estimated trend component differs from actual labour productivity growth in 2019, which includes a residual term that we assume equals zero throughout the projection period.
10 Referring to average AE per capita income would leave our results almost unchanged.
11 Both cases assume that the health consequences of the pandemic have largely played out by 2024.
12 Shifts in labour productivity and employment could be influenced by temporary lockdowns and policy measures, including furlough schemes. Averaging over the pandemic period focuses on the more persistent elements.
13 Construction cycles also affect labour productivity through cross-sectoral labour reallocation (Borio et al (2016)).
14 We also assume no overhang effects from high household debt and construction oversupply, which could amplify the housing busts even if the banking system is not at risk.
15 This could be for reputational reasons (Bolton and Kacperczyk (2021), Scatigna et al (2021)).
16 We consider only the "transition risks" associated with tackling climate change. Accounting for "physical risks" would require us to model carbon emissions and their climate implications, which is beyond the scope of this article. To the extent that both cases lead to lower carbon emissions, the scenarios may understate the benefits to GDP growth. We also abstract from fiscal policy implications.