Euro repo market functioning: collateral is king
Repo markets play a major role in redistributing liquidity and collateral between financial institutions. A unique transaction-level database reveals how the euro-denominated repo market has performed since the mid-2000s. We find that the market recovered strongly from periods of intense stress, even though it remains segmented according to the home country of the collateral used. In recent years, signs of segmentation have increased as the main motivation of repo market participants has shifted from funding to the trading of collateral.1
JEL classification: E40, E58, G15, G23.
As a key component of the money market, the repo market is a major channel for circulating cash and collateral through the financial system. Since the mid-2000s, repos have grown to become the predominant source of short-term funding in euro-denominated markets. In this period, the market has weathered stress during the Great Financial Crisis (GFC) of 2007-09 and the European sovereign debt crisis of 2011-12, and has coped with changes such as the ECB's introduction of unconventional monetary policy and the advent of new financial sector regulation. This article tracks the repo market's functioning in the face of these developments.
We use a unique transaction-level data set for centrally cleared euro-denominated repos to examine the market's liquidity and pricing efficiency. We find signs that the market is persistently segmented according to the home country of the collateral used. This may impede the redistribution of liquidity. Yet, despite this segmentation, we find that the repo market remained functional during periods of stress: transaction costs stayed low and prices themselves adjusted smoothly to changing fundamentals.
We also find increasing signs that, in recent years, the market has been driven by investors in search of specific collateral rather than investors seeking funding. This feature has strengthened segmentation along collateral lines. Consistent with segmentation, individual participants have "preferred habitats", in the sense of systematically borrowing and lending against collateral of a given country.
The following section outlines trading activity in the euro repo market over the 2006-18 period. We then discuss how different segments performed in terms of liquidity and pricing efficiency. The third and fourth sections examine the intensity of arbitrage trades across segments and the tendency of market participants to specialise in individual collateral segments. The final section concludes.
Key takeaways
- The euro repo market is a key channel for redistributing liquidity between financial institutions.
- The market shows signs of persistent segmentation according to the home country of the collateral.
- In recent years, demand for collateral has replaced funding considerations as the main driver of activity, further emphasising segmentation.
Statistical data: data behind all graphs
Trends in transaction volumes
A repurchase agreement (repo) is a two-legged transaction that resembles a collateralised loan. A borrower of cash sells securities (the collateral) to the lender and agrees to buy them back later at a pre-specified price.2 Typical borrowers of cash are asset managers, pension funds and insurance companies. Typical lenders of cash are money market funds and corporate treasurers. Repos are intermediated by large broker-dealers, who are also significant repo users in their own right, to finance market-making inventory, source short-term funding or invest cash. Repo transactions can be either bilateral trades or cleared through a central counterparty.3
Repo markets fulfil two key functions. The first is to facilitate the borrowing and lending of cash. Repos are an attractive option for lenders seeking to place cash, because the collateral they receive (including haircuts and margin calls) mitigates credit risk. The second function is to facilitate the circulation of collateral or the exchange (swap) of collateral. Lenders of cash can obtain specific securities (for speculation, to cover short positions etc) for the repo's duration, while lenders of the securities improve their portfolio liquidity without an outright sale.
These two functions represent the main motivations for investor participation in the repo market: the search for funding and the search for collateral. They are also roughly echoed in the two main market segments: general collateral (GC) repos and specific collateral (SC) repos. In the GC segment, the borrowing and lending of cash is the primary motivation for the transaction, the only requirement for the underlying collateral being that it offers sufficient credit quality. The SC segment is better suited to trades driven by collateral needs, because transactions specify the particular security that is exchanged in the two legs (Mancini et al (2016)).
The outstanding volume of euro-denominated repos exceeded €500 billion at end-2018. In the absence of comprehensive data on the euro repo market, our analysis focuses on cleared trades. Our database pools transaction data from three electronic platforms: BrokerTec, Eurex Repo and MTS Repo. These platforms cover the near-universe of centrally cleared repos denominated in euros, which in turn account for more than two thirds of overall activity (ECB (2015)). To analyse potential differences across segments, we consider only transactions using German, French, Italian or Spanish government bonds as collateral (SC and GC), as well as those using the GC Pooling basket, which encompasses securities eligible as collateral in the ECB's framework. This results in nine collateral segments, which account for more than 75% of the centrally cleared market and about 50% of the total market.4 Thus, our sample is broadly representative of the overall market.
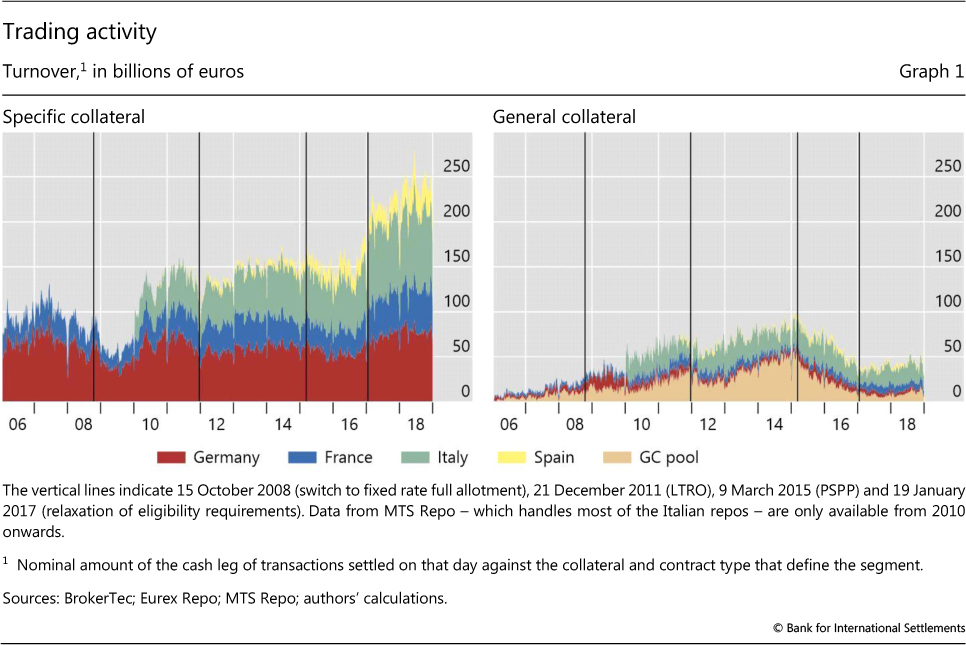
The euro repo market has grown significantly since the mid-2000s. Graph 1 shows the daily trading volumes for each collateral segment between 2006 and 2018.5 The total volume of transactions in our data increased from about €200 billion in late 2011 to about €300 billion in late 2018. This growth has been most evident in the Italian and Spanish collateral segments, especially in SC, even when activity in the German segment slowed, as in late 2011.6 Below we discuss other patterns of differential dynamics across collateral segments.
One feature of the market that comes through clearly in Graph 1 is the preference of traders for specific over general collateral. Turnover has been significantly higher in SC segments than in GC segments, and trends in the two segments have diverged after 2015. Indeed, in 2015-18, turnover in the SC segment almost doubled, to €250 billion, whereas that in GC halved, to €50 billion. This divergence is consistent with a shift in the euro repo market towards transactions that are more securities-driven and less funding-driven (Brand et al (2019)).
The trends in market activity since the GFC are linked to the conduct of monetary policy. In late 2011, trading volumes dropped temporarily after the ECB introduced its longer-term refinancing operations (LTRO), which gave banks an alternative source of liquidity. In March 2015, turnover dropped after the ECB started to buy government bonds under its public sector purchase programme (PSPP). Collateral scarcity from the central bank's purchases boosted activity in SC segments and reduced it in GC segments (especially the GC pool).7 SC segments received a further boost around the end of 2016, when the ECB enhanced its Securities Lending Programme (SLP) and relaxed the rules for eligible securities.
Liquidity and pricing efficiency
In a well functioning market, prices adjust promptly to shifts in underlying economic drivers, and do so smoothly. In this section, we analyse metrics of liquidity and pricing efficiency for the various collateral segments of the euro repo market. The metrics confirm the differences in the behaviour of these segments and point to the enhanced importance of collateral demand as a driver of the euro repo market.
Market liquidity
Liquidity generally refers to the market's capacity to smoothly absorb traders' orders (CGFS (1999)). We consider two measures of market liquidity: the effective spread and the price impact (see box). The effective spread uses the covariance between price changes in successive transactions to gauge the (unobserved) effective bid-ask spread. Transaction costs, such as the effective spread, are low in liquid markets. The price impact is calculated as the ratio of price changes to trading volume, with a low value indicating a liquid market. We use the repo rate as the relevant price.
Liquidity in the euro repo market was high on average over the period, but deteriorated at times in response to specific factors. Effective spreads were generally low, between 1 and 3 basis points (Graph 2, top panels), and so too was the price impact of trades, usually remaining below 10 basis points per billion euros in transaction volume (bottom panels). However, indicators across all segments deteriorated markedly but to varying extents in 2010-11 during the European sovereign debt crisis. They improved after the LTRO made its debut in December 2011. The introduction of the PSPP in 2015 had a moderately negative impact on repo liquidity, although its influence is confounded by the phasing-in of regulatory reforms that increased the capital requirement for banks' repo market activities, lifting banks' demand for high-quality liquid assets (HQLA). Finally, the indicators point to regular spikes of illiquidity in repo markets around the turn of the year, owing to window-dressing by banks (see below).
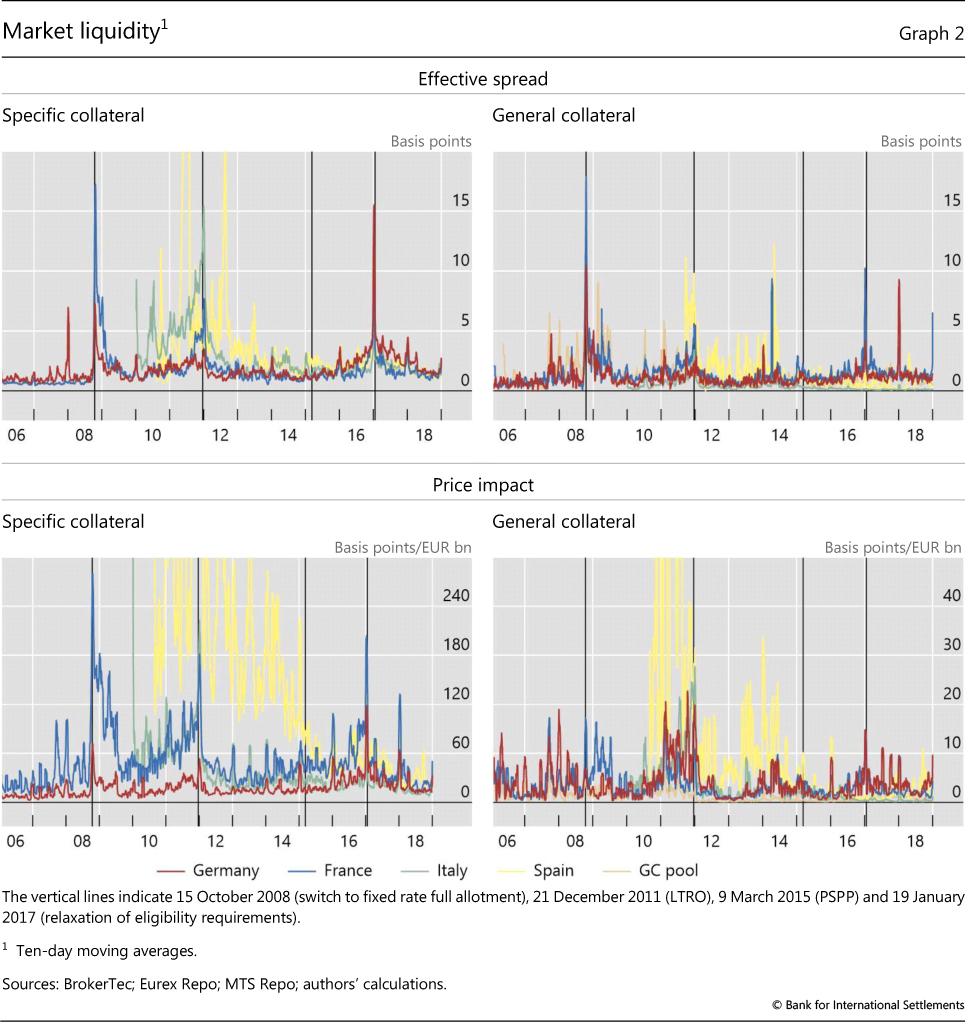
Within this general picture, liquidity differed between segments. GC segments were more liquid than SC segments, despite the lower transaction volumes in the former. The difference was starkest for the price impact indicator (Graph 2, bottom panels), which indicated that trading in SC repos had a price impact that was often 10 times that of an equivalent GC repo trade. The greater liquidity of GC segments is partly explained by the fact that GC repos bundle many different collateral securities into one large order book. Yet, despite their lower liquidity, SC segments have registered increases in trading volume in recent years, which suggests that investors' demand for specific collateral has gained importance as a driver of repo market activity.
Measures of market liquidity and pricing efficiency
We measure market liquidity using two estimates of transaction costs: the effective spread (Roll (1984)) and the price impact measure proposed by Amihud (2002), which is related to order book depth (Kyle (1985)). Pricing efficiency is measured by realised volatility. All measures are calculated at a daily frequency by averaging across transactions that took place on a given collateral segment and tenor, and then weighting by transaction volume.
The effective spread is calculated on the basis of executed transactions (as opposed to market order book) using the following formula: 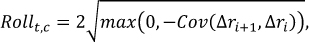 where ∆ri+1 denotes the difference in the repo rate between two consecutive transactions using collateral c on day t. The Roll measure assumes that subsequent transactions originate from the same order book. Hence, in adapting it to the repo market, we use transactions involving the same specific security as the collateral, and then compute the weighted average within the segment:
 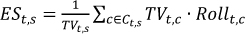 , where Ct,s denotes the set of securities traded within segment s on day t. ESt,s can be interpreted as the average transaction cost paid in segment s on day t.
The price impact is given by 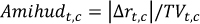 , where |∆rt,c| denotes the absolute value of the interest rate change on repos with collateral c during day t (ie the difference in closing rates from day t-1 to t). In a similar way to the effective spread, the Amihud measure is computed for each individual security used as collateral and is averaged across all securities in the segment:
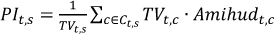
The realised volatility is computed as 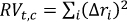 , where ∆ri denotes the change in the rate from one repo transaction to the next. Again, rate changes must be computed between repos using the same collateral. So the subscript c denotes a specific security and the sum is over all transactions using this security that are settled on day t. We then average across all securities in the segment:
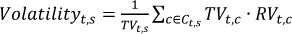
Within the SC and GC segments, liquidity varied according to the home country of the collateral. The relative liquidity of national collateral in GC segments was similar to their ranking by trading volume. However, in SC segments this was not the case from 2015 onwards. The most traded SC repo was German, yet it was among the less liquid ones (red line in Graph 2). French collateral had a very low effective spread in the SC segment. However, in the GC segment it exhibited pronounced spikes and after 2015 incurred the widest effective spread. The Spanish and Italian collateral segments demonstrated lower and more volatile liquidity on average.
Pricing efficiency
A market with an efficient pricing mechanism is one that adjusts smoothly and rapidly to underlying fundamentals. In a short-term funding market, this shows up as a low dispersion of rates across time and across collateral segments (spreads). We compute three measures of pricing efficiency. The first is the realised volatility of the repo rate (see box) in line with Krishnamurthy and Duffie (2016), which captures the variability of rates in the time dimension. The other two capture the idea that, in an efficient repo market, funding rates against different collateral should move closely with each other. However, when a specific security is in high demand, lenders of cash may accept a lower rate for the corresponding SC repo than they would for a GC repo (where they do not know what security they will receive). We calculate a repo specialness premium as the spread between the SC and GC repo rates of the same collateral segment (Duffie (1996)). This premium should normally be negative, and its size should reflect the importance of collateral scarcity. Short-maturity repo rates should move in parallel with the policy rate. We compute the scarcity premium, defined as the average rate in a given GC segment minus the policy rate, as another measure that gauges the intensity of collateral scarcity spilling over to GC rates.
Rate volatility measures show a pattern similar to the effective spread. Realised volatility was low on average but elevated in particular periods (Graph 3, top panels). Volatility was lower in the GC segment than in the SC segment, despite the lower transaction volumes in the former.
Over the 2006-18 period, repo rate volatility spiked higher on three occasions. The first was during the GFC. After the crisis, volatility never returned to the lows seen previously. Then, during the period of strain in euro area government bond markets in 2011-12, rates in the Italian and Spanish SC segments became several times more volatile than in their German and French counterparts. This divergence arguably reflected elevated sovereign credit risk embedded in the collateral (Mancini et al (2016)) and possibly the counterparty risk of the clearing houses (Boissel et al (2017)). The dispersion of volatility across segments rapidly declined after the ECB injected liquidity and, in December 2011, introduced the LTRO.
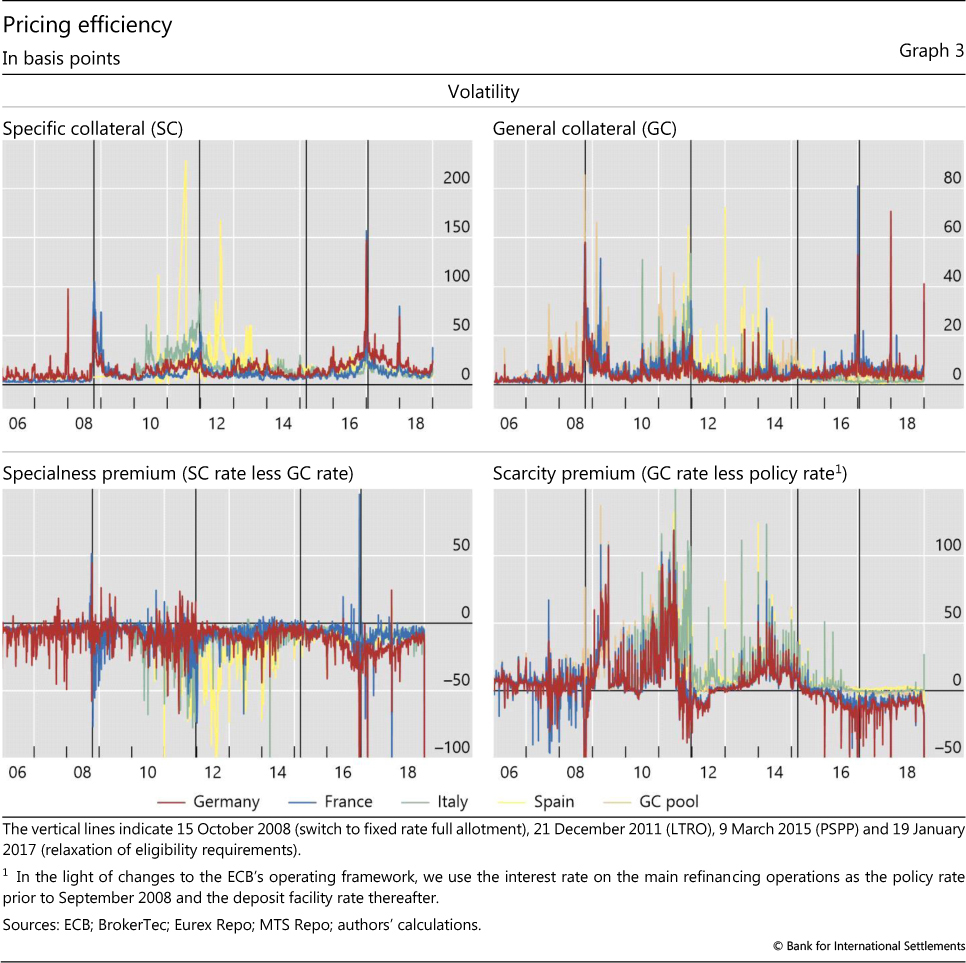
A third period of high volatility followed the introduction of the PSPP in March 2015. Volatility began to rise gradually, with the safest collateral showing the highest volatility. This probably reflected a scarcity of collateral due to the combined effect of the ECB purchases and higher demand for HQLA. The pressure on rates from collateral demand eased partially when the securities lending facility was introduced in December 2016 and the eligibility requirements for bonds purchased under the PSPP were relaxed in January 2017. These patterns also show how collateral-driven forces have intensified in the repo market.
Turning to the cross-sectional dispersion of rates, the specialness premium was mostly negative, indicating that SC rates were usually below GC rates, as expected (Graph 3, bottom left-hand panel). The premium and its dispersion across segments were higher on average after the GFC, rising to particularly elevated levels when volatility was also high. The deeply negative premia in the Italian and Spanish collateral segments during the period of sovereign bond market stress may reflect short-selling by speculators. After 2015, as the ECB purchased bonds, the German SC segment exhibited the highest and most volatile premium, consistent with the scarcity of collateral.
The pattern of the scarcity premium was driven by changes in the ECB's monetary policy framework, as well as by funding stress in sovereign debt markets around 2012. The ECB deposit rate represents a natural floor to repo rates, as banks looking for funding can always borrow from the central bank against collateral. Funding problems pushed the premium higher in all segments, while concerns about sovereign credit risk boosted demand for German bonds in 2011, lowering the corresponding spread (red line). It remained positive for other collateral segments, indicating that any scarcity pressures were confined to the SC segments. The introduction of the PSPP, however, pushed the scarcity premium into negative territory for all GC collateral segments. A negative scarcity premium indicates that banks are willing to lend against GC repos at rates below those of the ECB deposit facility, although GC repos do not specify which security the cash lender will receive. This collateral scarcity effect was present even in the large GC Pooling basket encompassing all European securities eligible in the ECB's collateral framework. The impact of the PSPP has been strongest in the German collateral segment, with the decline in pricing efficiency reflected in the rising dispersion of rates across all segments.
As for market liquidity, pricing efficiency measures spiked at year-ends. After 2015, these spikes became larger and premia were predominantly negative (see below).
Window-dressing
The market liquidity and pricing efficiency measures point to a seasonal deterioration in market functioning at the end of each quarter, especially at year-ends. This is when banks prepare their annual financial statements and calculate regulatory ratios and other charges, giving them an incentive to window-dress their balance sheet (Munyan (2015), CGFS (2017), Aldasoro et al (2018)).8 Scaling back the repo book makes sense for banks, because repos are a volume-driven, low-margin business that swells their balance sheets (and associated charges).9
Year-end disruptions in repo market functioning are evident throughout the period we investigate. They manifest themselves as rate spikes and declines in trading activity (Graph 4). Interestingly, while turnover starts to decline at least 10 days before the end of the year, rate spikes are confined to the last day of the year. This indicates that rate disruptions are probably associated with unexpected liquidity needs of individual participants that happened to coincide with a shallow market (Graph 3).
The market strains due to year-end window-dressing are not uniform across collateral segments. For instance, the median turnover in the German SC segment at year-end was about 60% of the average volume during a window of 40 business days around the turn of the year (Graph 4, left-hand panel). By contrast, the Italian GC segment shows a more moderate decline. The French SC segment and the GC pool segment show the largest declines in activity, while other GC segments register smaller drops.10
Year-end rate spikes show heterogeneity across collateral segments and over time (Graph 4, right-hand panels). Prior to 2015, GC market rate spikes were, on average, larger than those in SC segments and were also mostly positive, indicating that funding from repos was becoming more expensive. In the period since the PSPP was introduced, rate spikes switched direction and became more pronounced in the SC segment, in particular for transactions using higher-quality (German and French) collateral. Spikes for investors offering Spanish or Italian collateral went negative (funding became cheaper) only at year-end 2016.
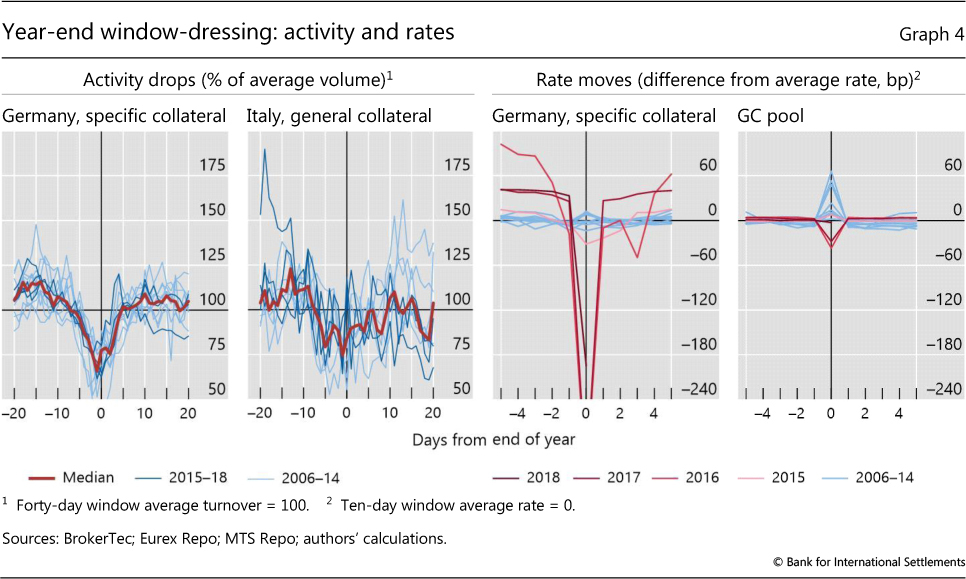
These observations provide further evidence of the greater role of collateral-driven motives in shaping market dynamics. Window-dressing removes intermediation capacity from the repo market. Prior to the PSPP, when funding motives were more important, this reduction in capacity translated into higher borrowing rates. When the ECB engaged in large-scale bond purchases, it supplied reserves but created a scarcity of collateral. When intermediation capacity becomes constrained at year-ends, collateral does not circulate as freely, translating into lower borrowing rates against scarce collateral.
Arbitrage across segments
In the previous section, we highlighted how market segmentation manifests itself in a persistent dispersion of rates across collateral segments. In an efficient market, differences in rates should incentivise arbitrageurs to engage in collateral swaps. The transactions can exploit rate spreads by lending cash against any collateral that attracts the higher rate and borrowing cash by offering the collateral that attracts the lower rate. This puts pressure on the rate gap, but may stop short of eliminating it, given transaction costs and convenience yields (ie when investors' preference for a particular collateral manifests itself as a lower rate).11 Below we examine the extent to which rate dispersion leads to collateral swaps. We find that it does, but not in volumes sufficient to eliminate rate differences.
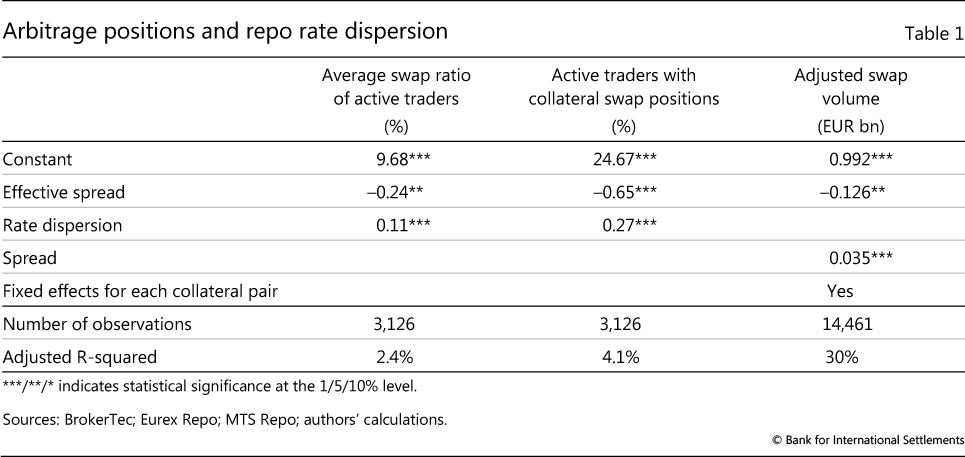
We construct a measure of traders' arbitrage positioning by following Agueci et al (2014) in calculating the swap ratio that measures the extent to which a trader takes offsetting positions across collateral segments.12 The metric takes values between unity and zero. If a trader is a net borrower in one segment and simultaneously a net lender in another (but balanced overall), then the metric will be close to unity. By contrast, if a trader is either a net borrower or a net lender in each segment they participate in, the metric will be zero. We then construct two market-wide statistics based on the swap ratio (which is calculated for each trader). The first is the average swap ratio for all active traders on a given day. The second is the proportion of traders who have a non-zero swap ratio (ie those with portfolios that are consistent with collateral swap trade activity).
Regression analysis confirms a relationship between the two market-wide statistics of traders' positioning and the rate dispersion (Table 1, first two columns).13 The coefficients are positive and statistically meaningful, indicating that equilibrating arbitrage forces are at work in the repo market. As expected, arbitrage activity is deterred by transaction costs (negative estimated coefficients for the effective spread). The economic relationship between spreads and arbitrage trades is not strong enough to eliminate the rate dispersion. The average swap ratio increases by only one tenth of a percentage point per basis point of rate dispersion. Similarly, the share of traders with non-zero swap ratios increases by only three tenths of a percentage point. Given the price impact of trades estimated earlier, these positions are too small to significantly reduce the gap in rates.14
The swap ratio indicates the extent to which collateral swaps take place, but it does not take into account whether swaps are in the same direction as rate differentials. To sharpen our analysis, we look at the trading volume that satisfies this condition and compute a daily adjusted swap volume measure for each collateral pair and every trader, which measures the amount of j-collateral exchanged for i-collateral.
In the above expression,  denotes the net borrowing volume in segment i. The first part computes the maximal volume that could correspond to a swap, given the trader's positions, whereas the second part ensures that we measure only positions in opposite directions.15 We aggregate all traders' adjusted swap volumes in a given segment and run a regression pooling the data across collateral pairs over the entire period. Transaction costs are measured as the sum of the two effective spreads corresponding to the given pair.
The panel regression using the adjusted volume gives results that are consistent with those for the aggregate swap ratio metrics (Table 1, third column). Traders do trade against the gaps in repo rates, as indicated by the positive and significant coefficient on the bilateral spread, but the volume is about 35 million for each basis point in rate differentials. Spreads rarely exceed 30 basis points. This means that less than one billion of collateral swaps per country pair are driven by repo spreads. This is a small amount compared with the overall market turnover of €200-300 billion. Importantly, given our estimates of the price impact of trades, these positions are too small to eliminate rate differentials. This suggests either that spreads reflect important drivers of collateral heterogeneity (ie convenience yield) or that there is insufficient activity by traders that crosses national collateral segments.
Specialisation of market participants
In this section, we look into two potential drivers of repo market segmentation. One is the segmentation of market activity into different trading platforms, which may hinder arbitrage activity across collateral segments. The other is specialisation by traders, who might exhibit a strong preference for trading only in specific segments.
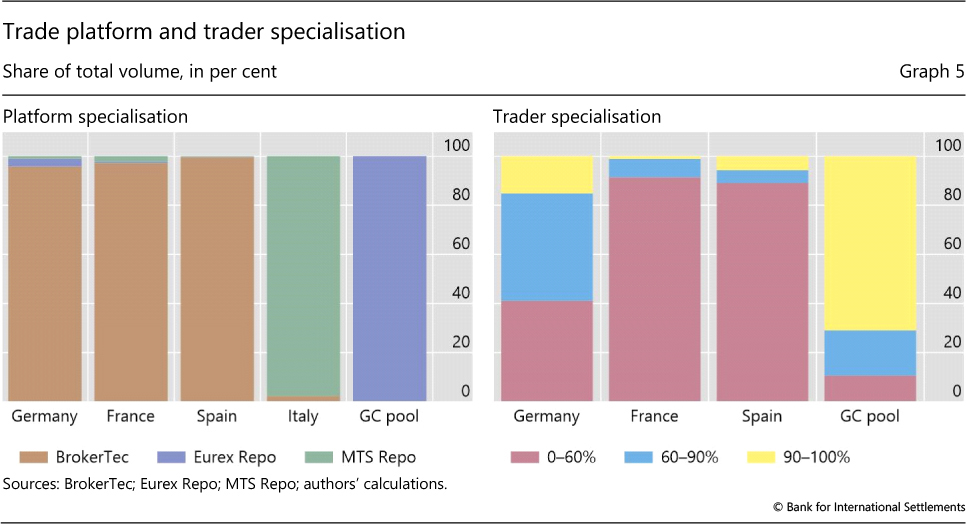
Trading platforms for euro-denominated repos show a clear pattern of specialisation. Different collateral segments trade on different platforms, and only a very small share of transactions crosses over to other platforms (Graph 5, left-hand panel). For instance, almost all German collateral transactions are traded on BrokerTec, while MTS Repo clears practically all repos using Italian collateral. Platform segmentation can complicate the transfer of collateral across clearing houses.
Individual repo market participants do not spread their trading activity evenly across collateral segments, but they tend to specialise. We measure the extent of specialisation by the share of each segment's activity that is accounted for by traders that conduct most of their repo activity in that segment. More concretely, we first aggregate the trading positions of each participant by exploiting the anonymised counterparty identities in the data and calculating the share of their total turnover accounted for by transactions in a given segment.16 We classify each trader as having a low (0-60%), medium (60-90%) or high (90-100%) specialisation score in the particular segment. The right-hand panel of Graph 5 shows the proportion of total turnover in a collateral segment that is accounted for by traders with different specialisation scores. More than 55% of repo transactions using German collateral involve traders who themselves conduct at least 60% of their repo business in this segment. The same statistic for the GC pooled segment is almost 85%. By contrast, transactions in the French and Italian segments are conducted by participants who are much less specialised.
The specialisation of repo traders is consistent with evidence that euro area bond investors, including banks, have a pronounced home bias in favour of bonds issued by their domestic sovereign (Boermans and Vermeulen (2018)). Domestic government bonds account for 55% of the average European bank's sovereign portfolio and 84% of the sovereign portfolio of banks from riskier countries (Koijen et al (2016)).17 This home bias in bond holdings translates into a preference for conducting repos in the corresponding collateral segment. The evidence we present in this article is also consistent with the more general observation that money markets in the euro area are fragmented (Cœuré (2019)).
Conclusion
The euro repo market proved resilient to both the GFC and the ensuing stress in the euro area sovereign market. That said, it shows signs of segmentation along the lines of the collateral used, with individual traders (banks) tending to specialise in one or just a few collateral segments. This segmentation manifests itself in the way that repos behave differently against the various types of national collateral. It is further reflected by differences in the metrics that gauge market quality: liquidity and pricing efficiency. These market quality characteristics tend to be more fragile in some segments than in others, depending on circumstances. The differing response of the various market segments to year-end window-dressing also reflects this segmentation.
A consistent message across the different parts of our analysis is that, in recent years, the euro repo market has been driven more by the needs of investors seeking particular securities as collateral rather than by investors seeking to trade liquidity. This trend has gained force from the ECB's purchases of government bonds as it seeks to provide additional monetary stimulus. While this shift has had no significant impact on the market's overall functioning, it has affected that of individual segments. It remains unclear whether the importance of collateral demand in reshaping the repo market's dynamics is a permanent shift or only a consequence of the central bank's balance sheet expansion, as it simultaneously increased funding liquidity and removed collateral through securities purchases. In either case, these efforts have amplified the trend towards market segmentation.
References
Agueci, P, L Alkan, A Copeland, I Davis, A Martin, K Pingitore, C Prugar and T Rivas (2014): "A primer on the GCF repo service", Federal Reserve Bank of New York Staff Reports, no 671.
Aldasoro, I, T Ehlers and E Eren (2018): "Global banks, dollar funding, and regulation", BIS Working Papers, no 708, March.
Amihud, Y (2002): "Illiquidity and stock returns: cross-section and time-series effects", Journal of Financial Markets, vol 5, no 1, pp 31-56.
Boermans, M and R Vermeulen (2018): "Quantitative easing and preferred habitat investors in the euro area bond market", Netherlands Bank, DNB Working Papers, no 586.
Boissel, C, F Derrien, E Ors and D Thesmar (2017): "Systemic risk in clearing houses: Evidence from the European repo market", Journal of Financial Economics, vol 125, no 3, pp 511-36.
Brand, C, L Ferrante and A Hubert (2019): "From cash- to securities-driven euro area repo markets: the role of financial stress and safe asset scarcity", European Central Bank, ECB Working Paper Series, no 2232.
Cœuré, B (2019): "A tale of two money markets: fragmentation or concentration", speech at the ECB workshop on money markets, monetary policy implementation and central bank balance sheets, 12 November.
Committee on the Global Financial System (1999): "Market liquidity: research findings and selected policy implications", CGFS Papers, no 11, May.
--- (2017): "Repo market functioning", CGFS Papers, no 59, April.
Duffie, D (1996): "Special repo rates", The Journal of Finance, vol 51, no 2, pp 493-526.
European Central Bank (2015): Euro money market survey.
Koijen, R, F Koulischer, B Nguyen and M Yogo (2016): "Inspecting the mechanism of quantitative easing in the euro area", Bank of France, Working Papers, no 601.
Krishnamurthy, A and D Duffie (2016): "Passthrough efficiency in the Fed's new monetary policy setting", in Designing resilient monetary policy frameworks for the future, proceedings of the Federal Reserve Bank of Kansas City Jackson Hole symposium, August.
Kyle, A (1985): "Continuous auctions and insider trading", Econometrica, vol 53, no 6, pp 1315-35.
Mancini, L, A Ranaldo and J Wrampelmeyer (2016): "The euro interbank repo market", Review of Financial Studies, vol 29, no 7, pp 1747-79.
Munyan, B (2015): "Regulatory arbitrage in the repo market", Office of Financial Research, US Department of the Treasury, Working Papers, no 15-22, October.
Roll, R (1984): "A simple implicit measure of the effective bid-ask spread in an efficient market", The Journal of Finance, vol 39, no 4, pp 1127-39.
1 The authors thank Claudio Borio, Stijn Claessens, Jörg Diener, Andreas Schrimpf, Egon Zakrajšek and, especially, Philip Wooldridge for helpful comments and suggestions. The views expressed in this article are those of the authors and do not necessarily reflect those of the Bank for International Settlements.
2 A repo transaction from the point of view of the seller of the securities is a reverse repo when seen from the point of view of the lender (the buyer of the securities).
3 We classify tri-party repos as bilateral since credit risk remains between buyer and seller.
4 We cover repos with a one-day maturity (overnight, tomorrow-next, spot-next). These make up 95% of centrally cleared transactions. Over 75% of repos with one-day maturity are centrally cleared. We use figures in ECB (2015) to compute market shares.
5 The trading volume of a given segment equals the nominal amount of the cash leg of transactions settled on that day against the collateral and contract type that define the segment. Repo dynamics depend on when cash and collateral are exchanged, rather than when the repo was negotiated.
6 As data from MTS Repo are available from 2010, our sample includes repos against Italian collateral only from 2010 onwards.
7 The effect of ECB purchases on bond scarcity came on top of higher demand from banks for high-quality liquid assets, which was related to changes in liquidity regulations.
8 The balance sheet size is a key element in the calculation of the leverage ratio. It is also an input to the score that determines the capital surcharge for systemically important banks, as well as the basis for the calculation of contributions to deposit protection schemes and other levies, depending on the jurisdiction. In many European jurisdictions, banks can report their balance sheet size as of the last day of the quarter rather than on a period-average basis.
9 Financial reporting standards specify that the borrower of cash through a repo cannot derecognise the securities it offers as collateral because of its obligation to buy them back in the second leg of the contract, while it has also to recognise the cash it receives.
10 Statistics for different collateral segments are available from the authors upon request.
11 In principle, the credit risk associated with the collateral can also contribute to the gap but, for the data we analyse, this is unlikely to be an important factor. All repo trades in our data are centrally cleared, mature after one day and are collateralised with securities classified by regulators within the top category of high-quality liquid assets. Given that coupon payments during the transaction's lifetime are passed back to the borrower (even though legal ownership rests with the lender), any convenience yield must consist of non-pecuniary benefits (eg the security's eligibility for the collateral framework of the central bank, CCP or exchange).
12 More concretely, for every trader we compute the net borrowing volume in each market segment and divide the absolute total net borrowing volume by the sum of each market segment's absolute borrowing volume. To facilitate interpretation, we use the difference between unity and this fraction.
13 We define rate dispersion as the absolute spread between average rates in one segment and average rates in the whole repo market.
14 We estimate the average price impact in the German collateral segment to be 18 basis points per billion volume of transactions and that in the Italian segment to be 37 basis points per billion. This means that a swap of €15-20 million would be required to reduce the rate differential by 1 basis point.
15 A negative value for the adjusted flow metric implies that i-collateral is swapped for j-collateral. The metric is set to zero when the sign of net borrowing does not match that of the rate spread (ie when the swap direction is not consistent with arbitrage trades).
16 We are unable to perform this exercise for the MTS Repo data, which cover most of the repo activity using Italian collateral.
17 Euro area banks also tend to assign lower risk weights to their holdings of bonds issued by their home government than do other banks that hold the same bonds.