Financial conditions and purchasing managers' indices: exploring the links
Purchasing managers' indices (PMIs) have found a place in global conjunctural analysis and quarterly GDP nowcasting, serving as reliable concurrent indicators of real economic activity. They also closely mirror changes in equity prices and corporate bond spreads. More surprisingly, PMIs react to changes in the dollar index, and do so in a way that runs counter to a trade competitiveness explanation. We show that the financial variables help predict PMIs and explain a significant proportion of their variation. The two seem to be linked through shifts in macroeconomic sentiment and global financing conditions.1
JEL classification: C53, E27, F31, F47.
Purchasing managers' indices (PMIs) are monthly economic surveys of companies in which senior managers overseeing operations answer questions on business activity and its recent trends. The questions cover output, employment, new orders, prices, costs and other aspects of business activity. Due to their timeliness and breadth of coverage, PMIs are among the business surveys most closely watched by analysts and commentators. PMIs also add power to forecasting models and are being used to derive real-time estimates ("nowcasts") of GDP.2 In early 2018, PMIs came under the spotlight as they started to foreshadow weaker export orders and industrial output growth well before a slowdown in global economic activity became more visible in hard data during the first half of 2019.
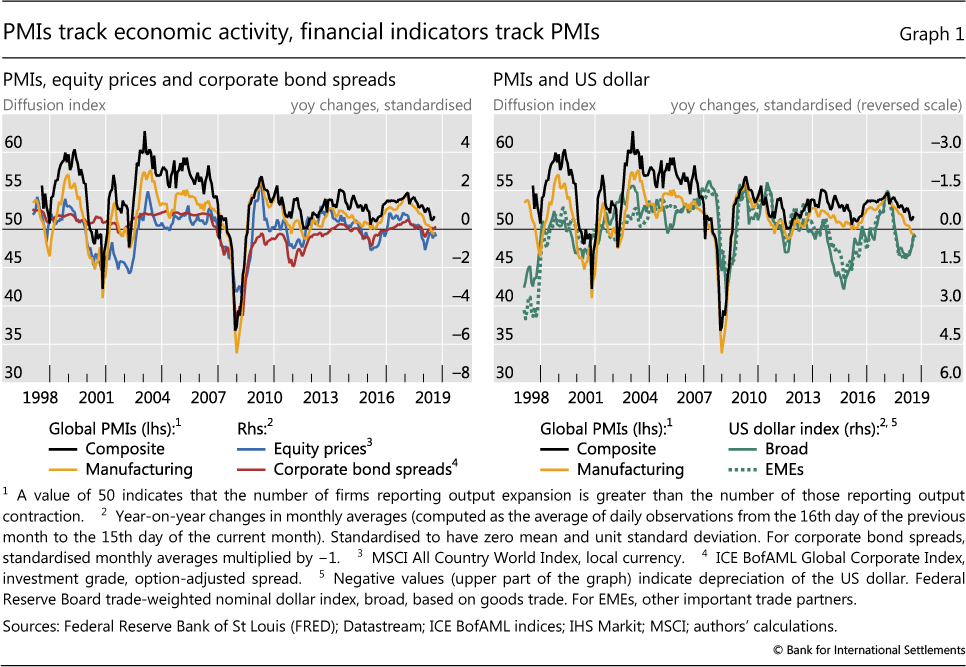
This special feature explores the links between financial conditions and PMIs, highlighting empirical findings that shed light on the economic mechanisms at work. As it is well known that real activity and financial conditions tend to mirror each other (Stock and Watson (2003), Andreou et al 2013)), we would expect PMIs and financial conditions to mirror each other as well. Not surprisingly, we find that global and country PMIs are correlated with equity prices and corporate credit spreads (Graph 1, left-hand panel). Equity indices largely reflect market participants' assessments of future economic activity, while credit spreads also incorporate measures of financing conditions (see Gilchrist and Zakrajšek (2012)).
Key takeaways
- Purchasing managers' indices (PMIs) mirror changes in both real economic activity and financial conditions.
- Changes in equity prices, corporate bond spreads, and US dollar indices help predict PMIs, and explain a large share of variation in PMIs and GDP.
- The link between PMIs and the dollar runs counter to what trade competitiveness predicts, suggesting a role for the dollar as an indicator of global financing conditions.
Perhaps more surprisingly, we find that PMIs also correlate with the strength of the US dollar, as reflected in broad indices of the dollar exchange rate (Graph 1, right-hand panel). The correlation with PMIs outside the United States goes against an explanation based on trade competitiveness: it is when the dollar is strong that PMIs outside the United States are weak, contrary to the view that a strong dollar should stimulate activity through gains in trade competitiveness. A full explanation of this empirical finding is not attempted here, but we mention some possible lines of inquiry.
We first describe PMIs and briefly examine their statistical properties. We then study how selected indicators of global financial conditions track the PMIs, and conclude by discussing mechanisms that might underpin the empirical relationships.
PMIs and economic activity
PMI surveys ask a range of questions that bear directly on real economic activity.3 A typical question for manufacturing output would be: "Is the level of production/ output at your company higher, the same or lower than one month ago?" and for services output: "Has your business activity (in units) risen, fallen, or stayed unchanged over the past month?". The net balance of survey responses is converted into a diffusion index, which is seasonally adjusted. An index reading above 50 shows that the variable has increased since the previous month, below 50 that it has fallen. The broadest family of PMI surveys is conducted by IHS Markit, which samples some 26,000 firms worldwide.4 The sample is stratified by size (small, medium and large firms) and sector (15 manufacturing and 12 service sectors in the composite index), with country PMIs aggregated into regional and global ones.
Further reading
As business activity indicators, PMIs have several advantages over traditional statistical data such as industrial production, retail sales, or exports and imports. One is their timeliness: PMI readings are released immediately after the end of the reference month.5 By comparison, industrial production data are published in many cases five to seven weeks after the end of a reference month, which can be problematic for assessments of conjunctural developments and decision-making in real time. Another advantage is the breadth of PMIs' coverage. By surveying managers who order intermediate products, decide on inventory levels or set prices, PMIs should accurately capture the vagaries of business conditions. This is especially the case when the surveyed firms are engaged in international trade and are thus exposed to shifts in global conditions. Moreover, by putting the same (or a very similar) set of questions to companies around the world, PMI surveys provide a data set that is comparable across countries and sectors. Such standardisation and comparability are not always guaranteed between national statistical surveys.
Numerous studies have confirmed that PMIs are reliable concurrent indicators of real activity. Harris (1991), Koenig (2002) and Peláez (2003) were early to document the ability of PMIs to beat naïve benchmarks and deliver accurate GDP nowcasts. Godbout and Jacob (2010) and Rossiter (2010) established that PMIs could be useful in nowcasting global macroeconomic aggregates. Strong properties of PMIs in tracking real GDP growth were also established for many individual economies, the euro area, and for country panels.6
PMIs and financial indicators
PMIs show the direction of change in business conditions, but say little about the drivers of that change. One possible source of such information is comments that purchasing managers give to explain or add nuance to their responses. However, these comments are anecdotal and cannot be easily structured for empirical research.
More informative are the correlations between the PMIs and other high-frequency data, notably financial variables. One reason is that these variables tend to reflect the financing conditions faced by the respondent firms; this information is, in turn, likely to affect purchasing managers' responses to questions about economic activity, both present and future. Likewise, financial variables tend to reflect current economic activity and, as forward-looking variables, the economic outlook too. Business sentiment plays a key role in both respects.
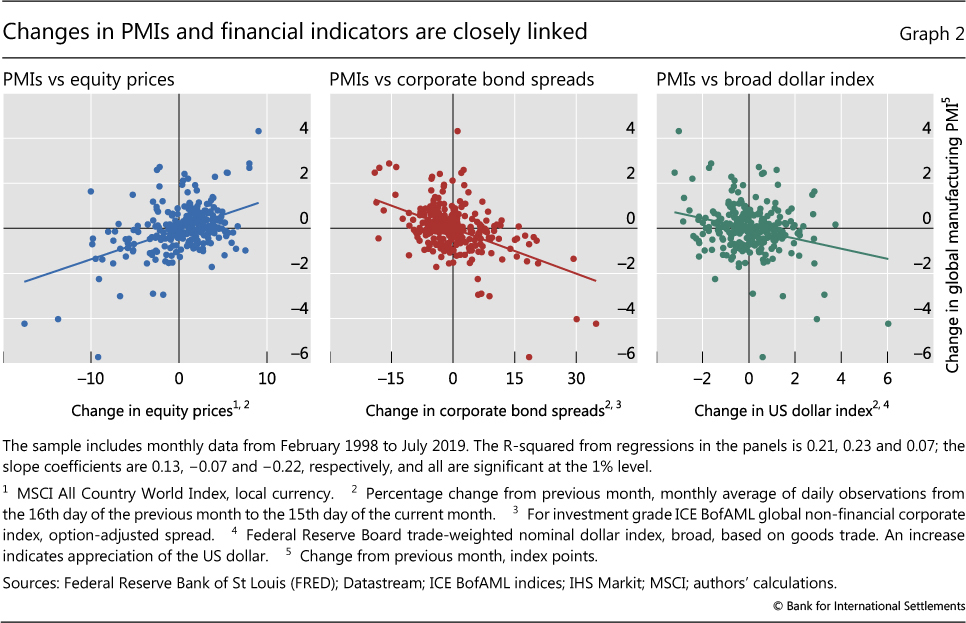
Changes in PMIs are indeed closely correlated with equity indices and corporate bond spreads. Over the past two decades, a 1 percentage point increase in local currency equity prices has been associated with a 0.13 point increase in manufacturing PMIs globally (Graph 2, left-hand panel). Wider corporate bond spreads have been negatively correlated with the PMIs (centre panel). As equity indices and corporate spreads incorporate forward-looking information on future economic activity and profitability as well as on current lending conditions, it should not be surprising that both are correlated with PMIs.
Perhaps more remarkable is the finding that the dollar index is also correlated with PMIs. More notably still, the dollar index is correlated with PMIs in a way that argues against a straightforward trade competitiveness explanation. It is when the dollar is strong that global PMIs are weak, in spite of any gain in trade competitiveness. This is especially visible for manufacturing PMIs, which declined on average 0.22 points over a month whenever the trade-weighted exchange rate of the US dollar ("broad dollar index") appreciated by 1% (right-hand panel).
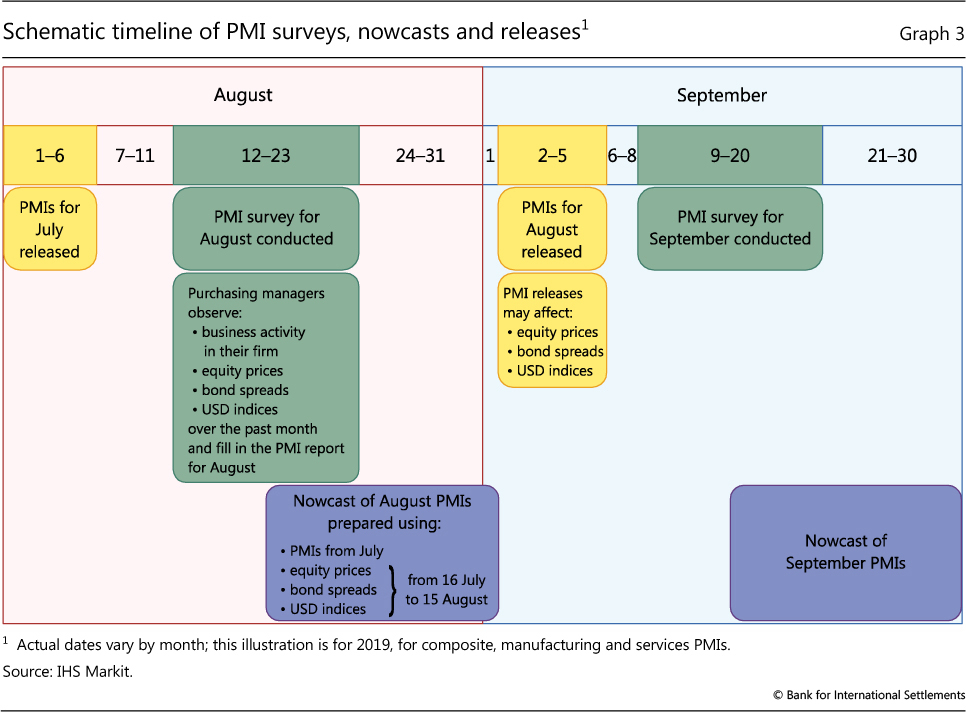
Before we suggest possible reasons for the empirical association between the dollar and PMIs, we examine more systematically how correlations between financial variables and PMIs show up in basic in-sample forecasting exercises. In particular, we ask how well current month (eg August) PMIs can be nowcast by relying on financial market information available up to the point the survey is conducted (ie until mid-August). In other words, we assume that business conditions reported at mid-month relative to the previous mid-month partly reflect the influence of financial variables on purchasing managers' decisions over that period (Graph 3).7
We then compare such a prediction with a naïve forecast relying only on past PMIs. Formally, we estimate the following monthly regression:8

where PMIt is expressed in deviations from the benchmark of no change from previous month, and Δst is the percentage change of a given financial indicator computed over the 30 days between the dates the two polls are taken. This means that equation (1) seeks to predict the release of the PMI reading (the yellow square in Graph 3) with a two-week lead (blue square). We include financial variables one at a time: equity prices, corporate bond spreads, and trade-weighted dollar indices.
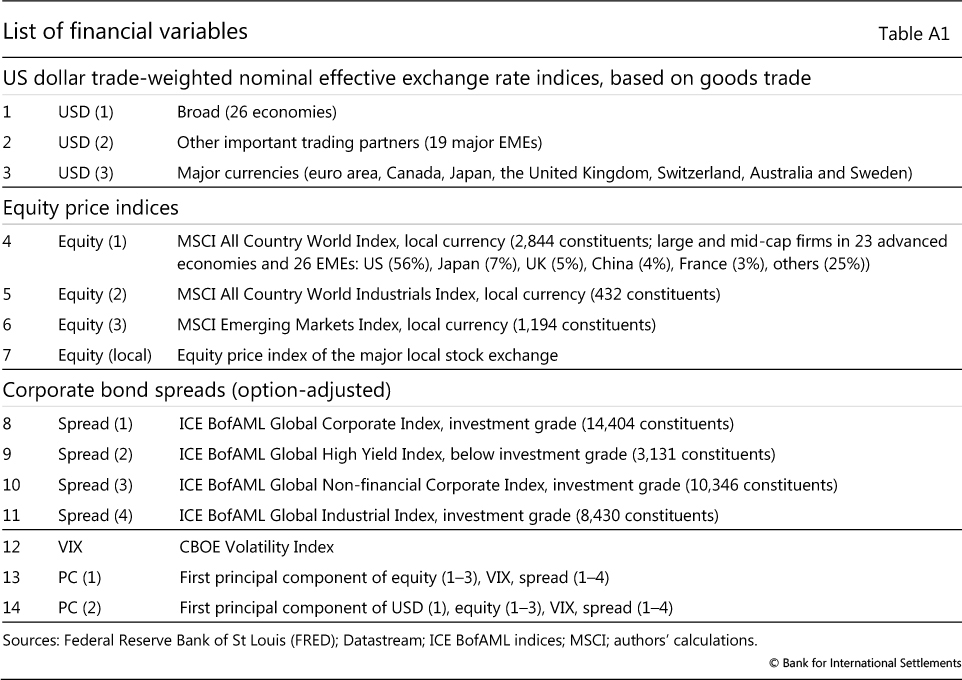
As regressors, we selected financial indicators with high visibility, global coverage and daily availability. This seems appropriate for nowcasting global PMIs, and works against us in nowcasting country-level PMIs, adding robustness to the results. We used MSCI equity price indices in local currency (All Country, World Industrials, Emerging Markets), and ICE BofAML corporate bond indices with option-adjusted spreads (Global Investment Grade, High- Yield, and Non-financial Investment Grade) (see Table A1 in the Appendix for details). For the dollar exchange rate, we used Federal Reserve Board indices based on goods trade: Broad (trade-weighted across 26 advanced and emerging market economy (EME) currencies); Other Important Trading Partners (19 major EME currencies); and Major Currencies (seven advanced economy currencies). For robustness checks, we also ran regressions with BIS effective exchange rates, an equity price volatility (VIX) index, and the first principal components of different combinations of these indicators. The results were very similar to those using the above variables.9
Empirical findings
The results of regressions using this setup suggest that the financial variables considered have valuable information content in nowcasting PMIs. Estimated coefficients from global PMI regressions have the expected signs and are statistically highly significant (Table 1).10 Higher equity prices are associated with expanding business activity, and wider corporate bond spreads and a stronger dollar with dampening activity. This applies to nowcasting both composite and manufacturing PMIs, as well as their new export orders components (results not shown).

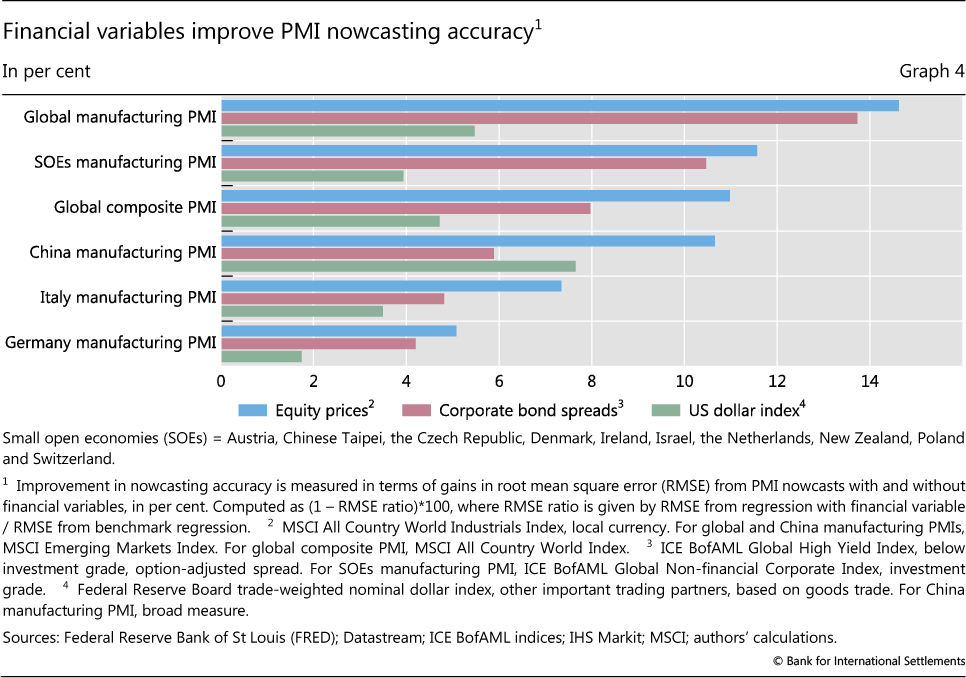
Importantly, adding financial variables improves the accuracy of PMI nowcasts. Root mean square errors (RMSEs) from regressions with a financial variable added to the lagged PMIs are lower than those from the naïve forecasting model that only contains lagged PMIs.11 In terms of economic significance, gains in forecast accuracy from adding financial variables range up to 15% for equity indices, 14% for corporate bond spreads, and 8% for dollar indices (Graph 4).12
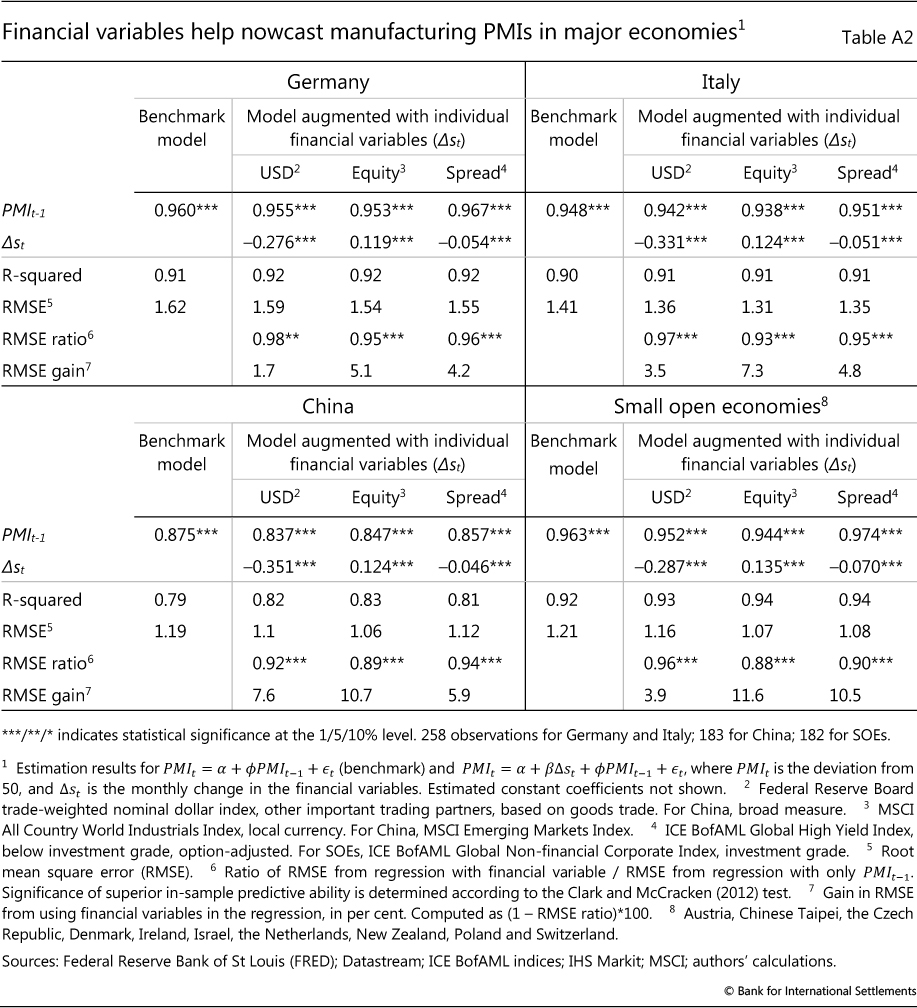
Country-level regressions indicate that financial variables are particularly well suited to nowcast PMIs in more open economies. For regressions on China, Germany, Italy and small open economies, for example, estimated coefficients on all dollar, equity and corporate bond indices are statistically highly significant (Table A2). Interestingly, for China dollar indices outperform corporate spreads and are not far behind equity indices in terms of RMSE gains (Graph 4).13
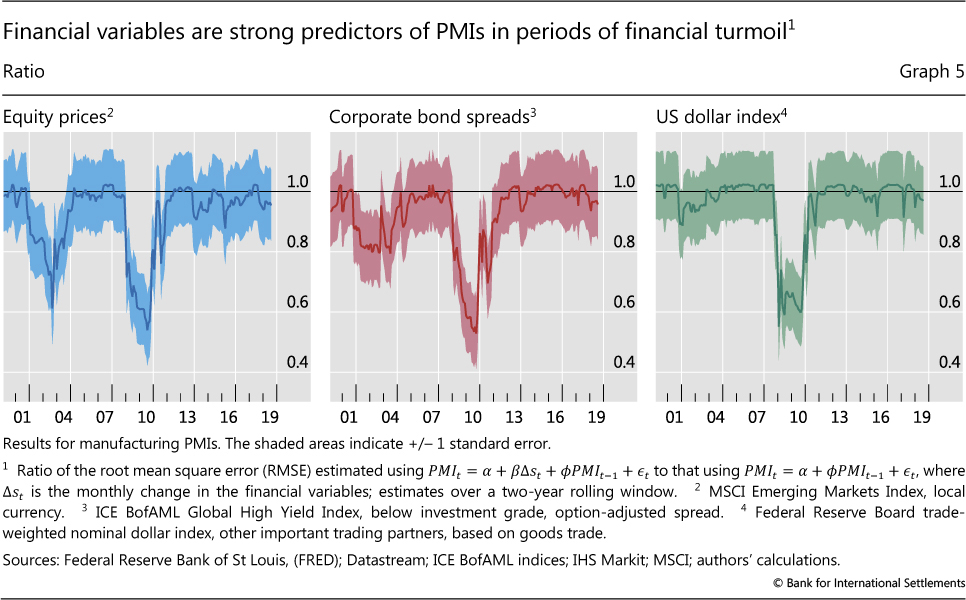
The forecasting gains from the use of financial variables in nowcasting PMIs come mainly from periods of market turmoil, in particular the Great Financial Crisis (GFC), and, for equity prices and corporate spreads, the 2002-03 stock market downturn. This is evident when one looks at regressions based on rolling windows. The ratio of RMSEs from global manufacturing PMI regressions that use equity prices and bond spreads dropped sharply relative to the benchmark model during 2002-03 and, together with regressions using the dollar index, during 2008-09 (Graph 5). This finding is not surprising, as financial variables move strongly during periods of turmoil; it is also in line with findings on the role of financial variables in predicting GDP (Bańbura and Rünstler (2011), Espinoza et al (2012)). In the case of China, the forecasting power of the dollar index (as well as equity prices) also comes from the 2014-17 period, when domestic financial tensions spilled over globally. Interestingly, the relative ordering of financial variables in terms of RMSE ratios stays more or less unchanged over time, with equity and corporate bond spreads generally outperforming the dollar indices, but all three contributing to the accuracy of nowcasts relative to the naïve forecasting benchmark (results not shown).
Interpreting the results
What kind of economic relationships could help explain these statistical correlations?
In trying to answer this question, we first look at how shocks to different financial variables affect PMIs and GDP. The aim of this exercise is to understand what part of the observed dynamics in PMIs and GDP can be ascribed to the news that was already (and correctly) reflected in financial prices. We do so by resorting to a simple vector autoregression (VAR) model featuring, in order, equity returns, the dollar index, PMI and GDP.14 This ordering choice can be rationalised with the help of the timeline in Graph 3: within a given month, as financial variables are predetermined with respect to PMIs, they are not allowed to react contemporaneously to PMI-specific shocks.
Based on this ordering, the first shock (associated with equity returns) can be interpreted as the continuous flow of news related to macroeconomic (as well as financing) conditions that financial market agents process and incorporate into equity prices at high frequency - before actual numbers for PMIs and GDP are released. Similarly, the second shock (associated with either the dollar index or corporate bond spreads) can be thought of as the additional information that is included in the dollar index (or corporate spreads). The third shock (associated with PMIs) can then be interpreted as the change in PMIs that was not already priced into financial variables, and can therefore be related to private information available to survey respondents during the polling period.
Both financial shocks explain quite a large proportion of the fluctuations in PMIs and GDP. Over a one-year horizon, the shock related to equities explains more than 60% of the variance of global manufacturing PMIs (Graph 6, left-hand panel) and global GDP (right-hand panel). This confirms that equity prices effectively incorporate news related to the macro environment and future profitability. What is more surprising is that the additional information conveyed by the dollar index significantly contributes to PMIs on top of equities: the dollar index explains on its own around 15% of the total variance in PMIs and about 10% of the variance in GDP.
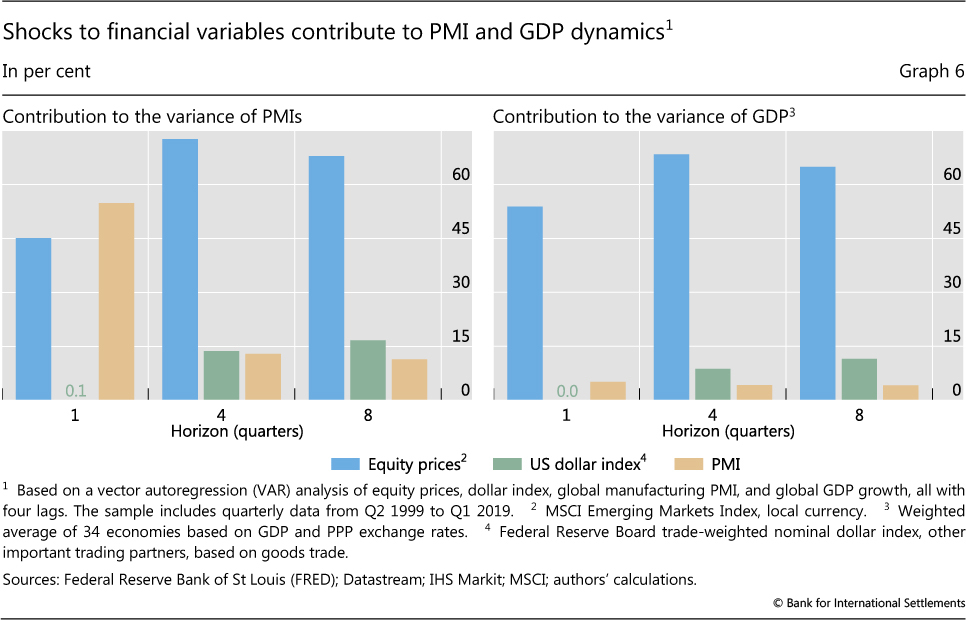
The significant contribution of the dollar index highlights its ability to convey useful information on financing conditions on top of that already included in equity prices. It is also remarkable that, if one replaces global GDP growth with the growth of global trade in goods, the results are broadly similar: the dollar still accounts for around 15% of the variance in trade, as compared with equities, which explain about 60%.
Taken together, these findings suggest that the links between the financial and real variables operate through both shifts in broad macroeconomic sentiment and global financing conditions. The higher explanatory power and the forward-looking nature of equity prices point to the former. Yet the significance of the dollar index and corporate bond spreads might also point more directly to a channel operating through shifts in global financing conditions. As noted above, purchasing managers are likely to internalise these shifts when making input and output decisions at the firm level, which then aggregate into GDP outcomes.15
For the traditional financial market variables - equity and corporate bond indices - evidence of such links is reassuring. It would be odd if firms' output and orders were shrinking while global equity prices were rising, or if widening corporate spreads were not associated with slower firm-level activity.16
More intriguing is the role of the dollar as a concurrent indicator of real activity. One explanation is safe haven flows: when the global economy is doing poorly, the US dollar generally appreciates. The sharp dollar appreciation during the GFC - which apparently provides most of the information content to nowcasting with the dollar index - corroborates this view.17
Another link, as noted above, might be the important trade-related dynamics associated with global supply chains (BIS (2017)). Firms within such chains generally have large working capital requirements because they need to fund inventories of intermediate goods, and often accounts receivable when selling to other firms along the supply chain (Shin (2019)). When these financing requirements go beyond the firms' own resources, the necessary working capital is typically provided via short-term bank credit. Much of this credit tends to be supplied in dollars (Gopinath and Stein (2018)), which means that its cost is sensitive to the dollar exchange rate, notably when dollar cashflow and assets fall significantly short of dollar liabilities (Avdjiev et al (2019)).18
With manufacturing and, increasingly, services being globally integrated, it is therefore not surprising that dollar credit conditions would have some impact on economic activity along global supply chains. Some empirical studies using annual accounting data have found evidence to support this hypothesis (Bruno et al (2018)). This special feature lends further support to this link, by showing that the dollar is relevant for nowcasting PMIs, especially in trade-intensive economies, and that it explains a fair proportion of the variation of PMIs and GDP.
References
Andreou, E, E Ghysels and A Kourtellos (2013): "Should macroeconomic forecasters use daily financial data and how?", Journal of Business and Economic Statistics, vol 31, pp 240-51.
Avdjiev, S, V Bruno, C Koch and H S Shin (2019): "The dollar exchange rate as a global risk factor: evidence from investment", IMF Economic Review, vol 67, no 1, March, pp 151-73.
Bańbura, M and G Rünstler (2011): "A look into the factor model black box: publication lags and the role of hard and soft data in forecasting GDP", International Journal of Forecasting, vol 27, pp 333-46.
Bank for International Settlements (2017): 87th Annual Report, Chapter VI, "Understanding globalisation".
Bok, B, D Caratelli, D Giannone, A Sbordone and A Tambalotti (2018): "Macroeconomic nowcasting and forecasting with big data", Annual Review of Economics, vol 10, pp 615-43.
Bruno, V, S J Kim and H S Shin (2018): "Exchange rates and the working capital channel of trade fluctuations", American Economic Review P&P, vol 108, pp 531-36.
Chudik, A, V Grossman and M Pesaran (2016): "A multi-country approach to forecasting output growth using PMIs", Journal of Econometrics, vol 192, no 2, pp 349-65.
Clark, T and M McCracken (2012): "In-sample tests of predictive ability: a new approach", Journal of Econometrics, vol 170, pp 1-14.
De Bondt, G (2018): "A PMI-based real GDP tracker for the euro area", Journal of Business Cycle Research, pp 1-24.
Duarte, P and D Süssmuth (2018): "Implementing an approximate dynamic factor model to nowcast GDP using sensitivity analysis", Journal of Business Cycle Research, vol 14, no 1, pp 127-41, April.
Espinoza, R, F Fornari and M Lombardi (2012): "The role of financial variables in predicting economic activity", Journal of Forecasting, vol 31, pp 15-46.
Gilchrist, S and E Zakrajšek (2012): "Credit spreads and business cycle fluctuations", American Economic Review, vol 102, no 4, pp 1692-720, June.
Godbout, C and J Jacob (2010): "Le pouvoir de prévision des indices PMI", Bank of Canada Staff Discussion Papers, 2010-3, April.
Gopinath, G and J Stein (2018): "Trade invoicing, bank funding, and central bank reserve holdings", AEA Papers and Proceedings, May, vol 108, pp 542-4.
Harris, E (1991): "Tracking the economy with the purchasing managers' index", Federal Reserve Bank of New York, Quarterly Review, Autumn.
Koenig, E (2002): "Using the purchasing managers' index to assess the economy's strength and the likely direction of monetary policy", Federal Reserve Bank of Dallas Economic and Financial Policy Review, vol 1, no 6.
Lombardi, M and P Maier (2010): "'Lean' versus 'rich' data sets: Forecasting during the great moderation and the great recession", Bank of Canada Working Papers, no 37, December.
McCauley, R and P McGuire (2009): "Dollar appreciation in 2008: safe haven, carry trades, dollar shortage and overhedging", BIS Quarterly Review, December.
Peláez, R (2003): "A reassessment of the purchasing manager's index", Business Economics, vol 38, no 4, October.
Rossiter, J (2010): "Nowcasting the global economy", Bank of Canada Discussion Papers, no 2010-12, September.
Shin, H S (2019): "Global imbalances and the international footprint of firms: what role for exchange rates?", speech at the Joint G20/IMF seminar on global imbalances, Washington DC, 10 April.
Stock, J and M Watson (2003): "Forecasting output and inflation: the role of asset prices", Journal of Economic Literature, vol 41, pp 788-829.
Appendix tables
1 The authors would like to thank Ana Aguilar, Claudio Borio, Stijn Claessens, Piti Disyatat, Emanuel Kohlscheen, Benoît Mojon, Christian Upper and Philip Wooldridge for helpful comments. The views expressed in this article are those of the authors and do not necessarily reflect those of the Bank for International Settlements.
2 For example, the New York Federal Reserve Bank Staff nowcasting model uses PMIs (Bok et al (2018)).
3 For manufacturing PMIs, these are typically output, employment, new orders, backlogs of work, purchases of intermediate goods, stocks of inputs and finished goods, suppliers' delivery times, input and output prices, and expected business activity. For services and composite indices, these are new and outstanding business, employment, input costs, prices charged and expected business activity.
4 IHS Markit adapted the US PMI methodology in the early 1990s, and gradually extended it to almost 40 countries. The US family of PMIs, compiled by the Institute of Supply Management, was developed during the Great Depression in the 1930s, also a period of intense interest in economic barometers.
5 Surveys are collected from around the 10th/12th to the 20th/22nd of the reference month.
6 See eg Chudik et al (2016) and De Bondt (2018). Relatedly, work with PMIs challenged the notion that economic forecasters should focus on data dimension enlargement rather than reduction (Lombardi and Maier (2010), Duarte and Süssmuth (2018)).
7 In the illustrative timeline shown in Graph 3, PMI survey periods are shown as green areas, PMI releases as yellow, and nowcasts as blue ones. To match the polling period, we take average daily values of month-on-month changes in financial variables between the median days of polling periods (from the 16th day of the previous month up to the 15th day of the current one). For simplicity, we do not consider flash PMIs, which are released for only five economies (the euro area, France, Germany, Japan and the United States) around the 22nd/23rd of the reference month. Their revisions are very small.
8 This framework is similar to that used by Gilchrist and Zakrajšek (2012).
9 Regressions with principal components generally had the best nowcasting properties. However, for ease of interpretation, we opted instead to show individual financial variables.
10 In the tables and graphs that follow, we show the estimates for individual variables with best statistical properties across global and country samples. These are by and large the same as those in Table 1.
11 A ratio of RMSEs from such regressions should be lower than 1 for financial variables to add statistically significant value to the nowcast that uses only past values of PMIs.
12 The RMSE gain statistic used to assess the relative performance of financial indicators is defined as (1 − RMSE ratio)*100. By definition, the variable with the largest RMSE gain contributes the most to nowcasting the PMI.
13 Dollar indices are also highly significant in predicting manufacturing PMIs in the Netherlands and the euro area as a whole, as well as in Brazil, India, Russia and Turkey (results not shown).
14 We also run a VAR in which the USD index is replaced by corporate bond spreads. Results were qualitatively similar.
15 Separately, single-equation regressions indicate that parameter estimates for current financial variables (Δst) retain statistical significance when lagged variables (Δst-1) are added to regressions; and that, in many cases, the latter are not significant. This suggests that purchasing managers seem to use mostly contemporaneous financial market information when making decisions, as past financial developments are likely to have been already incorporated in lagged PMIs.
16 The absence of a significant relationship between the spreads and PMIs in some countries may indicate reliance of firms on self-financing, perhaps due to weak or expensive credit supply to private firms. Scatterplots of RMSE gains and financial development indicators, however, do not reveal any strong relationship.
17 Much of the dollar appreciation in that period was due to the financial institutions' hedging operations linked to their US investments (McCauley and McGuire (2009)).
18 Interestingly, our results show that it is the "other important trading partners", ie the EME dollar index that has the strongest correlation with the PMIs, and it is the PMIs of open, manufacturing-heavy economies in Europe that are most strongly correlated with the dollar index. However, there are also some surprises. Korea does not figure among the countries with highly significant coefficients on the dollar index, while India and Russia do. And, for China, it is the broad dollar index that does (marginally) better than the EME one.