Highlights of global financial flows
The BIS, in cooperation with central banks and monetary authorities worldwide, compiles and disseminates data on activity in international financial markets. It uses these data to compile indicators of global liquidity conditions and early warning indicators of financial stability risks. This chapter analyses recent trends in these indicators. It is based on the latest data for international banking markets, available up to March 2017, and for international debt securities, available up to June 2017.1
Takeaways
- International bank claims continued to grow in the first quarter of 2017, led by 2.8% year-on-year growth of claims on the non-bank sector. Year-on-year growth in interbank claims turned positive for the first time since the first quarter of 2015.
- The stock of international debt securities grew by 4.1% year on year in the second quarter of 2017, led by increased net issuance from the non-bank sector.
- Growth in euro-denominated credit to the non-financial sector outside the euro area picked up, led by a 12.3% rise in bank loans in the year to end-March 2017.
- The outstanding stock of US dollar credit to non-banks in emerging market economies (EMEs) advanced to $3.4 trillion at end-March 2017. The increase was driven entirely by higher debt securities issuance.
- Credit-to-GDP ratios remained well above trend levels for a number of jurisdictions, including Canada, China and Hong Kong SAR. In most cases, these large gaps coincided with property price gaps above critical thresholds.
- The outstanding government debt of EMEs has doubled since 2007 (see box), as debt securities issuance accelerated. The increase in debt was accompanied by longer average maturities and a greater use of fixed rate instruments.
Global liquidity conditions continued to ease in early 2017
Against a background of subdued financial market volatility, and building on the trend from recent quarters, global credit conditions as measured by the BIS global liquidity indicators (GLIs) eased in early 2017.2 International bank credit (cross-border claims plus local claims in foreign currency)3 continued to grow in late 2016 and early 2017 (Graph 1, top panel). With a year-on-year growth rate of 1.7% in the first quarter of 2017, the stock of international bank claims stood at $32.0 trillion at end-March. As in recent quarters, the growth in international bank claims was led by credit to non-banks, which reached three consecutive years of positive growth in Q1 2017. Interbank claims, in turn, posted positive year-on-year growth for the first time since the first quarter of 2015.
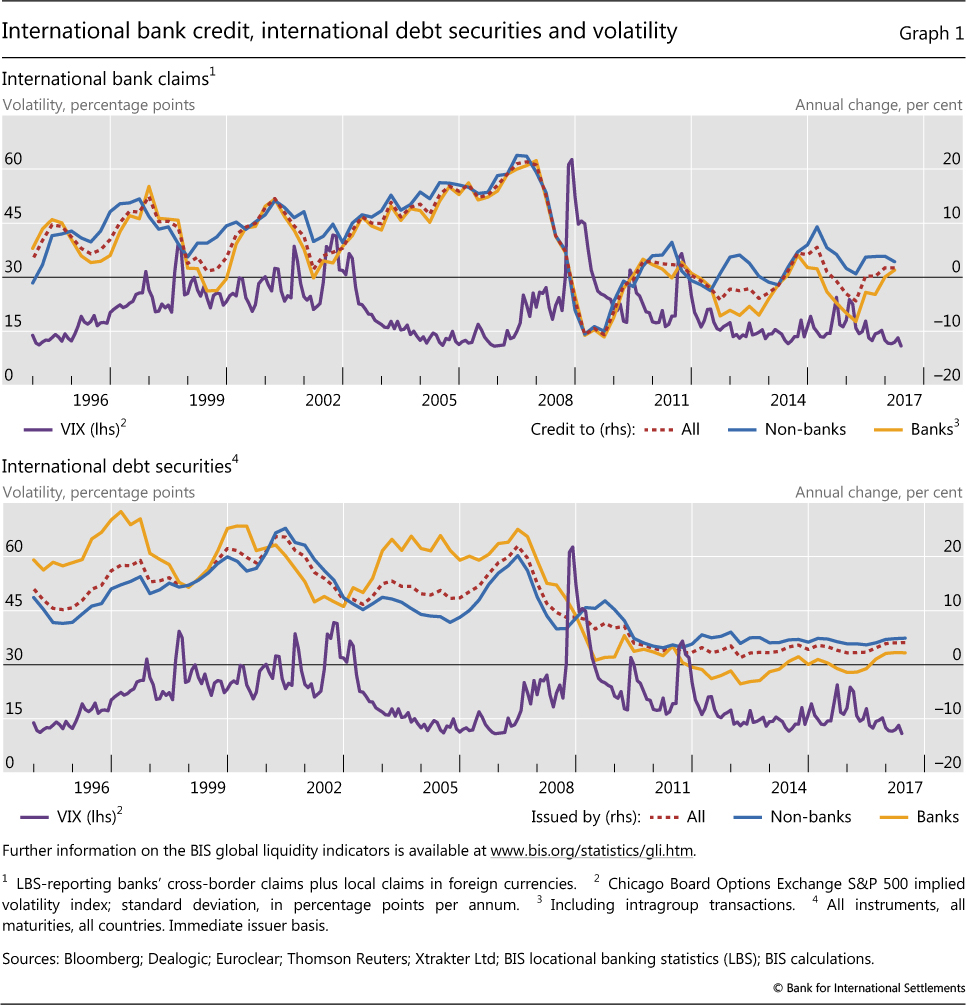
The stock of international debt securities4 also grew in the first half of 2017 (Graph 1, bottom panel). Net issuance of $277 billion and $283 billion in the first and second quarters of 2017, respectively, took the outstanding stock to $22.7 trillion as of end-June 2017, a 4.1% increase compared with a year earlier. The stock of banks' debt securities grew further (2.2% year on year in Q2 2017), reaching rates last seen at the beginning of 2011. Outstanding international debt securities of non-banks, however, grew even faster in the year to end-June 2017 (4.9%).
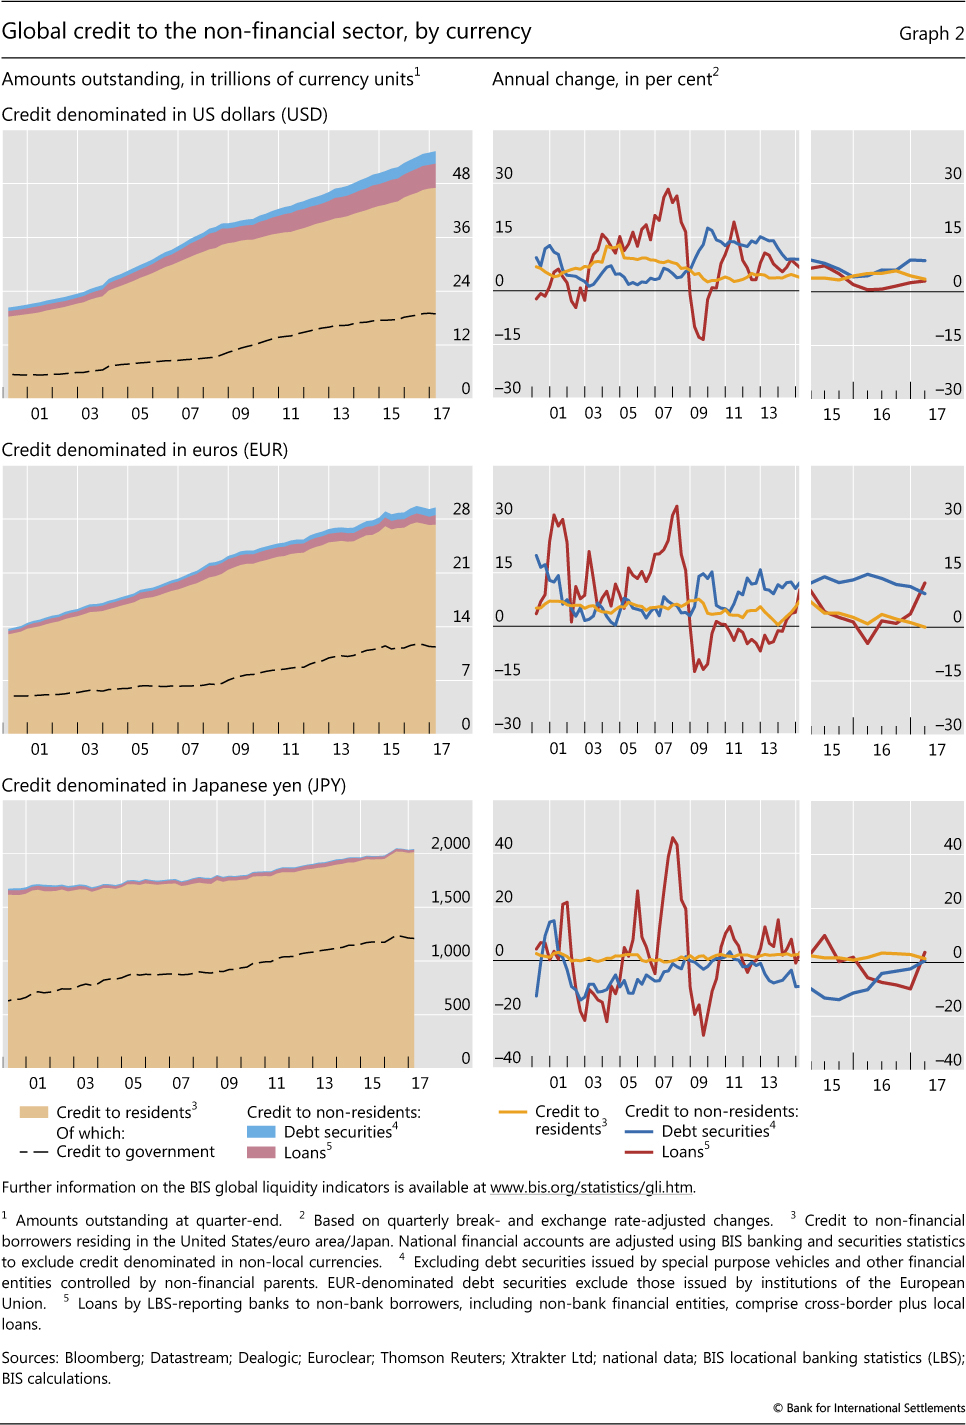
In parallel with the broad increase in international bank claims and debt securities, foreign currency credit to non-residents continued to expand in Q4 2016 and Q1 2017 (Graph 2). US dollar-denominated debt securities and euro-denominated bank loans led the way.
Total outstanding US dollar credit (bank loans plus debt securities issuance) to the non-financial sector outside the United States rose from $8 trillion at end-September 2016 to $8.2 trillion at end-March 2017 (Graph 2, top panels); or from $10.5 trillion to $10.7 trillion if non-bank financial borrowers are included. The stock of US dollar-denominated debt securities issued by non-financials outside the US grew by 8.6% year on year through Q1 2017 (top right-hand panel). Growth in bank loans picked up slightly, to 2.9% in Q1 2017, compared with a year earlier.
At end-March 2017, outstanding euro-denominated credit to borrowers outside the euro area reached €2.3 trillion ($2.4 trillion) to non-financial borrowers (Graph 2, centre panels), or €2.8 trillion ($3.0 trillion) if non-bank financials are included. The growth in net issuance of euro-denominated debt securities by non-financials outside the euro area remained high, but came down slightly in the beginning of 2017. Year-on-year growth in outstanding debt securities decreased somewhat to 9.3% in the first quarter of 2017. Growth in euro-denominated bank claims, on the other hand, picked up considerably to 12.3% in Q1 2017, the highest year-on-year growth rate since Q3 2008.
Yen-denominated credit to the non-financial sector outside Japan, for which overall amounts are significantly smaller (¥30.4 trillion or $271 billion at end-March 2017), halted its year-on-year decline in the first quarter (Graph 2, bottom panels). Bank claims recovered noticeably, growing 3.7% year on year in the first quarter of 2017. At the same time, the year-on-year growth in net international debt securities issuance in yen by issuers outside Japan reached positive territory for the first time since Q3 2011, as the outstanding stock rose by 0.6% in the first quarter of 2017 compared with a year earlier.
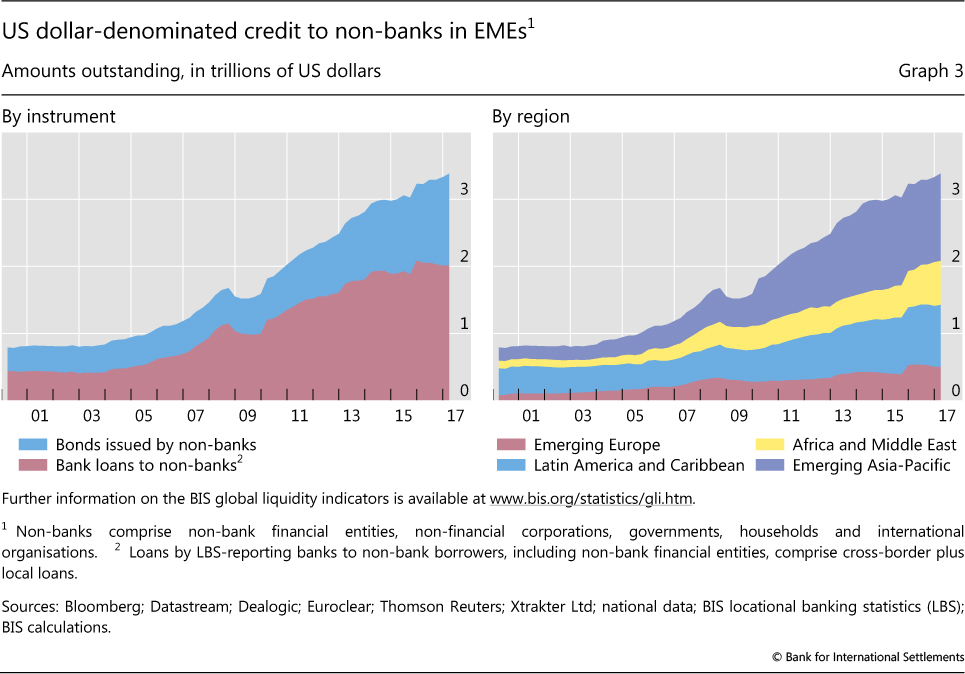
US dollar credit to EME borrowers continued to grow, rising to $3.4 trillion at end-March 2017.5 The expansion was entirely driven by increased debt securities issuance, as outstanding bank claims fell during the same period (Graph 3, left-hand panel). The bulk of the increase came from US dollar borrowing by residents of Africa and the Middle East ($59 billion), especially through net bond issuance by governments in oil-exporting countries. This was followed by emerging Asia ($39 billion) and Latin America ($19 billion). US dollar credit to borrowers of emerging Europe, however, declined by $25 billion between end-September 2016 and end-March 2017.
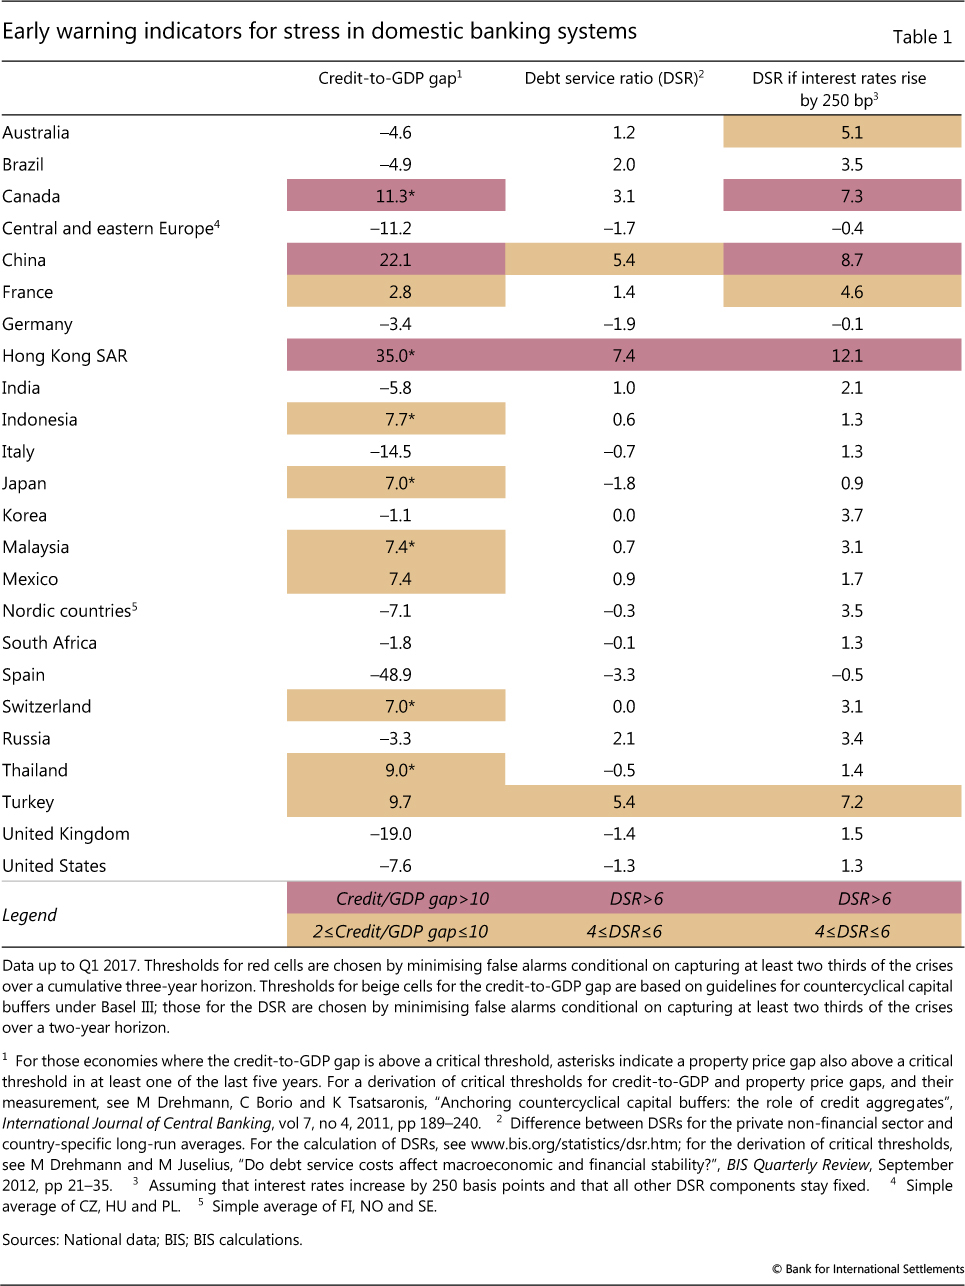
Early warning indicators for stress in domestic banking systems - which by their nature change little from quarter to quarter - continue to signal vulnerabilities in some jurisdictions (Table 1, with data up to Q1 2017). According to the BIS early warning indicators,6 credit-to-GDP gaps (the difference between current credit-to-GDP ratios and their recent trend levels) stand above critical thresholds in Canada, China and Hong Kong SAR (first column). Relative to prior readings, the credit-to-GDP gaps have narrowed somewhat.7 In most cases, the warning signal given by credit-to-GDP gaps coincided with property price gaps also above critical thresholds (contemporaneous or recent, marked with asterisks - see footnote 1 in Table 1).
Debt service ratios, which aim to capture aggregate principal and interest payments in relation to income for the total private non-financial sector, remain below critical thresholds, with the exception of Hong Kong SAR (second column). Assuming a 250 basis point increase in interest rates (with 100% pass-through), the debt service ratio indicator points to potential risks in Canada, China and Hong Kong SAR (third column). However, these numbers are meant to be only broadly indicative of the exposure of debt service to higher yields under stress scenarios, and should not be treated as a formal stress test. Moreover, in contrast to what is assumed for simplicity and comparability in the indicator, increases in rates usually take time to translate into higher debt service ratios. The speed and extent of the pass-through depend on a variety of factors, including the share of debt at floating rates, maturity profiles and changes in borrower behaviour.
Box
Recent trends in EME government debt volume and composition
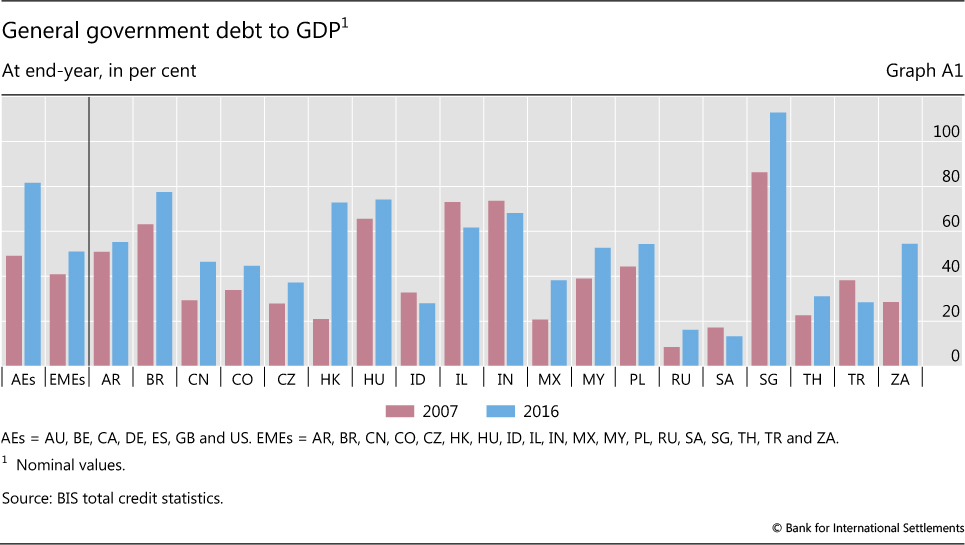
At the end of 2016, the government debt of EMEs totalled $11.7 trillion, more than twice the figure at end-2007. Brazil, China and India accounted for around $8 trillion of this amount. Government debt as a share of GDP rose from 41% to 51% over the same period (Graph A1).
The composition of government debt has changed significantly over time. As debt levels have risen, EME governments have made greater use of domestic and international bond markets: the average share of borrowing through debt securities rose from 62% in 2002 to 80% in 2016. Borrowing is mostly done in local currencies, at longer maturities and at fixed rates. Domestic issuance greatly exceeds international issuance, though the latter is on the rise.
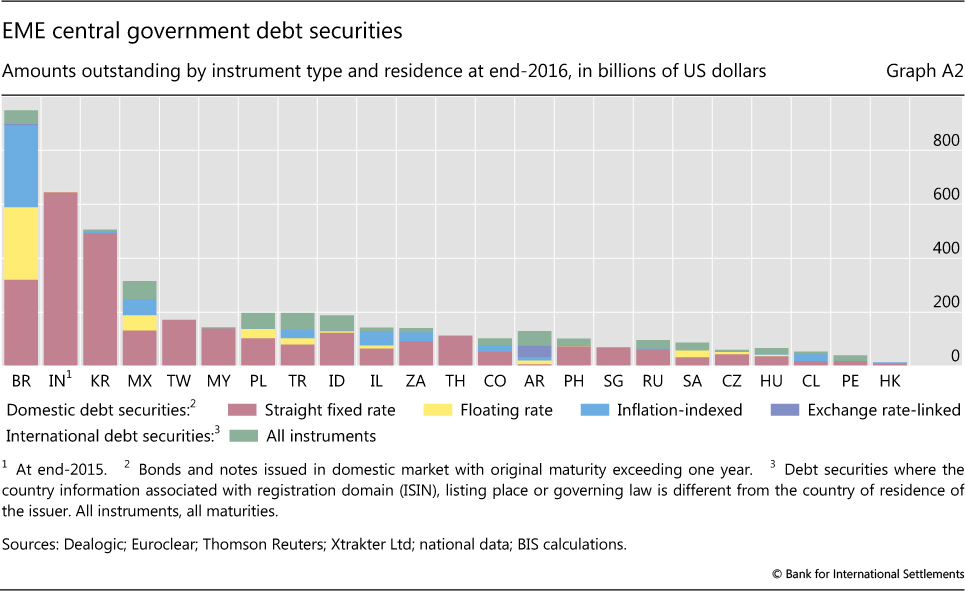
For the 23 jurisdictions sampled and presented in Graph A2, total central government borrowing constituted around $4.4 trillion, of which 14% was denominated in or linked to foreign currencies as at end-2016. The foreign currency share has declined considerably over the past 15 years: it stood at 32% at end-2001.
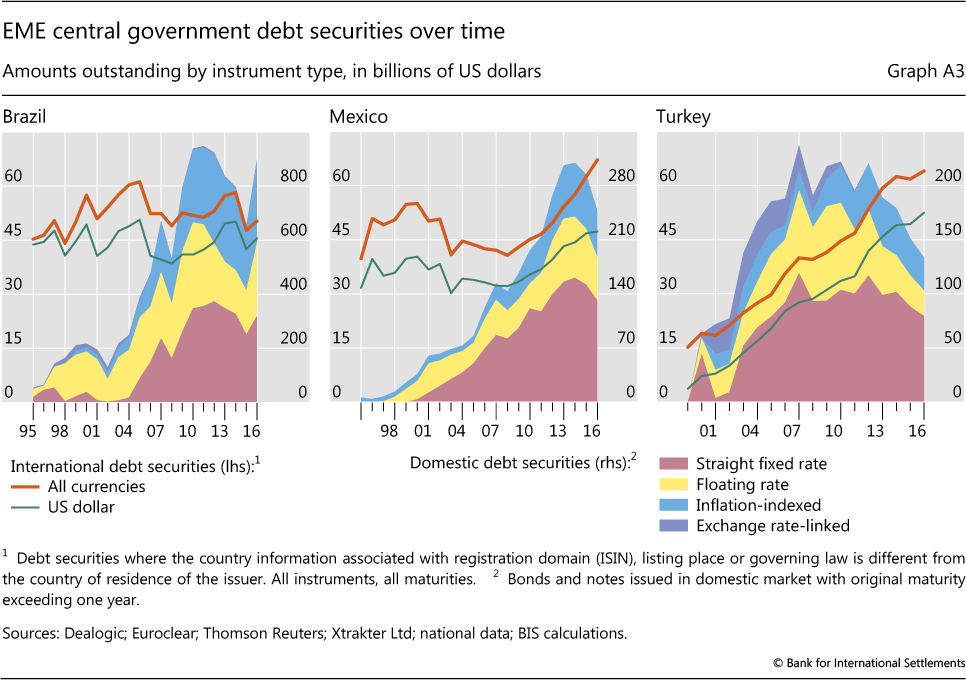
The majority of the debt securities denominated in or linked to a foreign currency were issued internationally. More than 90% of international debt issued by the sampled countries was in US dollars or euros, with the dollar's share rising from 65% at end-2007 to 75% at end-2016. International issues accounted for 35% of total outstanding government debt securities for Saudi Arabia, 32% for Turkey and 30% for Indonesia and Poland. In nominal terms, the leading issuer on international markets is the Mexican central government, with $67 billion outstanding, of which $47 billion is denominated in US dollars, followed by Turkey, with $64 billion, with $53 billion in dollars (Graph A3, centre and right-hand panels).
The share of outstanding domestic government bonds denominated in or linked to a foreign currency is minimal for most jurisdictions (Graph A2). Many countries have reduced such borrowing in recent years. Turkey, for example, used to issue substantial amounts of government debt locally in foreign currency, but had redeemed all of these instruments by the end of 2011 (Graph A3, right-hand panel).
Argentina is an exception to this pattern. It has increased both domestic and international debt issuance linked to or denominated in foreign currency. The Argentine central government has $56 billion of international debt securities outstanding, of which $37 billion is denominated in US dollars. Around 56% of Argentina's outstanding domestically issued central government bonds are denominated in foreign currency, amounting to $41 billion at end-2016. This share has been rising steadily since 2007, when it stood at 28%.
Another notable development in the realm of EME government debt relates to its average maturity, which has risen sharply and for many EMEs is now comparable to that of advanced economies. The average remaining maturity of the sampled EMEs' central government debt securities, 7.7 years, is now only slightly below that of advanced economies, at eight years. The Mexican government has more than doubled the remaining maturity of its domestic debt in the last decade, from around four to eight years. Similar increases also took place in the Philippines and Korea. Among the 23 EMEs sampled by the BIS, South African domestic government debt has the longest remaining maturity at the end of 2016: 16 years. This is considerably longer than in a number of advanced economies - remaining maturity averages 5.7 years for Australia, around 6.5 years for Canada, Germany and Spain, and 5.6 years for the United States - and comparable to the United Kingdom (17.5 years).
Longer maturities have gone hand in hand with greater use of fixed rate instruments (Graph A2). The average share of domestic fixed rate instruments across the sampled EMEs was 75% at end-2016, up from 60% at end-1999. The respective shares for advanced economies were 90% and 94%. Chinese Taipei, Malaysia, Singapore and Thailand issue only straight fixed rate bonds. Chile expanded its share of fixed rate government bonds from zero at the end of 2005 to 11% in 2007 and 40% at the end of 2016. Indonesia increased the share of its outstanding bonds with fixed rates from 20% at end-1999, to 65% in 2007 and to around 94% at end-2016. Almost all of the international issues by the sampled countries were at a fixed rate, with an average remaining maturity of nine years.
There have also been notable changes in the use of inflation-linked debt securities. Some countries have made greater use of this indexation, taking advantage of generally benign inflation conditions. The Brazilian and Mexican governments have been replacing domestic exchange rate-linked and floating rate instruments with fixed rate and inflation-indexed bonds. At end-2016, inflation-indexed bonds accounted for around 34% of domestic Brazilian central government bonds, compared with negligible amounts a couple of decades ago (Graph A3, left-hand panel). A similar shift towards inflation-indexed bonds has happened in advanced economies. In Australia, Canada, Germany, the United Kingdom and the United States, inflation-indexed bonds have accounted for a rising proportion of outstanding government bonds, making up on average around 9% of the outstanding debt stock.
Taken together, these trends should help strengthen public finance sustainability by reducing currency mismatches and rollover risks. The fall in the share of FX-linked debt in the early 2000s may have helped shield EMEs from the global market turbulence of the 2007-09 crisis and its aftermath. Longer maturities and fixed rate debt have also supported the broader expansion and development of capital markets in EMEs: with lengthened government yield curves, other domestic issuers obtain a useful benchmark for their own debt. At the same time, increased duration means that a global rise in bond yields could have a greater impact than previously on the market value of debt, potentially increasing rollover risks and other adverse feedback mechanisms.
For further information, see Committee on the Global Financial System, Financial stability and local currency bond markets, CGFS Papers, no 28, June 2007. Table C2 in the BIS Statistical Bulletin, updated annually by the BIS from national data, provides an overview of the instrument and maturity structure of central government bond markets for a sample of 30 countries, of which 23 are EMEs. See www.bis.org/statistics/c2.pdf. The central government is still the dominant debtor in most countries, accounting on average for 75% of total general government debt at end-2016. But borrowing by other government levels is high in China and India, accounting for around 65% of the total for both countries at end-2015. See B Gruić, M Hattori and H S Shin, "Recent changes in global credit intermediation and potential risks", BIS Quarterly Review, September 2014, pp 17-18.
1 This article was prepared by Iñaki Aldasoro (Inaki.Aldasoro@bis.org) and Torsten Ehlers (Torsten.Ehlers@bis.org). Statistical support was provided by Kristina Bektyakova, Bat-el Berger, Zuzana Filkova and Matthias Loerch.
2 A description of the methodology used to construct the BIS GLIs is available at www.bis.org/statistics/gli/gli_methodology.pdf.
3 International bank credit as used in the BIS GLIs corresponds to the BIS locational banking statistics' definition. International bank credit captures banks' cross-border claims in all currencies and their local claims in foreign currencies, where local claims refer to credit extended by banks' affiliates located in the same country as the borrower. Changes are corrected for exchange rate effects and breaks in series.
4 The BIS defines international debt securities as securities issued by non-residents in all markets. For details, see B Gruić and P Wooldridge, "Enhancements to the BIS debt securities statistics", BIS Quarterly Review, December 2012, pp 63-76.
5 Due to changes in methodology, the amount of total outstanding US dollar credit to EMEs for end-September 2016 was revised downwards. See www.bis.org/statistics/gli/gli_methodology.pdf for additional details.
6 These indicators have often successfully captured financial overheating and signalled banking distress over medium-term horizons in the past. For details on how the thresholds are determined, see the notes to Table 1. For a discussion of the indicators and their interpretation, see "Highlights of global financing flows", BIS Quarterly Review, March 2016, p 28.
7 See "Highlights of global financing flows", BIS Quarterly Review, March 2017, p 20.