Consumption-led expansions
GDP growth has increasingly been led by consumption. However, consumption-led expansions tend to be significantly weaker than when growth is driven by other components of aggregate demand, often because of the build-up of imbalances. We show that while factors such as credit growth and rising house prices can boost consumption in the short run, the incidence of consumption-led growth and rising debt service ratios significantly dampen growth in the medium to long run. Policies that address the build-up of imbalances and strengthen investment are therefore central to fostering durable growth.1
JEL classification: E21, E32, E50, F43, O40.
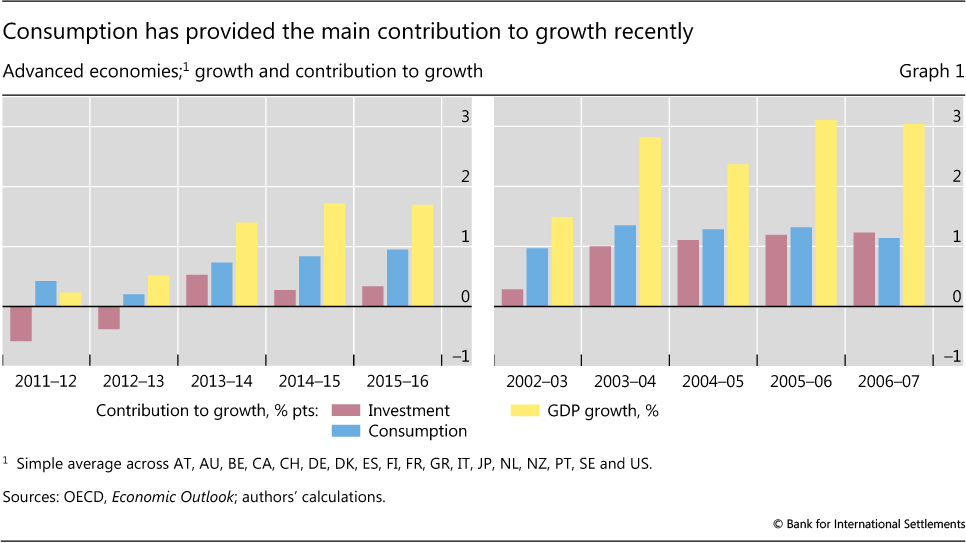
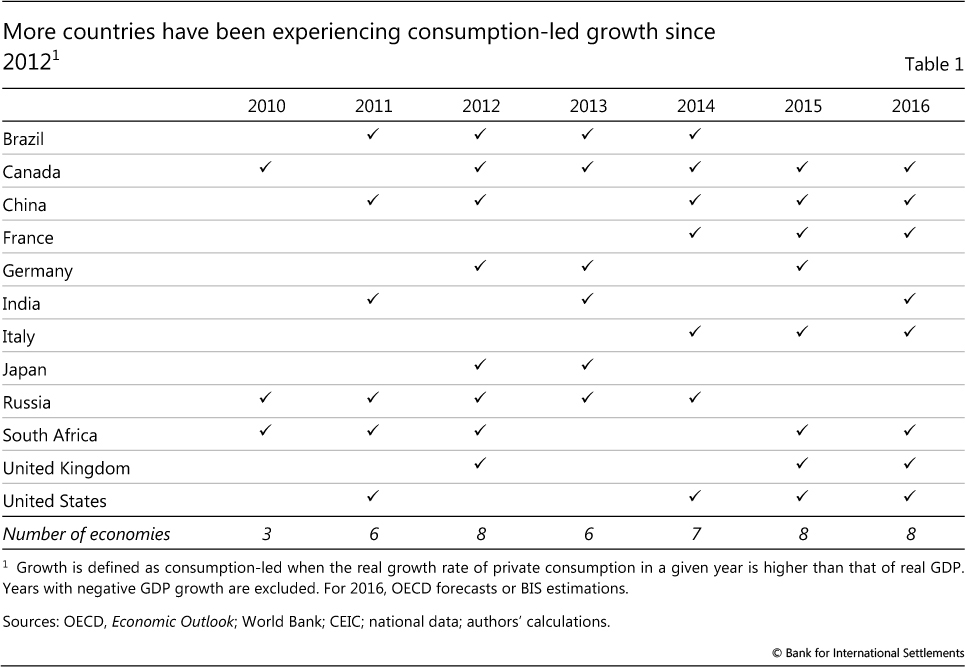
Private consumption has been the key driver of demand growth in the past few years in many economies. In major advanced economies, consumption contributed up to 1 percentage point to GDP growth in 2015-16 (Graph 1, blue bars in left-hand panel). And in the current year, it is expected to remain a key driver of global growth.2 This is also true of several major emerging market economies: for instance, in China the pace of consumption growth has exceeded that of GDP growth over the last three years (Table 1).
Growth patterns in previous expansions were often different. A striking feature of the most recent one is that investment has played a relatively minor role. Indeed, while it turned positive over 2013-14, investment's average contribution to growth was only around 0.3 percentage points over 2015-16, when the recovery was already well under way (Graph 1, red bars in left-hand panel). In contrast, during 2003-07 consumption and investment made very similar contributions (right-hand panel).
The current role of consumption growth raises a number of questions regarding its drivers and macroeconomic implications. What features characterise growth periods when private consumption rather than investment, government consumption or net exports take the lead? How secure are the foundations for sustained growth? This feature seeks to answer these questions.
Overall, our analysis finds that during episodes of consumption-led growth GDP typically expands more slowly while investment and net exports are weak. Moreover, consumption-led expansions tend to be followed by weaker growth, even when controlling for a number of factors. This finding is consistent with the view that a revival of investment is a precondition for a sustainable expansion.
The next section looks at the characteristics of consumption-led expansions, before we turn to their implications for subsequent GDP and consumption growth.
Characteristics of consumption-led growth
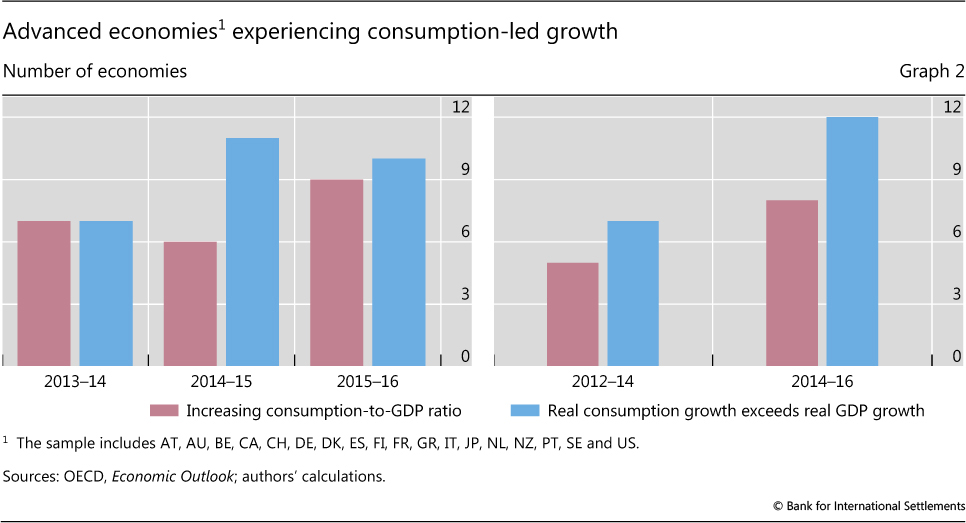
For our analysis, we define periods of consumption-led expansions as periods during which private consumption grows more quickly than GDP, either in nominal terms, so that the consumption-to-GDP ratio increases over time, or in real terms, so that real consumption growth exceeds real GDP growth.3,4
The number of countries experiencing such consumption-led expansions has increased over the last few years. For a sample of 18 advanced economies, it rose from seven in 2013-14 to 10 in 2015-16 (Graph 2, left-hand panel). Taking a somewhat longer time window to compute consumption and GDP growth rates provides a similar result: depending on the specific definition, eight or 12 countries experienced consumption-led growth over 2014-16, while the corresponding figures over 2012-14 were five and seven (right-hand panel).5
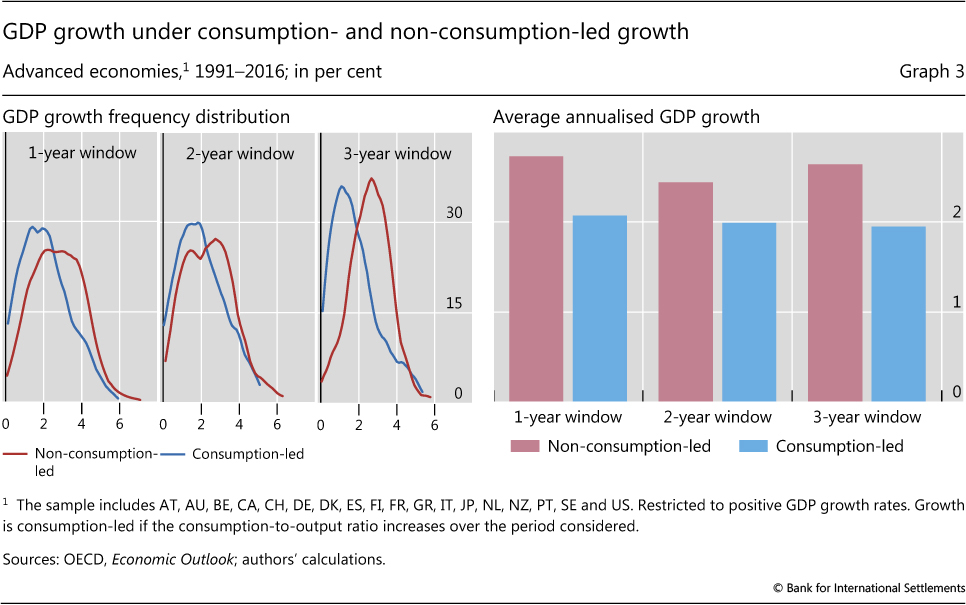
What are the main characteristics of consumption-led expansions? To answer this question, we start by simply comparing output growth across consumption- and non-consumption-led episodes. Specifically, we consider one- to three-year windows and compute the distribution of GDP growth rates for both regimes across our 18 advanced economies since 1991.
Before turning to the main patterns, it is worth recalling two important features of private consumption. First, consumption is the largest component of aggregate demand. For instance, in our sample it accounts for around 56% of GDP. Second, it is much stickier than other demand components.6 Households try to smooth consumption over time, bridging periods of weak income growth or high unemployment by reducing saving. For this reason, recessions or periods of negative GDP growth are likely to witness an increase in the consumption-to-output ratio. Therefore, for the rest of this article we restrict our analysis to positive GDP growth periods so that we can confidently define consumption-led growth as periods of increasing consumption relative to output.
Some general patterns become clear at the outset. First, growth is weaker when it is consumption-led: the left-hand panel of Graph 3 shows that the distribution of GDP growth rates is tilted towards the right for non-consumption-led expansion. This holds whether one considers growth rates over one, two or three years. As noted above, this difference holds when we restrict our attention to periods of positive GDP growth: the difference in average annualised GDP growth is around 0.7 percentage points using a one-year window, 0.5 percentage points using a two-year window and around 0.7 percentage points using a three-year window, with these differences being statistically significant in all three cases (Graph 3, right-hand panel).7
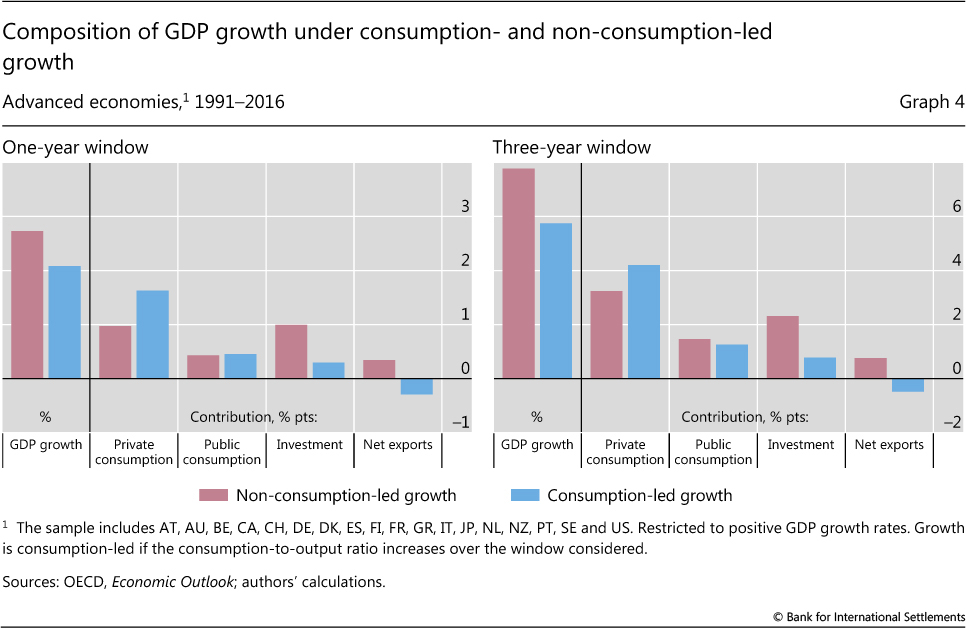
To understand why growth is systematically weaker when it is led by consumption, we decompose GDP by its demand components. As would be expected, consumption tends to contribute more to aggregate GDP growth when it is consumption-led: on average 1.6 percentage points versus 1 percentage point for non-consumption-led expansions (Graph 4, left-hand panel). Over a three-year window, the difference in the consumption contribution is around 1 percentage point, and therefore slightly lower on an annualised basis.
Public sector spending contributes about the same amount to GDP growth across both regimes, suggesting that differences between the two regimes are not related to differences in fiscal policy. Meanwhile, the respective contributions of investment and net exports to growth appear to be much weaker during consumption-led expansions, to an extent that this more than offsets the stronger contribution of private consumption. This finding suggests that the nexus between current consumption and investment is key for understanding the implications of consumption-led expansions.
Implications of consumption-led expansions
The key question in assessing the implications of consumption-led expansions regards causality. Do such episodes cause lower overall GDP growth, or are they the consequence of a lack of growth opportunities? In other words, how secure are the foundations for sustained growth?
Strong consumption growth today could induce subsequent economic weakness through a number of possible mechanisms. First, if increased consumption is financed by debt, this may constrain spending in the future. Recent research (eg Jordà et al (2015) and Lombardi et al (2017)) has found that past credit growth tends to hinder future growth, either because a financial crisis occurs or simply because agents have over-borrowed relative to their repayment capabilities and need to deleverage. It could therefore be that a consumption-led expansion financed through borrowing ends up hurting future demand because households need to devote a larger fraction of their income to debt servicing.
Second, consumption-led growth may be driven by wealth effects, in particular housing wealth effects. When real house prices go up, property owners may decide to consume part of their capital gains, which boosts consumption and hence GDP. Yet if incomes do not grow in line with house prices, or if house price increases reverse, households have to cut back on consumption, thereby lowering GDP growth.
But consumption need not play a causal role. In particular, if there are few growth opportunities, then investment is weak. Weak investment would then be associated with low growth, which would, in turn, show up as consumption-led growth, not least since consumption is stickier than GDP.
We test the relevance of these mechanisms with a simple econometric exercise.8 We estimate the relationship between the number of consumption-led growth years in a given period and the subsequent growth rate of GDP or consumption. The estimated coefficient for the consumption-led growth variable then quantifies the subsequent growth gain/loss in GDP or consumption stemming from an additional year of consumption-led growth. In parallel, we include the aforementioned mechanisms using private credit-to-GDP growth, real house price growth and the debt service ratio to tease out the channels through which consumption-led growth could harm subsequent output and consumption (see the box for details).
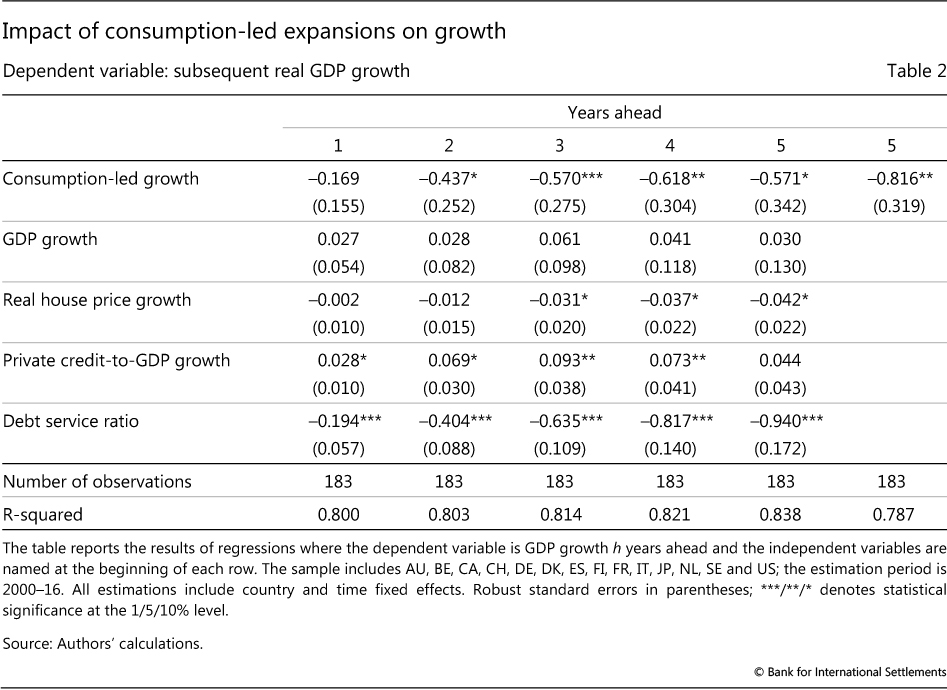
Table 2 presents the estimation results. The first five columns relate to different estimation horizons, h, from one to five years ahead; the sixth column shows results for the estimation horizon h = 5 without any control variables. Three main takeaways can be drawn from this exercise.
First, real house price growth has a weakly significant negative effect on subsequent GDP growth at horizons of three to five years. This is consistent with the view that households need to adjust their consumption downwards after having consumed part of the increase in their housing wealth. Another interpretation is that stronger house price growth, to the extent that it implies pouring more resources into housing, can act as a drag on resources that could be employed in more productive uses.
Estimation of the effects of consumption-led expansions on subsequent GDP and consumption growth
Our econometric specification relates the growth rate of GDP (or the growth rate of private consumption) in country i between year t and t+h, denoted Yt+h,i to:
- A variable counting the number of years of consumption-led growth in country i between year t-3 and t, denoted CLt,i, consumption-led growth years being defined as those over which the consumption-to-output ratio increases.
In addition, we add a number of control variables as follows:
- The growth rate of GDP between year t-3 and t, denoted Yt,i. In this respect, if growth opportunities are correlated over time, having past GDP growth on the right-hand side can capture this autocorrelation in growth opportunities.
- The growth rate of private credit-to-GDP between year t-3 and t, denoted PCt,i.
- The growth rate of real house prices between year t-3 and year t, denoted HPt,i, with real house prices being computed by deflating nominal values with the CPI index.
- The debt service ratio in year t, denoted DSRt,i, defined as the ratio of debt repayments to income.
Focusing on 16 advanced economies using annual data since 2000, we therefore estimate for each horizon h=1,2,-,5 a separate regression following the specification:

where αh,i and αh,t denote country and year fixed effects, respectively; βh, γh, δh, θh and λh are parameters to be estimated and ε is a residual.
Second, past credit-to-GDP growth has a significant and positive effect on subsequent GDP growth at a three- to four-year horizon. Moreover, the debt service ratio has a strongly significant and persistent negative effect on subsequent GDP growth, which seems to last even at a five-year horizon. These two results are consistent with each other. If credit expands more quickly while the repayment burden is stable, then more credit is available to sustain aggregate demand, thereby lifting future GDP growth. Conversely, an increase in the repayment burden for a given credit-to-GDP increase means that the economy faces higher interest rates which ought to weigh on future growth. These results are consistent with a growing body of literature that highlights how credit extension can act as a drag on growth through a higher debt service ratio (Drehmann and Juselius (2012), Dynan (2012), Mian et al (2013), Juselius et al (2016) and Drehmann et al (2017).
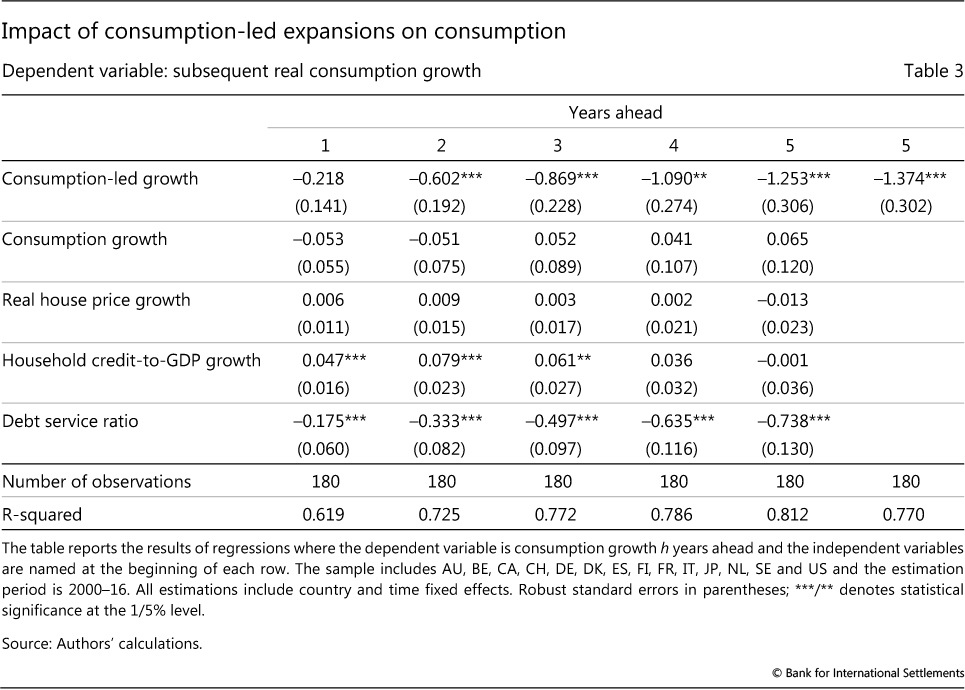
To explore how these variables affect consumption, we carry out a similar exercise using subsequent real consumption growth as a dependent variable. We use the same independent variables as before, but replace past GDP growth with past consumption growth and private credit-to-GDP growth with household credit-to-GDP growth. This way, there is a closer relationship between the left-hand and right-hand side variables.9, 10
Qualitatively, the results are very similar (Table 3). The estimated coefficients for the number of consumption-led expansion years and the debt service ratio are both negative and statistically significant at most horizons. The estimated coefficients are lower (in absolute value) for the debt service ratio variable but larger for the consumption-led growth variable than in the GDP growth regression. Household credit growth also provides a significant boost to consumption over the one- to three-year horizon.
In contrast to the results for GDP growth, however, the other variables (past consumption growth, past real house price growth and past household credit-to-GDP growth) have little explanatory power. This suggests that the debt service ratio and the number of consumption-led growth years are strong determinants of subsequent consumption growth.
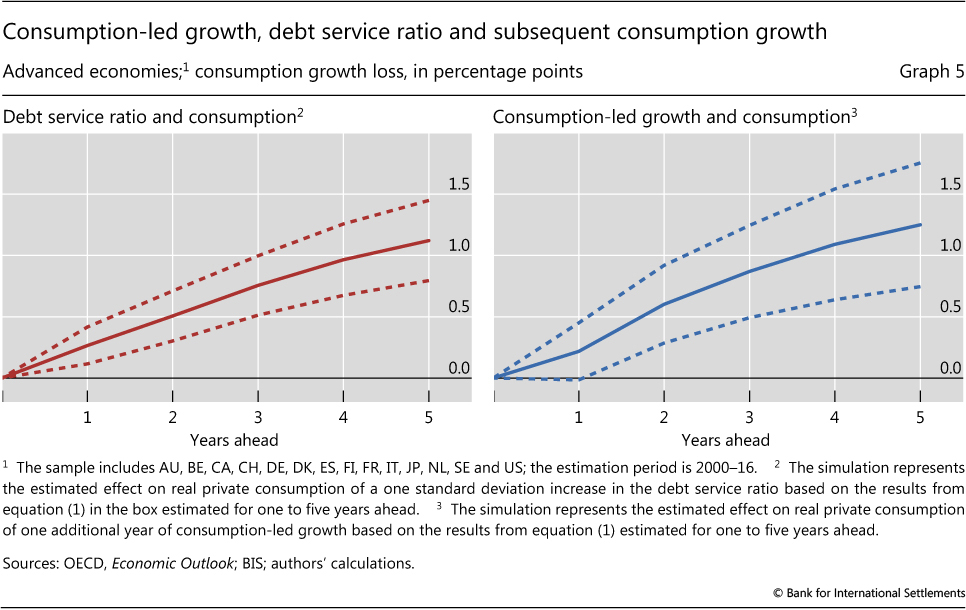
An additional year of consumption-led expansion (Graph 5, right-hand panel) or a one standard deviation increase in the debt service ratio (left-hand panel) have roughly the same estimated effect on consumption growth. In both cases, after five years consumption is between 1 and 1.2 percentage points lower that it would have been otherwise, or 0.2-0.24 percentage points per year.
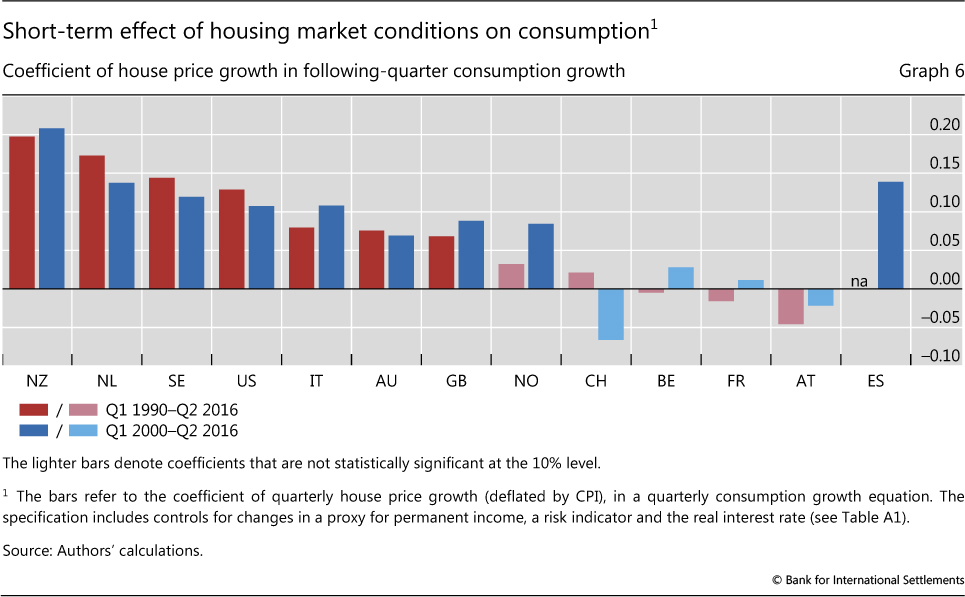
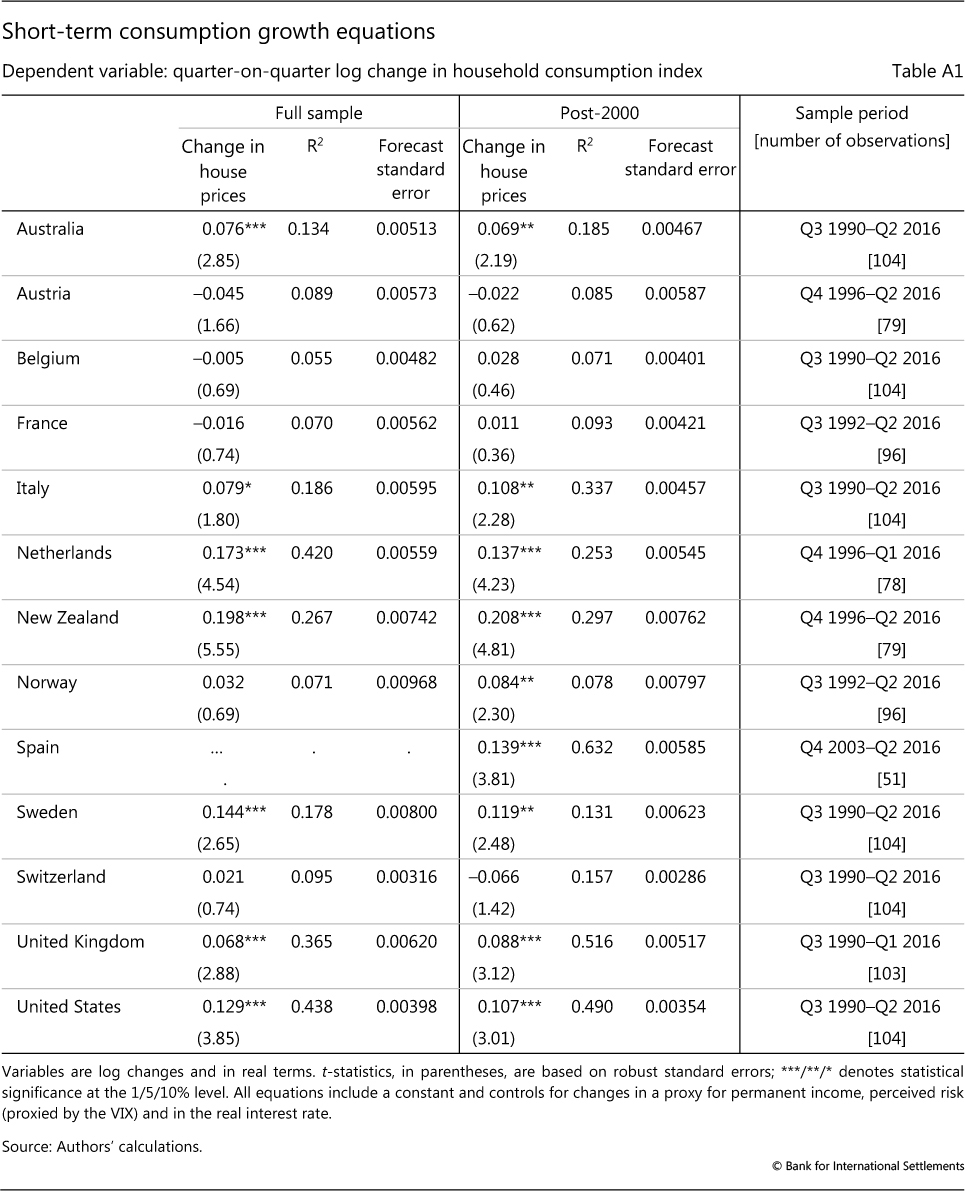
While house prices do not generally have a significant effect on consumption over longer horizons, this is not always the case in the very short run. As one would expect, the effect of housing market conditions on consumption varies considerably across countries and over time. An analysis of the short-term effect confirms this view (Graph 6 and Table A1 in the Annex).11 In nine of 13 countries, information on house price changes in a given quarter improves the prediction of consumption growth in the subsequent quarter in a way that is economically and statistically significant (in the post-2000 sample). The point estimates suggest that it would take an 8% increase in the respective house price indices (in real terms) to boost consumption by about 1 percentage point in the United States. The estimates also suggest that the short-term sensitivity of consumption to house prices has increased in some countries (eg Norway and the United Kingdom).
On the whole, the above association tends to be stronger in countries where mortgage refinancing and home equity extraction is more prevalent. Rising house prices may enable homeowners to take out larger loans, as the value of pledgeable collateral rises.12 These loans may take the form of consumption or re-mortgaging lending (from which part of the gains may be consumed). Rising house prices also increase homeowners' net wealth, which may explain higher consumption. These channels tend to be stronger in the aggregate whenever the share of homeowners in the population is large. Indeed, there is a positive cross-country correlation (0.53) between the house price elasticity of short-run consumption and the home ownership rate.13
In contrast, when housing is obtained mostly through rental agreements, house prices are less likely to have first-order effects on aggregate consumption. Indeed, in several countries in continental Europe, the link between house prices and household consumption is not as evident. This is partly due to weaker incentives for households to take on leverage, which translate into low home ownership.14
The very short-term growth rate of consumption in several economies is affected by past house price developments, and house prices thus can be an important channel of monetary policy transmission. In the medium to long run, however, house price effects on consumption are typically superseded by the dynamics of the debt service ratio and investment.
Conclusion
All in all, the evidence suggests that the composition of growth matters for medium-term growth prospects. We find that increasing shares of private consumption in GDP can be a leading indicator of future growth slowdowns, particularly if consumption-led expansions come on the back of growing imbalances and rising debt burdens. High household debt service ratios tend to become a potent drag on economic growth, frequently leading to costly deleveraging processes.
The increasing prevalence of consumption-led growth since 2012 therefore presents new challenges for policymakers in several economies. Policies that address the build-up of imbalances and strengthen investment are thus central in fostering sustainable growth.
References
Aron, J, J Duca, J Muellbauer and K Murata (2012): "Credit, housing collateral, and consumption: evidence from Japan, the U.K. and the U.S.", Review of Income and Wealth, vol 58, no 3, pp 397- 423.
Campbell, J and J Cocco (2007): "How do house prices affect consumption? Evidence from micro data", Journal of Monetary Economics, vol 54, pp 591-621.
Drehmann, M and M Juselius (2012): "Do debt service costs affect macroeconomic and financial stability?", BIS Quarterly Review, September, pp 21-35.
Drehmann, M, M Juselius and A Korinek (2017): "Debt service: the painful legacy of credit booms", mimeo.
Dynan, K (2012): "Is household debt overhang holding back consumption?", Brookings Papers on Economic Activity, spring, pp 299-362.
Jordà, O, M Schularick and A Taylor (2015): "Betting the house", Journal of International Economics, vol 96, PP S2-S18.
Juselius, M, C Borio, P Disyatat and M Drehmann (2016): "Monetary policy, the financial cycle and ultra-low interest rates", BIS Working Papers, no 569, July.
Lombardi, M, M Mohanty and I Shim (2017): "The real effects of household debt in the short and long run", BIS Working Papers, no 607, January.
Mian, A, K Rao and A Sufi (2013): "Household balance sheets, consumption and the economic slump", Quarterly Journal of Economics, vol 128, pp 1687-726.
Muellbauer, J (2016): "Macroeconomics and consumption", CEPR Discussion Paper, no 11588.
Scatigna, M, R Szemere and K Tsatsaronis (2014): "Residential property prices statistics across the globe", BIS Quarterly Review, September, pp 61- 76.
Schneider, M and K Wagner (2015): "Housing markets in Austria, Germany and Switzerland", Oesterreichische Nationalbank, Monetary Policy & the Economy, Q1-15, pp 42-59.
Tsatsaronis, K and H Zhu (2004): "What drives housing price dynamics: cross-country evidence", BIS Quarterly Review, March, pp 65- 78.
Annex
1 This article expresses the views of the authors and not necessarily those of the BIS. We gratefully acknowledge contributions and comments by Claudio Borio, Ben Cohen, Dietrich Domanski, Dubravko Mihaljek and Hyun Song Shin, and research assistance from Emese Kuruc.
2 The latest OECD, IMF and Consensus forecasts, for instance, suggest that private consumption growth will continue to exceed overall output growth in the United States in 2017.
3 The leading driver of GDP growth is usually defined as either the component that makes the largest contribution to GDP growth or the one growing faster than GDP. But if all GDP components grow at the same rate, the largest contribution will simply be that of the largest component. In other words, a drawback of focusing on growth contributions is that a large share in GDP could compensate for the low growth rate of a given component. The second definition also has its drawbacks. First, there may be more than one component growing faster than GDP, making it difficult to say which is leading growth. Second, growth rates often reflect the cyclical properties of demand components. For instance, investment is more cyclical than GDP, while private consumption is less so, implying that investment-led growth could be observed more often when the economy is growing quickly, and consumption-led when the economy is growing slowly. However, these two issues can easily be addressed. First, in advanced economies consumption is by far the largest component of GDP. Hence, when consumption grows faster than GDP, it also tends to have the largest contribution. Second, focusing on periods with positive GDP growth significantly alleviates the problem due to differences in GDP components' cyclical properties.
4 The private consumption deflator tends to grow more slowly than the GDP deflator. As a result, real consumption can grow more quickly than real GDP even if the consumption-to-GDP ratio - which is computed using nominal values- is not necessarily increasing. Graph 2 therefore presents evidence using both alternative definitions. But the rest of the analysis focuses on consumption-led growth as periods of increasing consumption-to-output ratios, arguably a more restrictive definition.
5 The numbers in the right-hand panel of Graph 2 are based on two-year windows.
6 Private consumption growth also tends to be stickier than total GDP growth, as the standard deviation of the former is 1.8%, versus 2.1% for the latter.
7 Consumption being stickier than output, the consumption-to-output ratio tends to rise during recessions, ie episodes of negative GDP growth, while investment drops faster than GDP. This holds irrespective of the length of the window used to compute growth rates.
8 Overall, we find that increases in the private consumption-to-GDP ratio tend to act as a drag on subsequent growth, rather than the long-term level of this ratio in any given country. We leave it to future research to determine which factors explain the substantial cross-country heterogeneity in this ratio.
9 Unfortunately, due to data limitations we cannot use the household sector debt service ratio, which forces us to use the economy-wide debt service ratio.
10 Adding household income growth to the specification does not change the results significantly, either qualitatively or quantitatively.
11 Control variables in these regressions include a proxy for changes in permanent income, where permanent income is computed by extrapolating the growth rate of income over the previous eight years (ie the moving average) into the future and applying a fixed discount rate of 5% (as in Aron et al (2012)). See also Muellbauer (2016).
12 See Tsatsaronis and Zhu (2004), Scatigna et al (2014), BIS (2015) and Jordà et al (2015).
13 While further refinement by the use of detailed micro-data analysis of this link is beyond the scope of this feature, several papers in the literature find confirmation of such channels. Campbell and Cocco (2007), for instance, find significant effects of house prices in the United States on the consumption of homeowners, but not of renters.
14 In this regard, Schneider and Wagner (2015) document how the tax systems of Austria and Germany tend to favour renting over owning.