Dissonant markets?
Central banks reasserted their sway over financial markets in recent months, after two quarters punctuated by bouts of sharp volatility. Markets proved resilient to a number of potentially disruptive political developments. Nevertheless, questions lingered as to whether the configuration of asset prices accurately reflected the underlying risks.
With global growth showing moderate but persistent signs of strengthening and supportive monetary policy, investors' risk appetite seemed to return during the period under review. As a result, volatility in financial markets subsided, commodity prices edged higher, corporate credit spreads narrowed, stock markets rallied and portfolio flows to emerging market economies (EMEs) resumed. At the same time, yields in core fixed income markets plumbed new depths, and the pool of government debt trading at negative yields grew further to briefly exceed $10 trillion in July. As the summer went on, negative yields percolated to the high-grade corporate bond market, particularly in the euro area. The apparent dissonance between record low bond yields, on the one hand, and sharply higher stock prices with subdued volatility, on the other, cast a pall over such valuations. Banks' depressed equity prices and budding signs of tension in bank funding markets added another sobering note.
The outcome of the United Kingdom's referendum on European Union membership took many observers by surprise and caused a stir during a few trading days. But its impact soon subsided. Central banks' response, and investors' perception that an extended period of easy monetary policy would still lie ahead, appeared to play a soothing role.
Brexit: beyond the market response
The week preceding the 23 June referendum on the United Kingdom's membership in the European Union saw a wave of optimism that drove asset prices higher. UK and continental European stocks recorded large gains during that week, but valuations rallied across many jurisdictions. Corporate spreads tightened (especially in the high-yield space) and sterling appreciated 5% against the US dollar, briefly touching its high for the year (Graph 1, red bars in both panels).
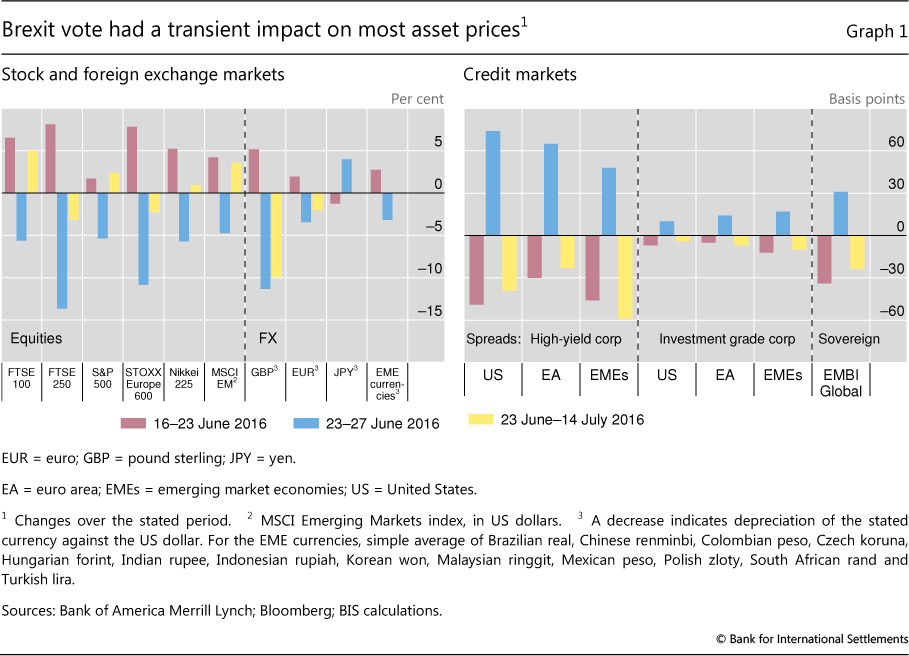
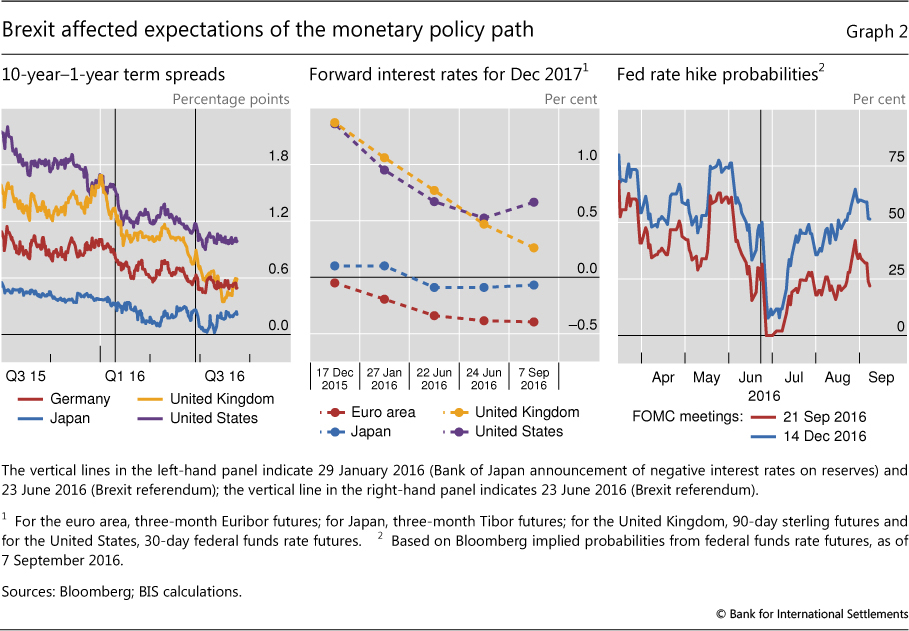
The outcome of the vote took markets by surprise, triggering a swift repricing. Within the two trading days that followed, major stock indices in advanced economies (AEs) plummeted more than 5%, with the FTSE 250 shedding almost 15%. During the same time period, sterling nosedived by 10% and the US dollar appreciated across the board, except against the yen (Graph 1, blue bars in left-hand panel). Term spreads flattened in core bond markets with the 10-year-one-year gilt spread dropping almost 20 basis points (Graph 2, left-hand panel). Corporate high-yield spreads in the United States and the euro area widened by about 70 basis points, and investment grade spreads increased more than they had fallen the week before (Graph 1, blue bars in right-hand panel). EME benchmarks recorded more moderate swings, but followed basically the same path.
Despite the sharpness of the initial reaction, market conditions remained orderly, trading volume was high and valuations soon recovered. Central banks promptly announced their readiness to provide liquidity and ensure the proper functioning of markets.1 Even during the plunge, market liquidity was adequate, not least in fixed income trading (Box A). Sentiment turned around the following week, and by mid-July, most asset classes had surpassed their 23 June closing prices. Even the FTSE 100, which includes UK companies with the largest exposure to foreign demand, closed 5% above its pre-referendum levels, buoyed by sterling's persistent depreciation.2 That said, assets more closely related to the United Kingdom and Europe remained weaker. Sterling, the FTSE 250 (whose members tend to have a larger share of domestic revenue than the FTSE 100), European stocks and the euro remained below their immediate pre-referendum valuations (Graph 1, yellow bars).
Box A
Fixed income market liquidity in the wake of Brexit
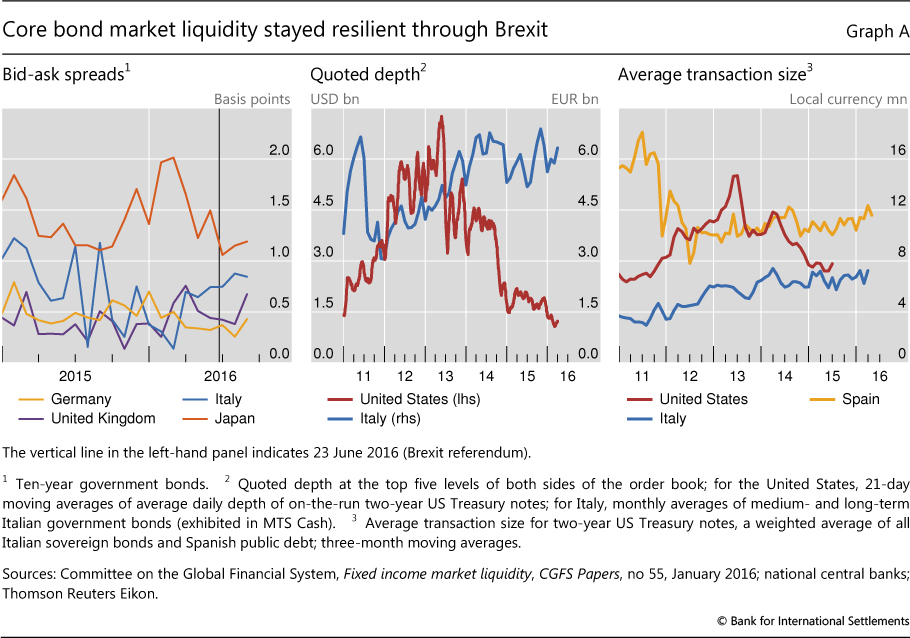
Before the UK referendum, many observers voiced concerns about whether markets would be resilient to an unexpected outcome. After the event, in core fixed income markets, and indeed most other markets, it was evident that the system was able to smoothly absorb the brief turbulence that followed (Graph A, left-hand panel). Markets went through the Brexit vote with little or no disruption to functioning. But questions about their underlying resilience remain.
Market liquidity can be defined as "the ability to rapidly execute large financial transactions at low cost with limited price impact". As market-based finance gains importance in financial systems worldwide, market liquidity has become increasingly relevant to financial stability. This is especially true in the case of core fixed income instruments, which perform critical roles as investments, collateral and pricing benchmarks.
Taking a longer perspective, most indicators do not show a significant structural decline of liquidity in financial markets in recent years. For instance, bid-ask spreads have been stable and tight in major sovereign bond markets (Graph A, left-hand panel). While quoted depth and average transaction size have declined in some markets, in most cases they are not unusually low by historical standards (Graph A, centre and right-hand panels).
That said, financial markets have experienced a number of intense and short-lived episodes of stress in the last few years, such as the "flash rally" in US Treasury bonds on 15 October 2014 and the turbulence in the German bund market in May-June 2015. Although the explanations for these sudden changes in market conditions vary, the increased reliance of market participants on electronic trading platforms and the proliferation of trading algorithms in a number of key fixed income markets are likely to have been major factors. While the "electronification" of fixed income markets has contributed to reducing trading costs and improving liquidity in normal conditions, the spread of complex and often opaque trading strategies has raised concerns about potential implications for market stability in times of stress.
Committee on the Global Financial System, Fixed income market liquidity, CGFS Papers, no 55, January 2016.
The Brexit vote triggered a broad-based reassessment of the future path of monetary policy globally. With improving headline growth still perceived as fragile in most AEs, and inflation persistently low, the additional uncertainty created by Brexit was seen as eliciting a distinct response from major central banks: policy rates would stay "lower for longer".
In the aftermath of the vote, markets expected the Bank of England to keep the policy rate unchanged at least through December 2017 (Graph 2, centre panel). However, on 4 August the central bank cut the policy rate by 25 basis points (it is now 0.25%), and expanded the government bond purchase scheme by £60 billion, bringing the total to £435 billion. It also established a new corporate bond purchase programme of £10 billion, and launched a new Term Funding Scheme that will provide funding for banks at rates close to the monetary policy rate. Forward interest rates for December 2017 quickly dropped to the new level of the policy rate, reflecting the view that a quick policy reversal was not expected.
Immediately after the vote, financial markets anticipated that the Federal Reserve would push the resumption of its hiking cycle further into the future (Graph 2, right-hand panel). Questions about the path of policy rates were compounded by the ongoing debate among economists about the apparent decline in the neutral interest rate in the United States and elsewhere.3 Given these short- and long-term considerations, the path towards "normalisation" looked more protracted and shallower than anticipated. In late July, on strong data releases about the US economy, markets adjusted their expectations about the timing of future rises in the federal funds rate (Graph 2, right-hand panel), but forward interest rates still pointed towards at most one increase through the end of 2017 (Graph 2, centre panel).
In the euro area and Japan, Brexit featured prominently among the risks to the economic outlook cited by central banks. On 21 July, the ECB reaffirmed its expectation that its key interest rates would stay at current or lower levels for an extended period of time, and well past the horizon of the asset purchase programme. Moreover, the bank stressed that this programme, provisionally scheduled to end in March 2017, could be extended until the Governing Council saw a sustained adjustment in the inflation path consistent with its target. On 29 July, the Bank of Japan announced extensions to its outstanding qualitative and quantitative easing (QQE) programme: it doubled the yearly pace of acquisition of exchange-traded funds (ETFs) to ¥6 trillion - equivalent to almost 8% of its flagship Japanese government bond (JGB) purchasing programme. Moreover, it announced additional measures aimed at alleviating growing tensions in the US dollar funding markets for Japanese banks (see below).4 Separately, the Japanese government bolstered its fiscal expansion plans.
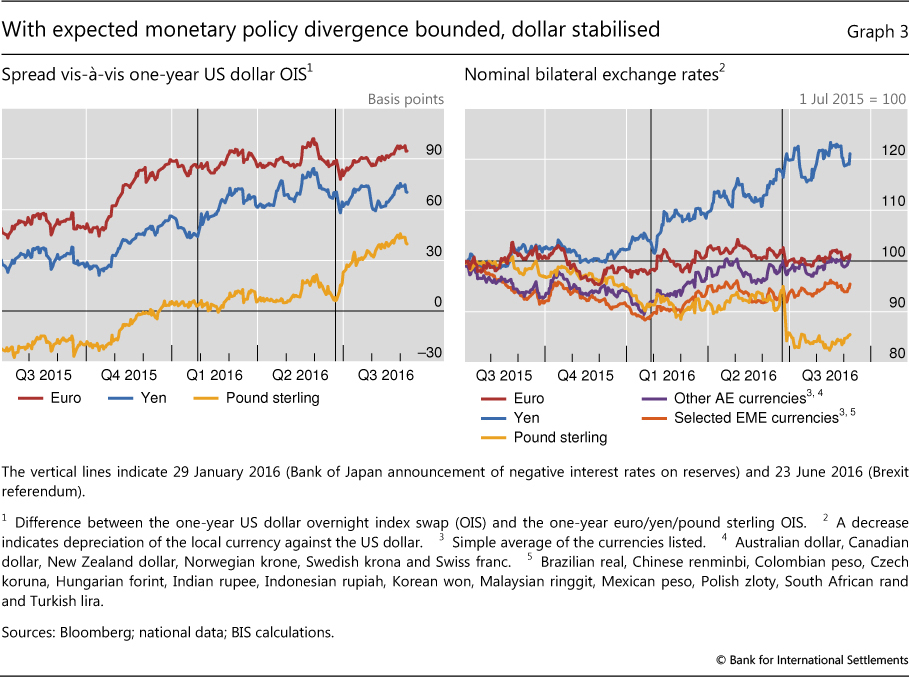
During the period under review, the scope of expected monetary policy divergence between the United States, on the one hand, and the euro area and Japan, on the other, did not change much in markets' view (Graph 3, left-hand panel). Against this backdrop, the US dollar traded sideways against the euro and yen, and in fact most other currencies, after the initial reaction to Brexit (right-hand panel). The main outlier was sterling, which depreciated sharply after the referendum, while investors priced in a wider medium-term policy divergence between the United Kingdom and the United States (left-hand panel).
Central banks in other jurisdictions also followed an easing path. Most policy changes following the referendum resulted in an easing of policy, with Brexit or challenging global conditions often mentioned as the motivation. The only exceptions were some central banks in Latin America from large commodity producers, which increased rates in order to stabilise foreign exchange markets and contain inflationary pressures.
Core fixed income yields under pressure
As the perception of reinforced monetary accommodation took hold, yields in core fixed income markets stayed under pressure. Conservative estimates of the amount of government bonds trading at negative yields surpassed $10 trillion within days after Brexit (Graph 4, top left-hand panel).5 Negative yields gradually spread to investment grade corporate bonds in AEs. By late August, some market sources reckoned that up to 30% of the euro area high-grade corporate fixed income market was trading at negative yields. In July, the German treasury was able to publicly place 10-year bunds at negative yields (-0.05%) for the first time ever. In the gilt market, Bank of England purchases, combined with institutional investors' initial reluctance to sell, drove yields to their historical troughs. By early September, maturities close to 10 years had notched up capital gains of almost 6% since the referendum. Some longer-dated gilts have seen price returns in excess of 20%. Thanks to capital gains from falling yields, returns in core fixed income markets this year have rivalled those of equity markets (Graph 4, top right-hand panel).
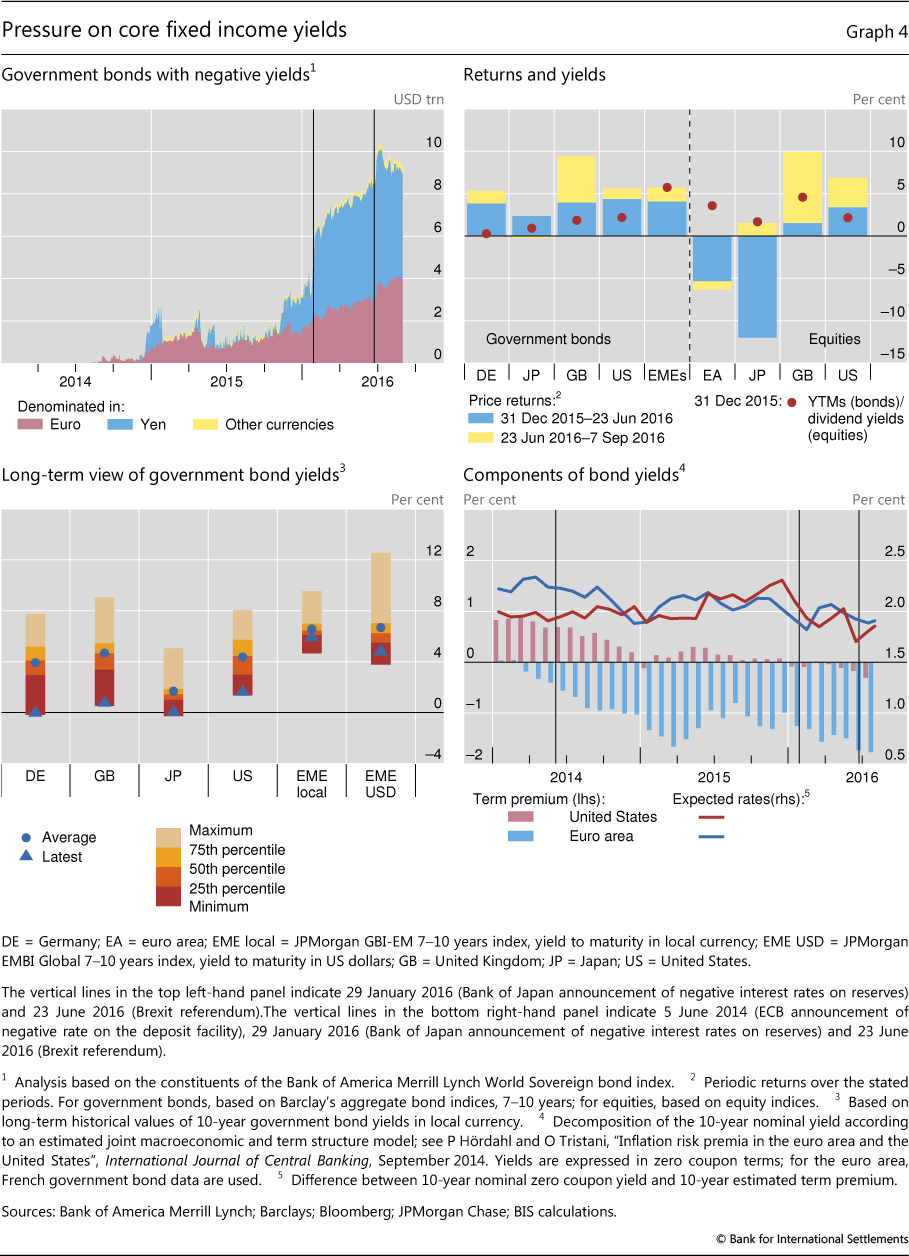
As a result, core bond yields continued to probe historical lows. The near zero short-term interest rates in the United States and the United Kingdom represented post-Great Depression troughs, while short-term rates in Germany and Japan reached unprecedented negative levels over the summer. The nominal yields of bonds with tenors close to 10 years were also at long-term lows in these countries as of the beginning of September (Graph 4, bottom left-hand panel).
In this context, some observers wondered whether core fixed income markets might be overvalued. Defining overvaluation for government bonds is not straightforward, but a comparison with nominal GDP growth suggests that yields are on the low side. Over the past 65 years, 10-year bond yields have tracked fairly well the broad trends in nominal GDP growth across the United States, Germany, Japan and the United Kingdom. Presumably, real bond yields and expected inflation components of nominal yields have tracked developments in real GDP growth and inflation, respectively. For some time now, nominal bond yields have been well below nominal GDP growth in all four countries.6
These historically low bond yields have coincided with low estimated term premia. The compression of term premia appears to have accelerated after the adoption of negative interest rates, first in the euro area, then in Japan. This compression seems to have been exacerbated by Brexit (Graph 4, bottom right-hand panel). Expectations of future interest rates have also played a role. As investors reassessed the likelihood for continued monetary accommodation in the largest currencies, nominal yields were pushed downwards (same panel). While this is especially true in the case of the United States, where a quicker expected pace of normalisation was partly reversed in early 2016, the expectations component played a smaller role in the euro area.
Exuberance prevails in other financial markets
While yields in core fixed income markets were reaching record lows further out the maturity curve, which would normally be associated with expectations of subdued growth, stock markets and other market segments showed renewed ebullience, highlighting the sense of dissonance.
Markets had already started a recovery, after a rocky start to the year. The turnaround can be dated to the weeks between the Bank of Japan's adoption of negative interest rates on 29 January and the ECB's announcement of additional expansion on 10 March. In July and August, as Brexit receded in the financial markets' rear-view mirror, exuberance resumed in full force. By mid-July, despite flagging earnings, stock markets in the US had broken through all-time highs (Graph 5, left-hand and centre panels). Following a slump in the second quarter, equity prices in EMEs also bounced back and returned to levels last seen a year earlier. European and Japanese valuations were more tentative, as they wrestled with their own idiosyncratic uncertainties.
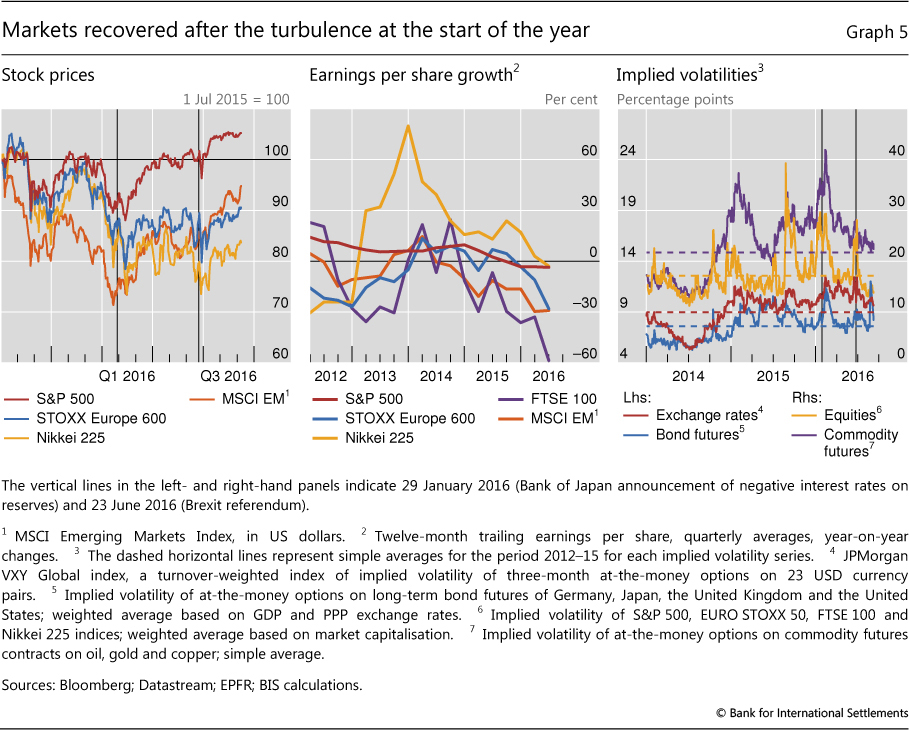
Implied volatilities trended down towards, or below, post-crisis averages (Graph 5, right-hand panel). Stock market volatility quickly approached the lows last seen in July 2014. Volatilities in other markets were less subdued, fluctuating around their recent averages and still far from 2014 depths. Brexit briefly boosted volatilities, but its impact was as transient as on prices. High valuations across most asset classes may have helped keep volatilities low.7
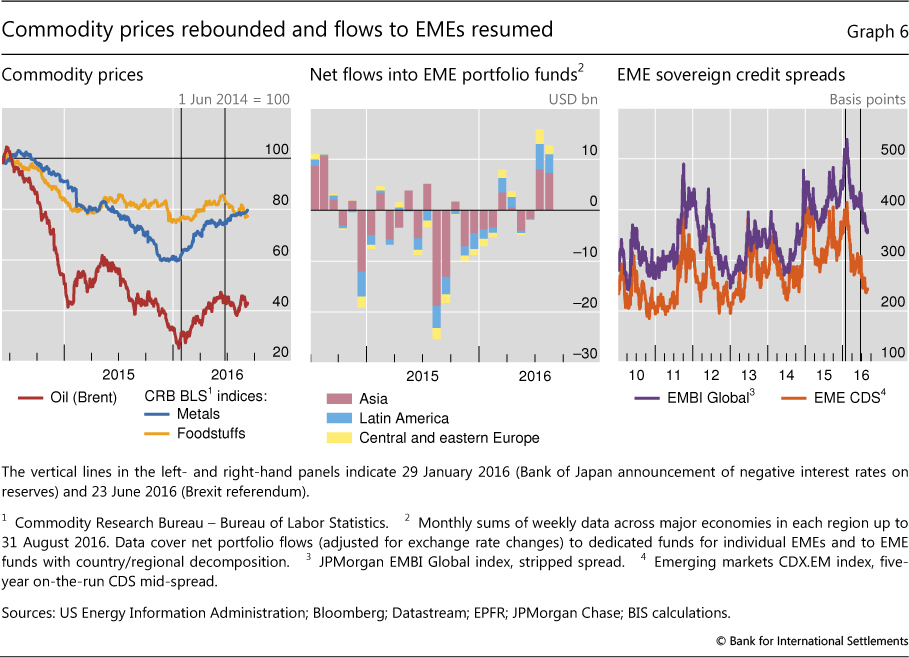
A traditional search for yield seemed to be driving developments in EME fixed income markets, supported by signs of an improving macroeconomic outlook. As commodity prices recovered from their early 2016 lows (Graph 6, left-hand panel), strong capital inflows to EMEs resumed (centre panel). While commodity prices were still far from the high levels observed before mid-2014, the mild recovery helped to assuage concerns about the growth prospects for several large EMEs, especially in Latin America. More generally, there was an increasing perception that growth rates in EMEs had bottomed out. Sovereign and CDS spreads narrowed by 45 basis points after 23 June, and more than 150 basis points since late January (right-hand panel).
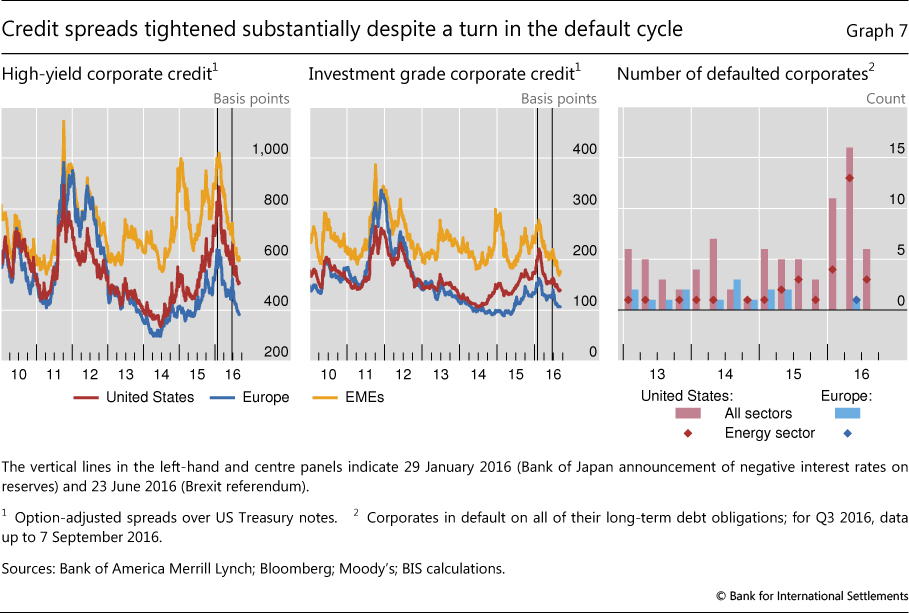
Conditions in private sector credit markets also eased significantly. Credit spreads in European and EME high-yield and investment grade corporates narrowed to levels not observed since early 2015 (Graph 7, left-hand and centre panels). US corporate spreads fell proportionally less, possibly hampered by the large oil sector exposure and continued signs of a turn in the default cycle (Graph 7, right-hand panel). The Bank of Japan's decision in January to implement a negative interest rate appears to have been a key turning point in these markets. The persistent gap between credit spreads denominated in US dollars and euros was reinforced by changes to the ECB asset purchase programme.8 This encouraged the issuance of euro-denominated debt by US companies, whose subsequent swapping into US dollars has contributed to a widening of the cross-currency basis since 2014.9
Bank valuations struggle
While equity markets in some jurisdictions were visiting new highs over the summer, banks' stocks headed down further and money markets displayed signs of tension, adding yet another dissonant note. Even though banks' debt-related instruments appeared to benefit from the global hunt for yield, their price-to-book ratios remained at the lower end of the post-Great Financial Crisis (GFC) range. Questions lingered about banks' ability to deliver adequate earnings in a context of compressed term premia and slow growth, especially in Japan and the euro area. Low and negative rates also presented banks with challenging trade-offs (Box B).
Box B
Negative rates and bank business models
Low profitability has challenged banks' traditional business models in the current environment of persistently low interest rates and compressed term premia.
Market valuations indicate that investors remain sceptical of banks' ability to generate earnings in a low-rate, low-growth environment. Bank return-on-equity ratios have never recovered to the levels observed before the GFC, though they exhibit significant differences across jurisdictions (Graph B, left-hand panel). Flattening yield curves and low long-term rates are among the factors that markets are weighing more closely as they ask whether, and how, banks' profitability can recover.
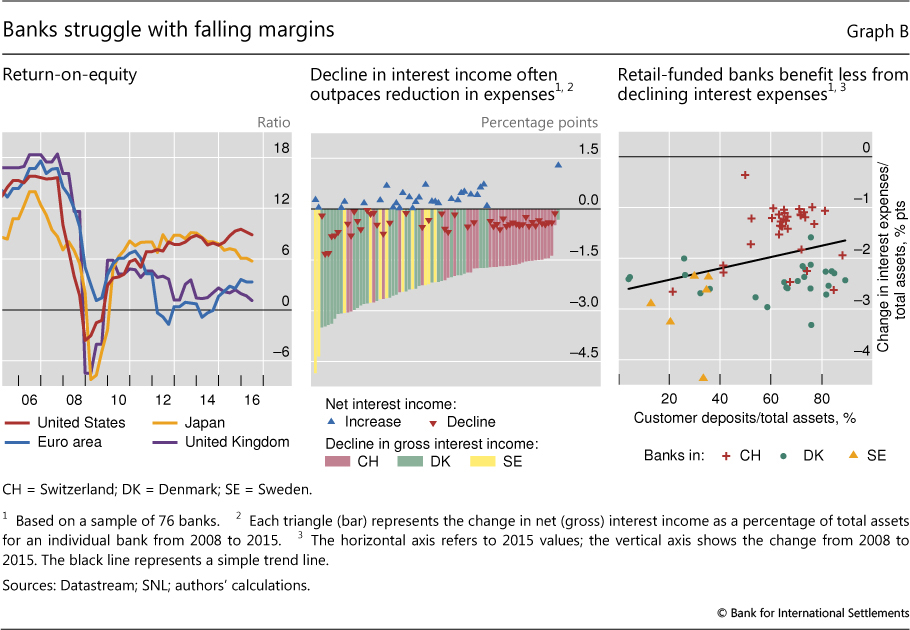
Profitability has been constrained by flatter yield curves. Long-term rates have fallen, especially where investors have expected low short-term rates to prevail for longer and central banks have engaged in large-scale asset purchases to compress term premia. A decline in the level of interest rates can improve banks' net income in the short run, as their portfolios of securities benefit from one-off capital gains, and also if funding for the banks becomes cheaper. However, in the long run the flattening of the curve can drive down returns from maturity transformation and compress net interest margins.
Furthermore, as interest rates decline and move into negative territory, repricing banks' liabilities in lockstep with assets in order to protect margins will become increasingly difficult. Banks appear reluctant to pass negative short-term rates to depositors. Thus, pressures on net interest margins are particularly pronounced in countries with negative interest rates. For example, many banks in Denmark, Sweden and Switzerland have seen the compression in gross interest income (bars in Graph B, centre panel) outpacing the reduction in interest expenses, resulting in declining net interest margins (triangles in same panel) over recent years. A critical issue in this context is the extent to which banks' liabilities are tilted in the direction of retail deposits and similar funding sources (right-hand panel).
Ultimately, country-specific factors will dictate whether and how banks can compensate for lower net interest margins. Stronger economies will allow banks to expand the volume of their traditional lending activities. Some banks may be able to compensate for part of their lost revenues by relying on alternative sources of income such as trading and fee-generating services, while others may be able to reap efficiency gains, for example by addressing overcapacity or by bringing down cost-to-income ratios.
The reported return-on-equity ratios are unadjusted for risk. See C Borio, L Gambacorta and B Hofmann, "The influence of monetary policy on bank profitability", BIS Working Papers, no 514, 2015; and BIS, 86th Annual Report, 2016, Chapter VI.
Expectations of sluggish AE growth and the uncertainty generated by the outcome of the UK referendum drove bank stocks down in June. The EURO STOXX Banks index plunged 18% the day following the vote, its worst fall ever (Graph 8, left-hand panel). The rising uncertainty put the spotlight on persistent questions about the condition of banks in continental Europe, with the main German bank stocks suffering double-digit losses and stocks of Italian and Spanish banks sinking to new lows. UK banks were also hit, as the outlook for the domestic economy worsened and a rethinking of business models became more pressing. The main UK lenders recorded sizeable stock price drops following the referendum results, in most cases in excess of 15%.
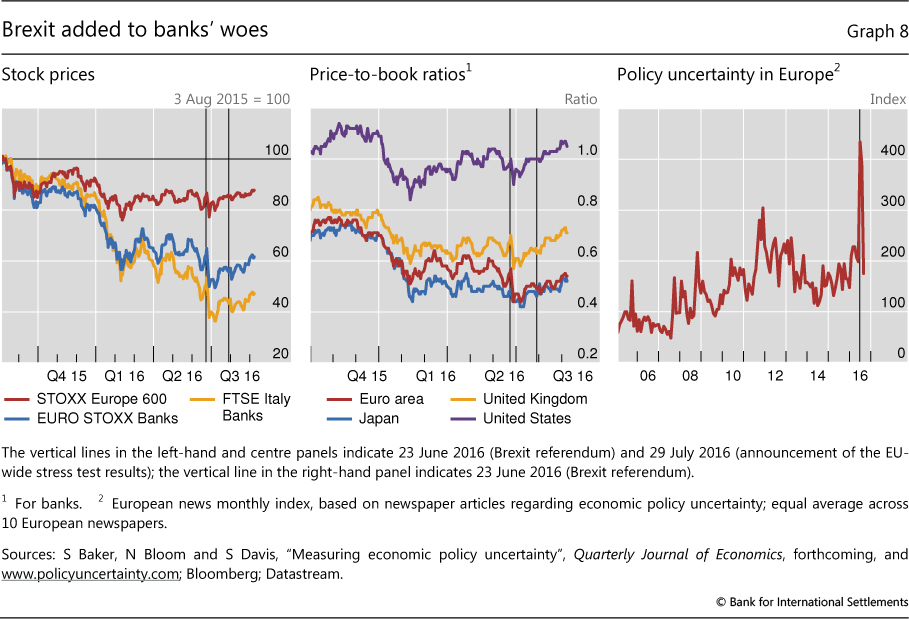
After this initial phase, however, bank equity valuations rebounded to different degrees across countries. The stimulus package announced by the Bank of England on 4 August allowed UK bank stocks to regain some ground, though they still traded at a fraction of their book value. Overall, the fall in the main UK and US bank equity indices proved to be short-lived, and stock prices soon reverted to their pre-referendum levels. By contrast, the EURO STOXX Banks index was slower in regaining momentum. In early September stocks of euro area lenders were trading at less than 50% of their book values, pointing to increasing concerns about their ability to generate profits in a low-rate, low-growth environment (Graph 8, centre panel). While the increase in implied volatilities in the aftermath of the referendum was moderate, policy uncertainty in Europe became quite high. One index of uncertainty10 in particular reached unprecedented levels in June (Graph 8, right-hand panel).
The low price-to-book ratios in the banking industry appear especially striking when compared to the relatively high valuations of broader equity benchmarks. In contrast to banks, low real interest rates tend to benefit non-financial corporations (NFCs), by reducing their net interest expenses and lowering the discount factors on their future earnings. Equity valuations for NFCs have also been boosted by share repurchases, which in the US increased by about 43% between 2011 and 2015
The results of the 2016 European Banking Authority (EBA) stress tests, released on 29 July, failed to reassure equity investors. The EBA found that only one (Monte dei Paschi di Siena) of the 51 banks under examination would default in the hypothesised adverse scenario. However, the published results implied that five banks would fall short of the Basel III 7% Common Equity Tier 1 (CET1) requirement and two thirds of the banks would end up with a CET1 ratio below 10%.
The release of the stress test results did not have a long-lasting impact on markets, as the outcomes were, in most cases, aligned with investors' initial expectations. Bank stocks fell sharply when the results were released, but soon rebounded to pre-stress test levels. By comparison, previous tests had sometimes had a more sizeable and long-lasting effect on market valuations, whether positive (as in the case of the 2010 exercise) or negative (as in 2014; Graph 9, left-hand panel).
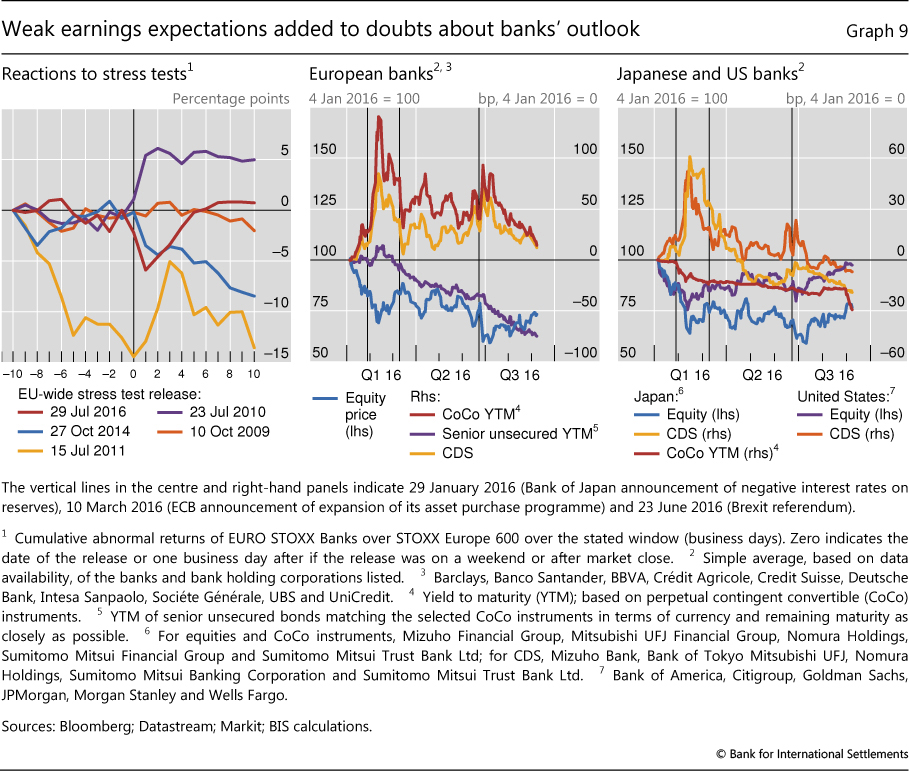
While European bank equity prices were weak, their senior debt and contingent convertible bonds (CoCos) regained some of the value lost during the first quarter of the year (Graph 9, centre panel). The combination of narrower CDS and CoCo spreads with plunging stock prices and reduced earnings expectations suggests that, despite investors' anticipation of persistently low profitability at the major European lenders, solvency concerns remain limited as a number of bank debt instruments benefited from the broader global search for yield.
Difficulties in Europe were mirrored by challenges in the Japanese banking sector. In an effort to improve profitability, the three main Japanese banks sold a large quantity of government bonds in the second quarter, more than doubling net trading income with respect to the same period of the previous year. However, the negative rate environment and protracted low economic growth continued to erode banks' earnings, pushing equity valuations to new lows. At the same time, echoing the pattern seen in Europe, Japanese banks' CDS and CoCo spreads reverted to significantly lower levels, after the spike recorded at the beginning of the year (Graph 9, right-hand panel).
Positive results from US banks accentuated the divide with Europe and Japan. Earnings for the six largest US banks met or beat expectations in the second quarter, while most of the industry fared well in the Fed's stress tests, with the exception of the subsidiaries of two European banks. Net interest margins have remained substantially flat since the December rate increase by the Fed.
Recent strains in money markets added to this overall adverse landscape. The three-month US dollar Libor-OIS spread soared from 25 to about 40 basis points from early July to the end of August (Graph 10, right-hand panel). In the past, spikes in this gauge have been associated with concerns about counterparty credit risk, particularly during the GFC and the subsequent sovereign debt crisis in Europe. This time around, the increase seems to be mainly related to regulatory reforms designed to improve the resilience of the US money market fund (MMF) sector. In particular, starting on 14 October 2016, new rules will require prime MMFs (which invest in non-government assets) and tax-exempt institutional funds to adopt a floating net asset value structure. Moreover, they will be allowed to impose redemption gates and liquidity fees in the event of a large increase in outflows.
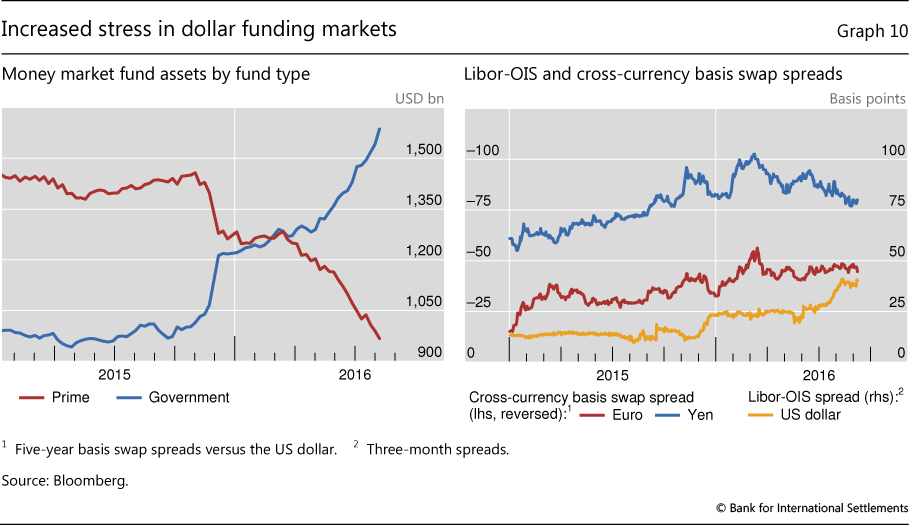
In anticipation of these rules, investments have been shifting away from prime funds towards government funds since late 2015. Since late June, this has resulted in nearly $250 billion in outflows from prime funds and more than $300 billion in inflows into government funds (Graph 10, left-hand panel). This has created incipient funding tensions for non-US, especially Japanese, banks which rely heavily on prime funds for their US dollar funding. In turn, these developments have created additional funding demand in the dollar/yen cross-currency swap market, widening pre-existing anomalies in the basis (Graph 10, right-hand panel).11
1 The Federal Reserve, the ECB and the Bank of England released statements to that effect on 24 June, as did the People's Bank of China. The Global Economy Meeting, which is the main discussion forum for central bank Governors at the BIS, issued a press release endorsing the contingency measures put in place by the Bank of England. All statements emphasised collaboration among central banks in monitoring and addressing potential threats to financial stability.
2 However, in US dollar terms the FTSE 100 was almost 5% cheaper than before Brexit, suggesting that markets perceived some lasting deterioration in these companies' future business conditions.
3 The neutral interest rate (or "natural rate") is the rate consistent with output being at potential (and hence inflation being stable) in the long term. A lower natural rate would point to a more gradual "normalisation" process and to a lower end point. See Box IV.C in the BIS 86th Annual Report and the references listed there for alternative views on the level of the natural rate, including one that explicitly incorporates the impact of the financial cycle.
4 Specifically, the Bank of Japan doubled its US dollar lending programme to $24 billion, and established a facility that will allow Japanese banks to borrow JGBs using their reserves. In turn, those bonds could be pledged in US dollar funding operations.
5 Other estimates, which include high-grade corporate bonds, bring this number to a range between $13 trillion and $16 trillion.
6 For a more in-depth analysis of the current low interest rate environment, see BIS, 86th Annual Report, 2016, Chapter II.
7 For a discussion of volatility and a historical perspective, see BIS, "Volatility stirs, markets unshaken", BIS Quarterly Review, September 2014, pp 1-11.
8 On 10 March, the ECB announced the addition of investment grade euro-denominated bonds issued by non-financial corporations to the mix of assets eligible for regular purchases. The ECB estimated that spreads on investment grade corporate bonds eligible to participate in the asset purchase programme tightened by 11 basis points during the subsequent two weeks. The effect went further, as high-yield bonds dropped by 25 basis points, and financial entity bonds (not eligible) fell by 5 basis points. See European Central Bank, ECB Economic Bulletin, issue 5, 2016, Box 2.
9 See Box B in C Borio, R McCauley, P McGuire and V Sushko, "Covered interest parity lost: understanding the cross-currency basis", BIS Quarterly Review, September 2016, pp 45-64.
10 See S Baker, N Bloom and S Davis, "Measuring economic policy uncertainty", Quarterly Journal of Economics, forthcoming.
11 See C Borio, R McCauley, P McGuire and V Sushko, "Covered interest parity lost: understanding the cross-currency basis", BIS Quarterly Review, September 2016, pp 45-64.