Trends and drivers of income inequality
(Extract from pages 47-48 of BIS Quarterly Review, March 2016)
The recent debate has focused mostly on income inequality - the distribution of returns from labour and capital - within, but also across, countries.
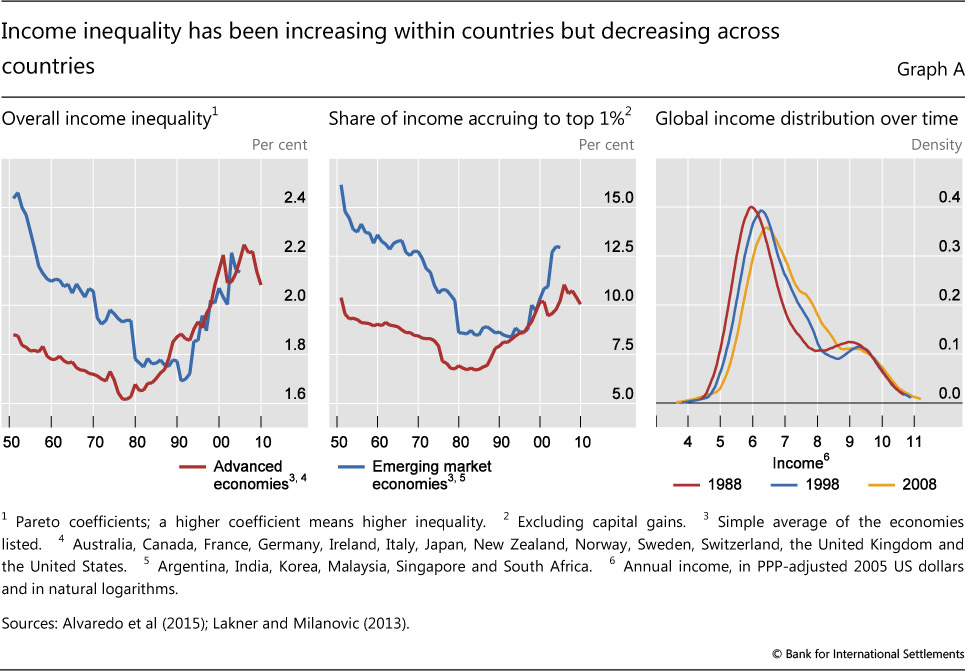
Within countries, income inequality has risen globally. Graph A (left-hand panel) shows that there is a U-shaped time pattern in average income inequality, a pattern that is observable across economies. After thinning in the 1950s, 1960s and 1970s, the right tail of the income distribution has been getting fatter. ; The same U-shaped pattern is found in the share of income accruing to the top 1% of the distribution (Graph A, centre panel), suggesting that the top end of the distribution is an important driver of inequality. Rising income inequality within countries contrasts with narrower income dispersion across countries. Between 1988 and 2008, the global income distribution narrowed: the bottom tail of the distribution shifted to the right (Graph A, right-hand panel).
 This shift largely reflects growth in middle-income EMEs, especially China.
Rising income inequality within economies and a lower dispersion of incomes across countries are consistent with global factors driving inequality trends. Economic and financial globalisation is thought to have widened the income distribution by increasing the ratio of skilled to unskilled wages. Highly skilled workers benefit from global opportunities, whereas the low-skilled face stiff competition from (cheaper) foreign labour and a loss of bargaining power. By the same token, workers in EMEs have seen their wages rise relative to those of their AE counterparts even as low-skilled wages have fallen relative to those of more skilled workers within AEs. This process has likely been supported by skill-biased technological progress and by advances in information technology in particular.
The integration of the labour force of large EMEs into global production has probably reduced the rate of return on labour relative to capital. As a consequence, the returns to wealth (ie corporate profits, dividends, rents, sales of property, capital gains) and the share of capital in total income have increased. Given that the distribution of wealth is more concentrated than the distribution of income, a rising capital share increases income inequality.
Moreover, the faster rise in remuneration at the very top of the income distribution relative to wage growth in the lower percentiles has been linked both to the rapid growth of the financial sector since the 1980s and to changes in the social norms that contribute to the determination of executive pay (Piketty (2014)).
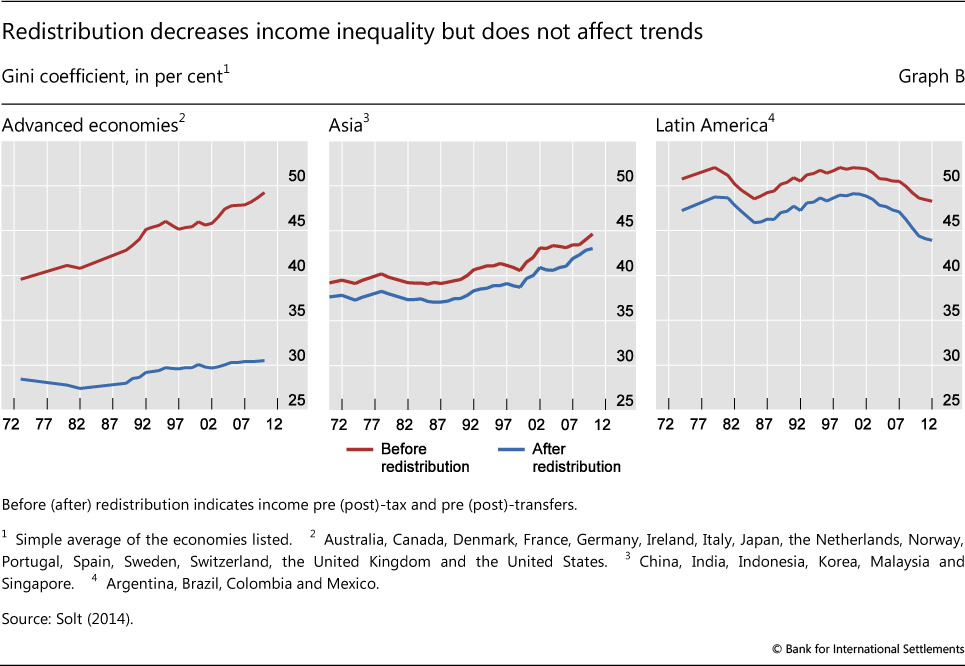
Redistributive fiscal policies appear have reduced the level of inequality, especially in AEs, but they have not changed long-term trends (Graph B).
The left-hand panel of Graph A plots time series of the Pareto coefficient - a measure that captures the higher-income part of the distribution. The higher the Pareto coefficient, the fatter the upper tail of the income distribution. For concreteness, if the Pareto coefficient is 2, the average income of individuals with income above $100,000 is $200,000 and the average income of individuals with income above $1 million is $2 million. Lakner and Milanović (2013) estimate the global distribution of income by aggregating within country household surveys. They correct for income underreporting at the top by using the discrepancy between consumption growth in national accounts and in household surveys. This is allocated to the top 10% of the income distribution by fitting a Pareto distribution to the upper tail. In the United States, for example, in 2010 the top 1% of households held about 35% of total wealth (see Graph 1, right-most panel) but 18% of total income (see Graph A, centre panel).