Tensions in high-yield bond markets
(Extract from pages 7-9 of BIS Quarterly Review, March 2016)
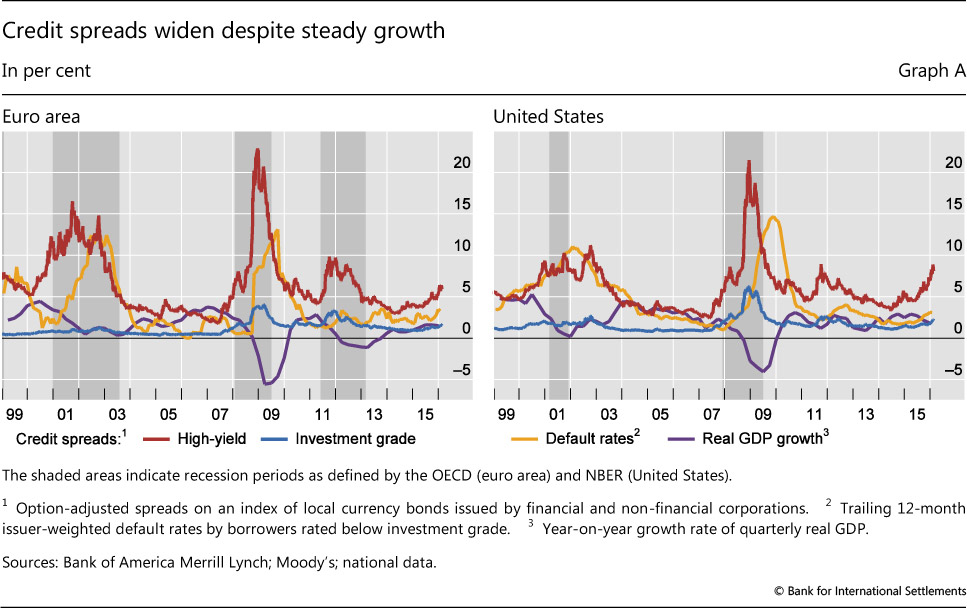
The high-yield debt market was subject to significant tensions in 2015. The BofA Merrill Lynch US High Yield Index fell 4.6% and high-yield credit spreads exceeded 5% in Europe and 7% in the US (Graph A). At the end of 2015, market turbulence affected a number of specialised investment funds and severe investor redemptions forced them to try to unload illiquid assets as prices plunged. In the second week of December, the Third Avenue Focused Credit Fund stopped fulfilling investor sell orders and announced plans to liquidate its whole portfolio in an orderly fashion within one year. In the days following the events at Third Avenue, other high-yield oriented funds, including funds managed by Sunlion Capital Partners, Lucidus Capital Partners and Whitebox Advisors, either suspended redemptions or set plans to liquidate their holdings.
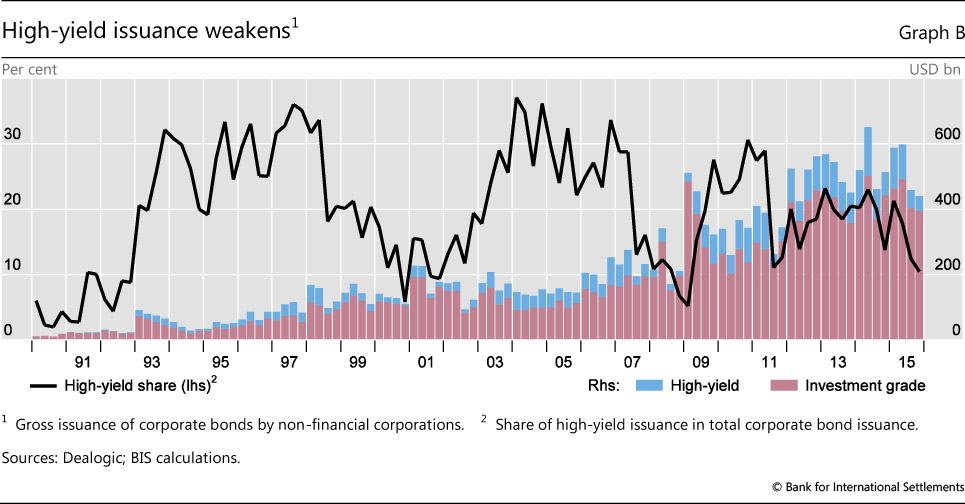
As the difficulties on the demand side of the market emerged, the issuance of new high-yield securities slowed. While corporate bond issuance remained strong, issuance in the high-yield segment contracted, particularly in the second half of the year. From a low of $98 billion in 2008, high-yield debt issuance had exceeded $400 billion annually in 2013-14, before falling to $334 billion in 2015 (Graph B).
The ongoing turmoil in the energy sector is central to explaining the tensions experienced by high-yield debt securities. The Merrill Lynch HY Energy Index plummeted in 2015, underperforming both US Corporate High Yield and Emerging Markets High Yield indices. Even though previous crises have also inflicted substantial losses on high- yield securities, the tensions in the energy sector are specific to the most recent period (Graph C). An increasing number of defaults toward the end of 2015, however, hints at the possibility of broader fragilities (Graph C, right-hand panel).
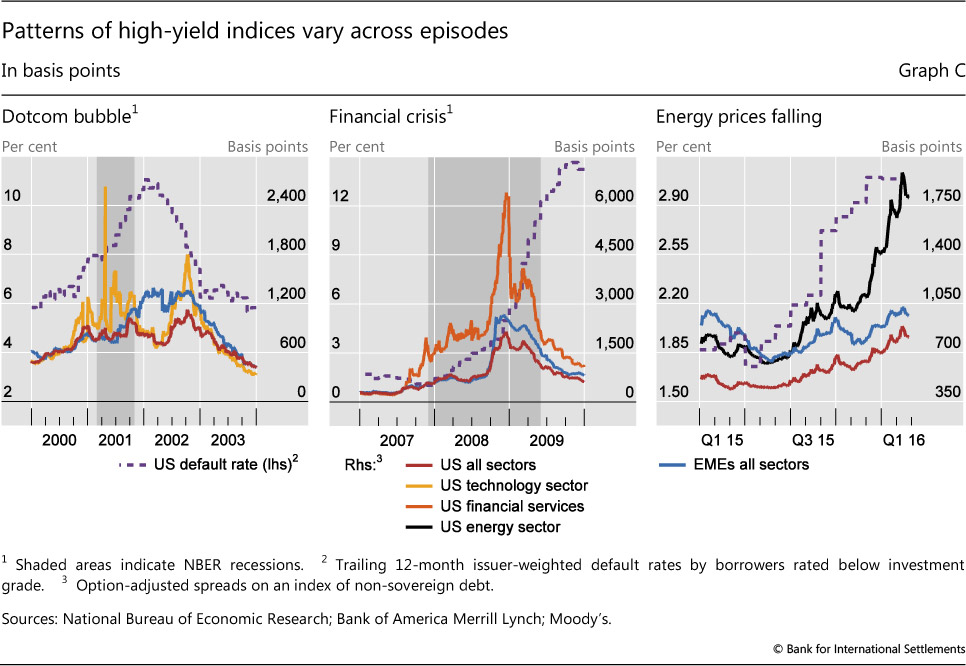
One interpretation of recent events is that the high-yield rout is an isolated development, driven by US oil industry weakness; another is that this is a "canary in the coal mine" moment signalling broader fragilities. Recent experience, supported by academic research, suggests that sharp increases in credit spreads are a leading indicator of recessions. This is the case even when wider spreads initially reflect sector-specific strains: high-yield credit spreads started to rise in the technology sector at the beginning of 2000, just before the burst of the tech bubble (Graph C, left-hand panel), while financial sector high-yield spreads rose in 2007, before the Great Financial Crisis (centre panel). Spreads of other risky securities in these episodes only started to widen when the broader economy turned down. More recently, while spreads have widened dramatically since the second quarter of 2015 in the energy sector, other credit spreads, including those on emerging market corporate debt, have crept up much more gradually (right-hand panel).
A Estrella and G Hardouvelis, "The term structure as a predictor of real economic activity", Journal of Finance, vol 46, 1991, pp 555-76; A Estrella and F Mishkin, "Predicting US recessions: financial variables as leading indicators", Review of Economics and Statistics, vol 80, 1998, pp 45-61; and J Faust, S Gilchrist, J Wright and E Zakrajsek, "Credit spreads as predictors of real-time economic activity: a Bayesian model-averaging approach", The Review of Economics and Statistics, vol 95, no 5, 2013.