Highlights of the BIS international statistics
The BIS, in cooperation with central banks and monetary authorities worldwide, compiles and disseminates data on activity in international financial markets. This chapter summarises the latest data for the international banking and over-the-counter (OTC) derivatives markets, available up to end-2014. A box looks at residential property price developments.1
Takeaways
- Global cross-border claims increased by $11.6 billion between end-September and end-December 2014 on an exchange rate-adjusted basis.
- Cross-border claims grew at a year-on-year rate of 5%, with lending to non-bank borrowers expanding faster (7%) than claims on banks (3%).
- Cross-border claims on China contracted by about $51 billion during the last quarter of 2014, which brought down their year-on-year growth rate to 21%. Outstanding cross-border claims on Chinese residents totalled $1 trillion at end-December 2014, making China the eighth largest borrower worldwide.
- OTC derivatives markets contracted in the second half of 2014. The notional amount of outstanding contracts fell by 9% between end-June and end-December 2014, from $692 trillion to $630 trillion. Exchange rate movements exaggerated the contraction of positions denominated in currencies other than the US dollar. Yet, even after adjusting for exchange rate movements, notional amounts were down by about 3%.
- The gross market value of outstanding derivatives contracts - which provides a more meaningful measure of amounts at risk than notional amounts - rose sharply in the second half of 2014. Market values increased from $17 trillion to $21 trillion between end-June and end-December 2014, to their highest level since 2012. The increase was probably driven by pronounced moves in long-term interest rates and exchange rates.
- Central clearing, a key element in global regulators' agenda for reforming OTC derivatives markets to reduce systemic risks, made further inroads. In credit default swap (CDS) markets, the share of outstanding contracts cleared through central counterparties (CCPs) rose from 27% to 29% in the second half of 2014. In interest rate derivatives markets too, central clearing is gaining ground.
Recent developments in the international banking market
Between end-September and end-December 2014, BIS reporting banks' cross-border claims2 grew slightly, by $11.6 billion, after adjusting for breaks in series and exchange rate movements. This left the year-on-year growth rate roughly unchanged from the previous quarter, at 5% (Graph 1, left-hand panel).
This modest quarterly increase masked countervailing patterns across sectors. Cross-border lending to non-banks actually grew by $190 billion, whereas that to banks dropped by $178 billion. This continued the trend observed since mid-2012 in which lending to non-banks had been much stronger than lending to banks.
Cross-border claims on advanced economies rose by $38 billion during the last quarter of 2014, which took their growth rate in 2014 to 4%. This figure reflects the combination of positive year-on-year growth rates in cross-border bank claims on the euro area (5%) and the United Kingdom (5%) with almost unchanged lending to the United States (Graph 1, right-hand panel). Substantial differences also emerged within the euro area. Claims on France (+12%), Germany (+8%), Italy (+6%), the Netherlands (+5%) and Ireland (+3%) all expanded during 2014. By contrast, claims on Cyprus (-8%), Portugal (-4%), Spain (-3%) and Greece (-3%) contracted. Cross-border claims on Switzerland (three quarters of which are on banks) fell by more than 8%.
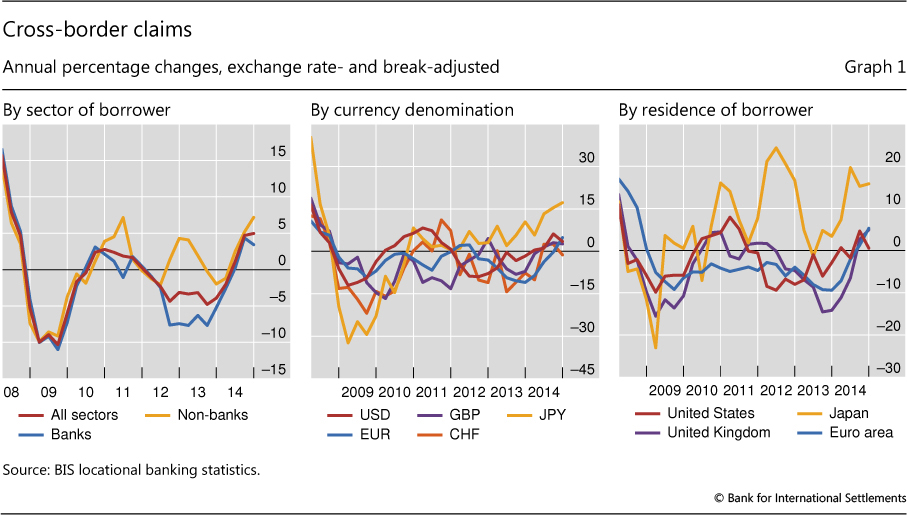
Cross-border claims on Japan continued to expand at a very rapid pace, growing at a year-on-year rate of 16% as of end-2014. The latest annual increase is part of a longer trend, characterised by high, often double-digit growth rates that have persisted for the past several years. The consolidated banking statistics indicate that most of the recent increases have been directed towards banks.3 The share of international claims on banks rose from 53% at end-2007 to 75% at end-2014. During the same period, the shares of claims on the public and the non-bank private sector fell in each case, to 11% and 14%, respectively.
Cross-border claims denominated in all major currencies expanded during 2014 (Graph 1, centre panel). At the end of 2014, cross-border lending in yen jumped by more than 17% on a year-on-year basis. Nevertheless, even after the latest increase, yen-denominated claims still accounted for only 5% of all global cross-border claims. After experiencing declines in both 2012 and 2013, cross-border lending in US dollars went up by almost 4% in 2014. Euro-denominated claims have recently stopped contracting, and grew by 5% in 2014. Similarly, claims in sterling expanded by 3%, whereas claims in Swiss francs contracted by 1%.
Credit to emerging market economies
Cross-border bank claims on emerging market economies (EMEs) contracted by $75 billion during the fourth quarter, pushing the year-on-year growth rate down to 6% at end-December 2014 from 11% at end-September 2014. The overall positive year-on-year growth rate masked considerable differences across regions. While claims on EMEs in Asia-Pacific (+12%), Africa and the Middle East (+10%) and Latin America (+5%) rose, those on Europe (-9%) declined.
As in previous quarters, claims on China shaped overall developments in EMEs. Claims fell by $51 billion in the fourth quarter of 2014, which brought down their year-on-year growth rate to 21% from 40% at end-September 2014. Nevertheless, outstanding cross-border claims on Chinese residents still totalled $1 trillion at end-December 2014, making China the eighth largest borrower worldwide. Among EMEs, cross-border claims on China by far exceeded those on other large borrowers, such as Brazil ($307 billion), India ($196 billion) and Turkey ($194 billion).
The surge in international lending to China over the past few years has been primarily driven by short-term claims. Their share in overall international claims has increased, from 59% at end-2008 to 78% at end-December 2014 (Graph 2). Of the 10 largest EME cross-border bank lending destinations, only Chinese Taipei had a higher end-2014 share (83%) of short-term international claims. That said, the short-term claims share increased between end-2008 and end-2014 in eight of the above 10 EMEs, with Indonesia and Russia as the only exceptions.
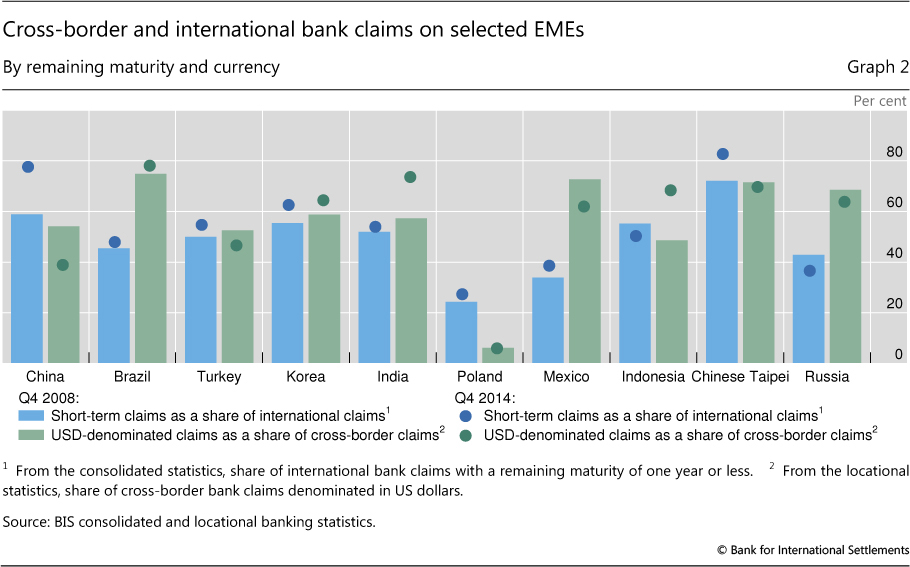
In the meantime, the US dollar has lost some ground in lending to EMEs. In the case of China, the share of the US dollar in total cross-border claims dropped by 15 percentage points from 54% at end-2008 to 39% at end-2014. The US dollar share has also declined for Mexico, Chinese Taipei, Turkey and Russia. Nevertheless, it remains very high for a number of large EMEs, exceeding two thirds for Brazil (78%), India (74%), Chinese Taipei (70%) and Indonesia (68%).
Overall, cross-border lending to Asia-Pacific increased by $214 billion in 2014. Cross-border claims on Indonesia grew rapidly (19%); by contrast, those on Korea grew by only 1%, and lending to India remained virtually unchanged.
Turning to Latin America, cross-border lending increased by $31 billion during the year. Claims on both Mexico and Brazil grew at a similar, moderate pace of about 4-5%.
Claims on emerging Europe fell by $65 billion, especially on Hungary (by almost $6 billion, or nearly 13%, during 2014). Poland saw cross-border borrowing decline by almost $9 billion, or 7%, on a year-on-year basis. The fall in cross-border claims on Russia since early 2013 accelerated during the last quarter of 2014. On an exchange rate-adjusted basis, bank lending to Russia shrank by about $19 billion between end-September and end-December 2014, bringing the year-on-year contraction to 21%.
Recent developments in OTC derivatives markets
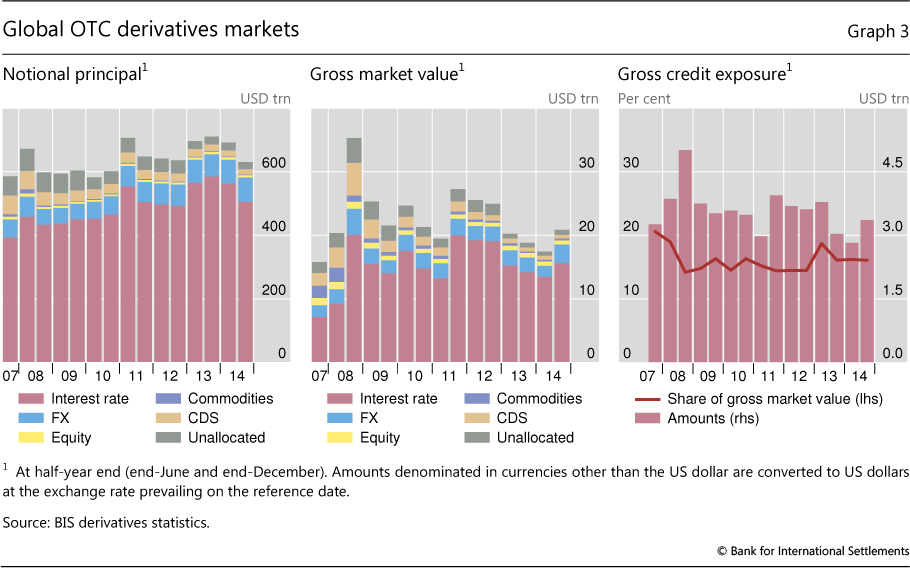
The overall size of the over-the-counter derivatives market continued to contract in the second half of 2014. The notional amount of outstanding contracts, which determines contractual payments and is one indicator of activity, fell by 9% between end-June and end-December 2014, from $692 trillion to $630 trillion (Graph 3, left-hand panel). Exchange rate movements exaggerated the contraction of positions denominated in currencies other than the US dollar.4 Yet, even after adjusting for this effect, notional amounts at end-December 2014 were about 3% lower than at end-June 2014.
The gross market value of outstanding derivatives contracts - that is, the cost of replacing them at prevailing market prices - sharply increased in the second half of 2014. This contrasts with the downward trend of recent years. The increase in gross market values was largely due to pronounced moves in long-term interest rates and exchange rates. Market values stood at $21 trillion at end-December 2014, their highest level since 2012 and up from $17 trillion at end-June 2014 (Graph 3, centre panel).
The gross market value represents the maximum loss that market participants would incur if all counterparties failed to meet their contractual payments and the contracts were replaced at current market prices.5 Market participants can reduce their exposure to counterparty credit risk through netting agreements and collateral. Accordingly, gross credit exposures adjust gross market values for legally enforceable bilateral netting agreements, although they do not take account of collateral. Gross credit exposures equalled $3.4 trillion at end-December 2014, up from $2.8 trillion at end-June 2014. This represented 16.1% of gross market values at end-December 2014, which was about the same share as reported at end-June 2014 and in line with the average since 2008 (Graph 3, right-hand panel).
Interest rate derivatives
The interest rate segment accounts for the bulk of OTC derivatives activity. For single currency interest rate derivatives at end-December 2014, the notional amount of outstanding contracts totalled $505 trillion, which represented 80% of the global OTC derivatives market. At $381 trillion, swaps account for by far the largest share of outstanding interest rate derivatives.
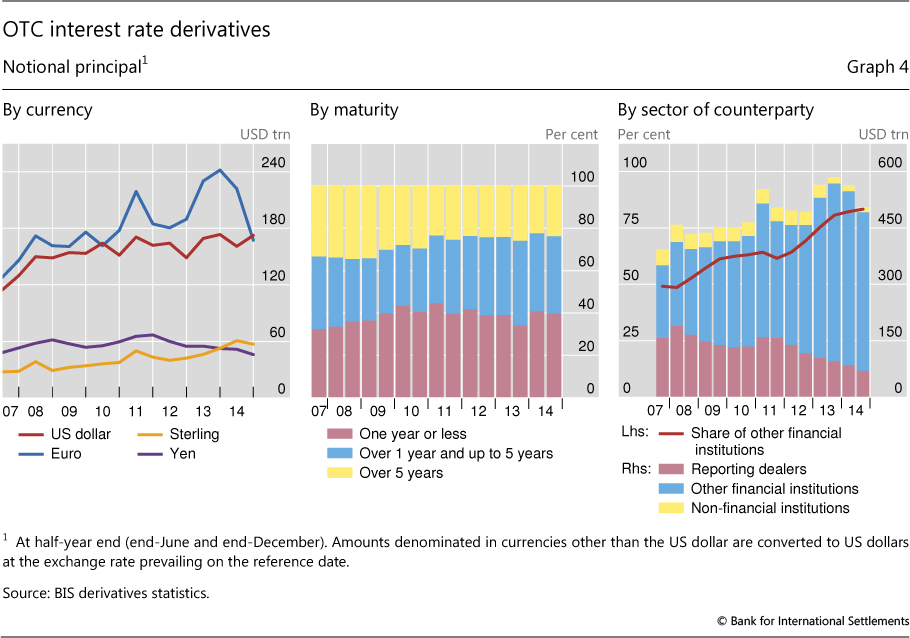
Notional amounts fell sharply in the second half of 2014, reflecting a contraction in euro-denominated interest rate contracts (Graph 4, left-hand panel). The notional value of euro contracts declined from $222 trillion to $167 trillion between end-June and end-December 2014 (or equivalently from €162 trillion to €138 trillion). An important driver of this decline was the elimination of redundant contracts via trade compression. The volume of compressions picked up noticeably in 2014, especially of interest rate swaps that are centrally cleared.6 Another factor that may have contributed to the decline was reduced hedging activity as market participants revised expectations regarding the outlook for monetary policy in the euro area.7
The notional value of interest rate contracts in other currencies rose in the second half of 2014. US dollar contracts increased from $161 trillion to $173 trillion between end-June and end-December 2014. Yen, sterling and Canadian dollar contracts also increased, after adjusting for the impact of exchange rate movements on the reported US dollar positions of interest rate derivatives denominated in those currencies.
The gross market value of interest rate derivatives increased in the second half of 2014, from $13 trillion to $16 trillion. Declines in long-term yields to, in many instances, new lows contributed to the rise in market values by widening the gap between market interest rates on the reporting date and rates prevailing at contract inception. Increases in market values were reported for interest rate derivatives denominated in all of the major currencies and were especially marked in sterling and Canadian dollar contracts. The gross market value of euro-denominated contracts rose from $7.4 trillion at end-June 2014 to $8.2 trillion at end-December 2014 (or equivalently from €5.4 trillion to €6.7 trillion).
The overall decline in notional amounts was accompanied by a modest change in the maturity distribution of interest rate derivatives. As a share of all maturities outstanding, contracts with maturities of over five years rose from 22% to 24% between end-June and end-December 2014 (Graph 4, centre panel). Short- and medium-term contracts were roughly unchanged, at 40% and 37%, respectively.
The distribution of interest rate derivatives by counterparty points to a continued shift in activity towards financial institutions other than dealers, including asset managers and CCPs.8 The notional amount of interest rate contracts between derivatives dealers has been falling more or less steadily since 2008, to $70 trillion at end-December 2014 compared with a peak of $189 trillion at end-June 2008 (Graph 4, right-hand panel). Contracts between dealers and other financial institutions, by contrast, stood at $421 trillion at end-December 2014, down from $463 trillion at end-June 2014. Notwithstanding this absolute decline in notional amounts, the relative importance of other financial institutions as counterparties of dealers continued to rise in the second half of 2014: their share of all outstanding contracts rose to 83% at end-December 2014 from 82% at end-June 2014 and 49% at end-June 2008.
Foreign exchange derivatives
Foreign exchange derivatives make up the second largest segment of the global OTC derivatives market. At end-December 2014, the notional amount of outstanding foreign exchange contracts totalled $76 trillion, which represented 12% of OTC derivatives activity. Contracts against the US dollar represented 89% of the notional amount outstanding at end-December 2014.
The gross market value of foreign exchange derivatives increased to its highest level for several years, $2.9 trillion at end-December 2014 from $1.7 trillion at end-June 2014 and $2.4 trillion at end-June 2013. The marked appreciation of the US dollar against most other currencies contributed significantly to this increase. For example, at end-December 2014 the US dollar rose to its highest level in nine years against the euro, and in seven years against the yen. In the second half of 2014, the increase in the market value of contracts against the yen was especially pronounced, rising from $0.4 trillion to $0.8 trillion (or equivalently from ¥36 trillion to ¥95 trillion).
Residential property price developments
R Szemere
Advanced economies
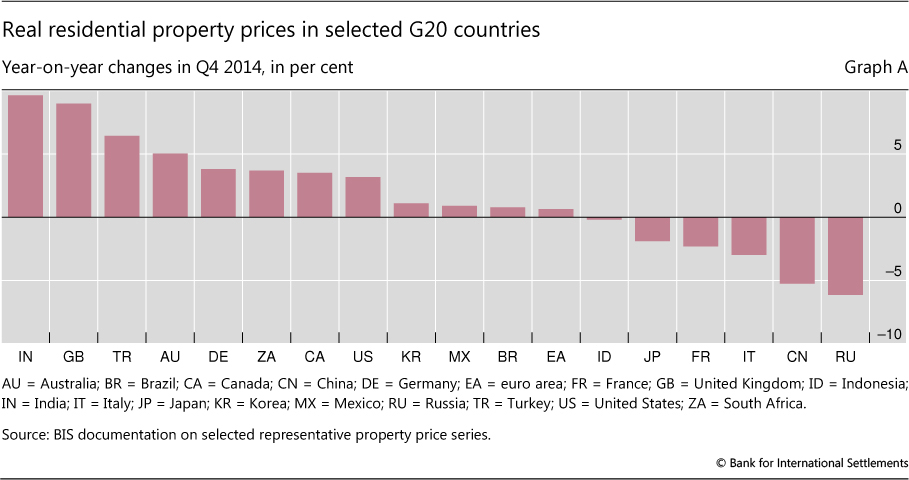
Real residential property prices continued to increase significantly in most of the advanced economies in 2014 (Graph A). They rose by 3-5% in Australia, Canada, New Zealand and the United States. They also continued to trend upwards in several European countries outside the euro area, increasing by around 10% in Sweden and the United Kingdom over one year, and more moderately in Denmark. The euro area saw a slight increase in aggregate, for the first time in seven years (by 1% year on year), although there remained important disparities across the member states. Real property prices grew by 4% in Germany, 2% in both Portugal and Spain, and a marked 16% in Ireland, albeit from subdued levels. On the other hand, price declines continued, especially in Greece (-4%) and, more moderately, in France and Italy. Contrasting with the above developments for major advanced regions, Japanese prices fell on a year-on-year basis in the fourth quarter, by 2%.
Emerging market economies
The picture in Asia was mixed. Real residential property prices increased by 10% in India, and to a lesser extent in Hong Kong SAR, Malaysia and Thailand, but fell by 5% in China. Turning to Latin America, real residential property prices remained relatively stable in Brazil and Mexico, but grew by 9% in Colombia. They also increased in South Africa (+4%). In central and eastern Europe, real residential property prices rose in Hungary (by 7%), and to a lesser extent in the Czech Republic and Poland. Prices increased by 6% in Turkey, but fell by 6% in Russia (Graph A).
Developments since 2007
Advanced economies
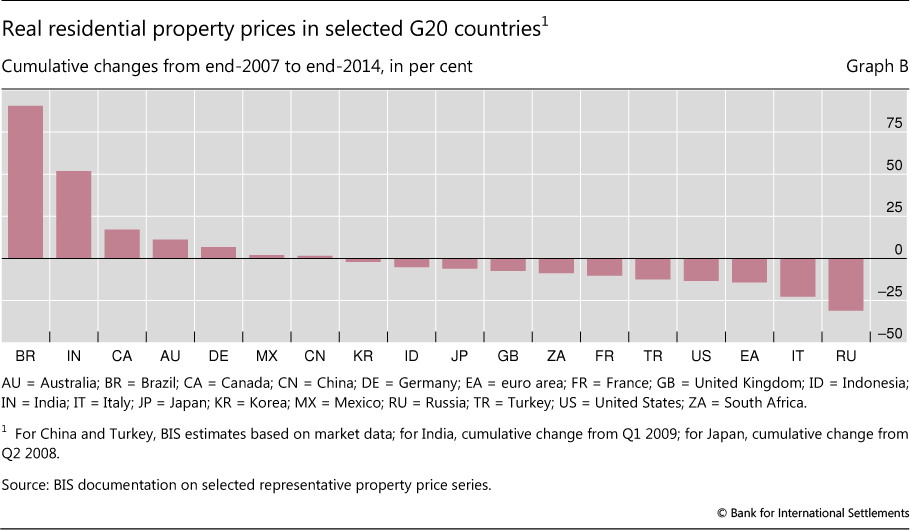
In most of the advanced economies, real residential property prices were still below their end-2007 levels as of the fourth quarter of 2014, especially in the euro area (by 14%), the United States (13%), the United Kingdom (7%) and Japan (6%). However, the euro area situation masked some important disparities. Real prices had declined by around 40% in Greece, Ireland and Spain, by 23% in Italy, and more moderately in France. But they had risen by 23% in Austria and 7% in Germany (Graph B). Residential property prices bottomed out between mid-2012 and early 2013, and then started to increase in several European countries, especially Ireland and the United Kingdom. Lastly, real property prices were well above their 2007 levels in those few advanced economies that were less affected by the financial crisis (by 17% and 11% in Canada and Australia, respectively) as well as in some European countries outside the euro area, eg by close to 20% in Norway and no less than 30% in both Sweden and Switzerland.
Emerging market economies
Real residential property prices were generally well above their end-2007 levels in a large number of emerging market economies. This was particularly the case in Asia, especially in Hong Kong SAR (+89%), India (+52%) and Malaysia (+42%) despite repeated attempts by central banks to slow this growth (Kuttner and Shim (2013)). Major exceptions to this picture were China and Korea, where price levels were roughly comparable to those observed in 2007. Real prices had also increased substantially since 2007 in Israel, as well as in a number of Latin American countries: they had doubled in Brazil and Peru, and had increased by 50% in Colombia - but had barely moved in Mexico. By contrast, prices declined in several central and eastern European countries, including Russia. That said, prices had bounced back most recently in several countries in the region (Graph B).
A note focusing on the most recent developments is published every February, August and November. Q1 2015 data already published for some countries are already available in the BIS data sets, but Q4 2014 data are not yet available for Chile. Price developments since early 2008 for the Czech Republic, Japan and Portugal, and since the first quarter of 2009 for India and Romania. For China, BIS estimates based on market data.
References
K Kuttner and I Shim (2013): "Can non-interest rate policies stabilise housing markets? Evidence from a panel of 57 economies", BIS Working Papers, no 433, November.
M Scatigna and R Szemere (2015): "BIS collection and publication of residential property prices", Irving Fisher Committee Bulletin, no 39, April.
M Scatigna, R Szemere and K Tsatsaronis (2014): "Residential property price statistics across the globe", BIS Quarterly Review, September, pp 61-76.
B Tissot (2015): "Monitoring house prices from a financial stability perspective - the BIS experience", International Statistics Institute Regional Statistics Conference, 16-19 November 2014 (forthcoming).
In contrast to the interest rate derivatives market, in the foreign exchange derivatives market inter-dealer contracts continued to account for nearly as much activity as contracts with other financial institutions. The notional amount of outstanding foreign exchange contracts between reporting dealers totalled $32 trillion at end-December 2014, and contracts with financial counterparties other than dealers $34 trillion. The inter-dealer share has averaged around 43% since 2011, up from less than 40% prior to that year. Among instruments, inter-dealer activity accounts for a greater share of more complex contracts, such as currency swaps (53% of notional amounts) and options (46%).
Credit default swaps
While in 2007 credit derivatives had come close to surpassing foreign exchange derivatives as the second largest segment in the global OTC derivatives market, notional amounts have since declined more or less steadily. They fell to $16 trillion at end-December 2014 from $19 trillion at end-June 2014 and a peak of $58 trillion at end-2007 (Graph 5, left-hand panel). The market value of CDS also continued to decline, to $593 billion at end-December 2014 in gross terms and $136 billion in net terms. The net measure takes account of bilateral netting agreements covering CDS contracts but, unlike gross credit exposures, is not adjusted for cross-product netting.
Recent declines in overall CDS activity reflected mainly a contraction in inter-dealer activity. The notional amount for contracts between reporting dealers fell from $9.5 trillion at end-June 2014 to $7.7 trillion at end-December 2014. Notional amounts with banks and securities firms also decreased in the second half of 2014, from $2 trillion to $1.3 trillion.
As a proportion of all CDS activity, central clearing continued to make inroads. The share of outstanding contracts cleared through CCPs rose from less than 10% in 2010 (when data for CCPs were first reported separately) to 26% at end-2013 and 29% end-December 2014 (Graph 5, centre panel). The share of CCPs is highest for multi-name products, at 37%, and much lower for single-name products, at 23%. Contracts on CDS indices in the multi-name segment are more amenable to central clearing, as they tend to be more standardised than those in the single-name segment.
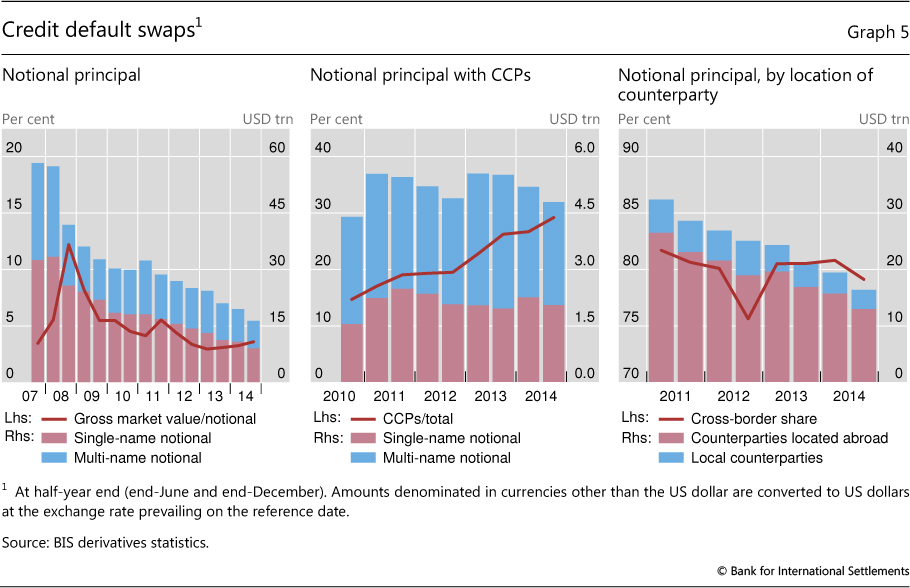
The distribution of outstanding CDS by location of the counterparty showed little change at end-December 2014. The CDS market is very international, as the majority of trades are with counterparties located in a different jurisdiction than that of the reporting dealer (Graph 5, right-hand panel). CDS with counterparties from the same country in which the dealer is headquartered accounted for only 21% of outstanding contracts at end-June 2014, or $3 trillion. Most of the foreign counterparties were from Europe, followed by the United States.
1 This article was prepared by Cathérine Koch (catherine.koch@bis.org) and Andreas Schrimpf (andreas.schrimpf@bis.org). Statistical support was provided by Stefan Binder.
2 The locational banking statistics are structured according to the location of banking offices and capture the activity of all internationally active banking offices in the reporting country regardless of the nationality of the parent bank. Banks record their positions on an unconsolidated basis, including those vis-à-vis their own offices in other countries.
3 The consolidated banking statistics are structured according to the nationality of reporting banks and are reported on a worldwide consolidated basis, ie excluding positions between affiliates of the same banking group. Banks consolidate their interoffice positions and report only their claims on unrelated borrowers.
4 Positions are reported in US dollars, and thus changes between periods include the impact of exchange rate movements on positions denominated in currencies other than the US dollar. For example, the depreciation of the euro and yen against the US dollar between end-June and end-December 2014 resulted in a decline in the reported US dollar value of positions denominated in euros and yen.
5 The gross market value is calculated as the sum of the absolute value of gross positive market values and gross negative market values. The gross positive market value is the gain to derivatives dealers - and the gross negative market value the loss - if the dealers were to sell their outstanding contracts at market prices prevailing on the reporting date.
6 Compression is a process for tearing up trades that allows economically redundant derivatives trades to be terminated early without changing either participant's net position. For statistics on multilateral compressions of CDS contracts, see TriOptima.
7 See "A wave of further easing", BIS Quarterly Review, March 2015, pp 1-12.
8 The shift towards central clearing may exaggerate growth in notional amounts for other financial institutions because, when contracts are cleared through CCPs, one trade becomes two outstanding contracts. See N Vause, "Central clearing and OTC derivatives statistics", BIS Quarterly Review, June 2011, p 26.