A wave of further easing
Largely unexpected, a wave of monetary policy easing over the past few months has taken centre stage in global financial markets. Amid plunging oil prices and rising foreign exchange tensions, a large number of central banks from both advanced and emerging market economies have provided further stimulus. The ECB announced an expanded asset purchase programme, which was larger and longer-lasting than market participants had anticipated.1
The period of unusually low market volatility seemed to be coming to an end as volatility in most asset classes reverted closer to its historical averages. This was most pronounced in commodity markets, where it spiked in early February, driven by a sharp fall in oil prices. Volatility also moved higher in foreign exchange markets, as looser monetary policies started to spill over into increasing pressures on managed exchange rates. In a surprise move, the Swiss National Bank abandoned its cap on the Swiss franc/euro rate, while several other central banks adjusted policies in defence of their exchange rate or inflation targets. The US dollar continued to appreciate against the backdrop of diverging monetary policies and sagging commodity prices.
Actual and anticipated further central bank monetary easing engendered unprecedented bond market conditions, even compared with just a couple of months ago. A significant and growing share of sovereign debt traded at negative yields, and even the yields on a few highly rated corporate debt issues dropped below zero. Extraordinarily low interest rates and compressed risk premia once again pushed investors into riskier assets in their search for yield, sending prices of most asset classes towards record highs in early March.
Volatility and asset prices move higher
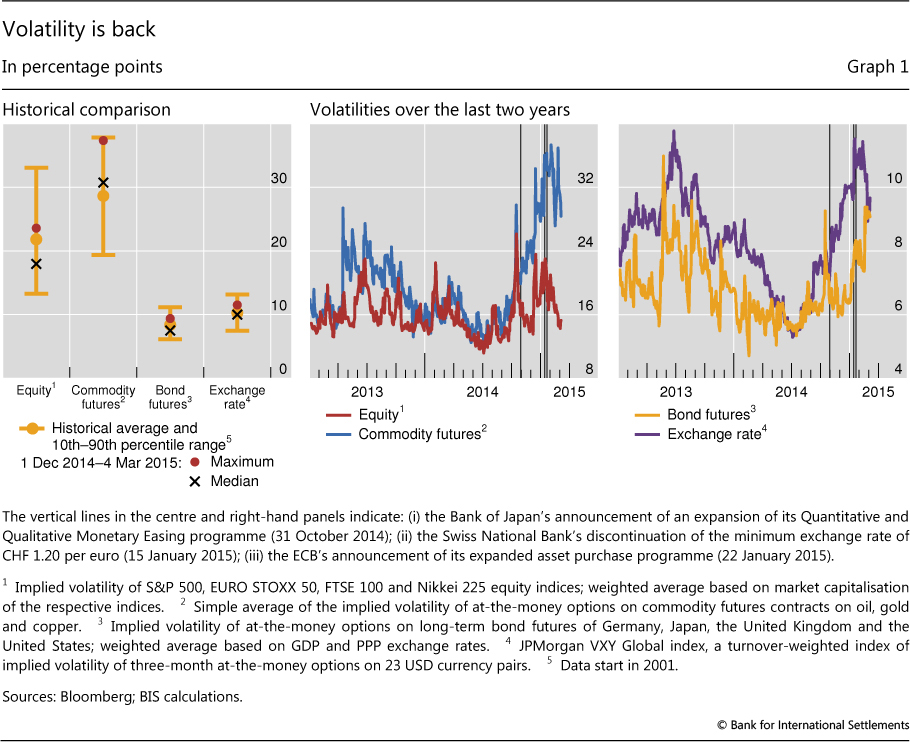
In recent months, volatilities broke away from the exceptional lows recorded in mid-2014 and moved more in line with their long-term historical averages (Graph 1, left-hand panel). Changes in market sentiment, driven mainly by lower oil prices and developments in Russia and Greece, were reflected in higher implied (forward-looking) volatilities of major asset classes. Commodity market volatility was affected the most, with oil prices moving up to 9% on certain days (Graph 1, centre panel). Stock markets were also more volatile than during September-November 2014. Exchange rate volatility edged considerably higher, partly due to diverging monetary policies, and spiked after the Swiss National Bank (SNB) decided to abandon its cap on the Swiss franc/ euro exchange rate (Graph 1, right-hand panel).
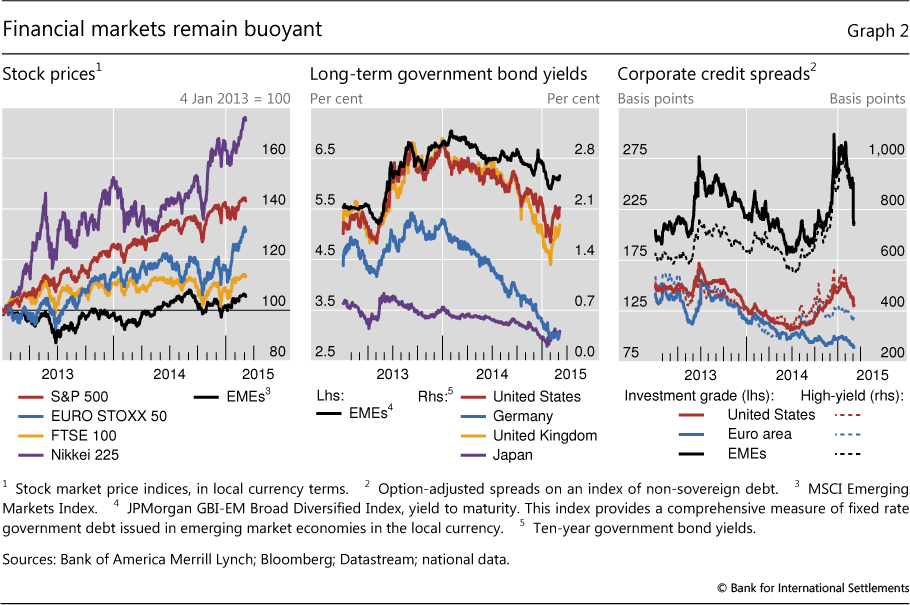
Despite more pronounced spells of volatility, most asset prices reached or moved close to new record highs. After sharp corrections in December and early January, global equites rallied on the back of looser monetary policies in both advanced and emerging market economies (Graph 2, left-hand panel). Government bond yields continued to decline, in many instances to new lows (Graph 2, centre panel). Corporate credit spreads fell after spiking in December, both for advanced and emerging market economies (Graph 2, right-hand panel). The drop in oil prices had driven up credit spreads of US firms in particular,2 but spreads started to retrace when oil prices recovered from early February onwards.
Commodity markets in turmoil
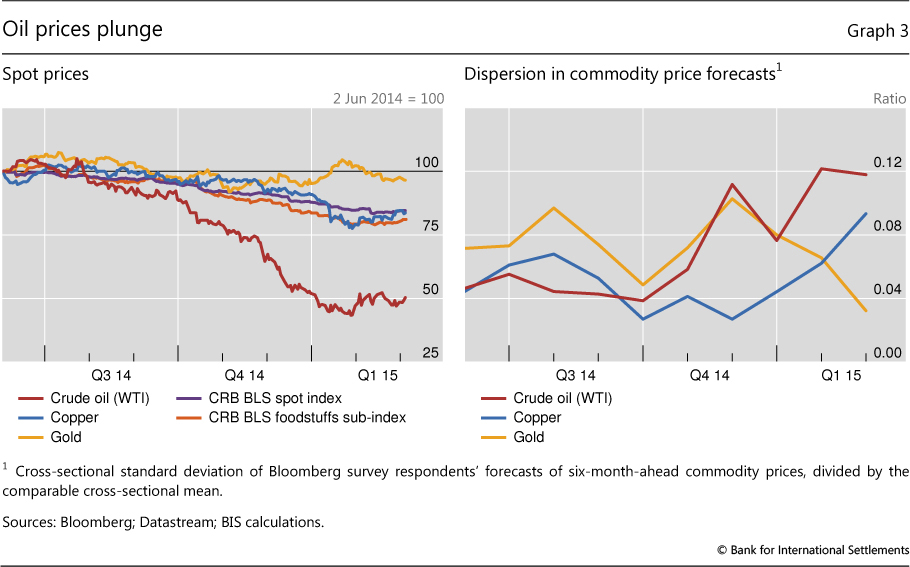
Large oil price fluctuations drove the surge in commodity volatility (Graph 3, left-hand panel). The price of Brent declined from $71 per barrel at the beginning of December to $45 in mid-January, but then recovered and stabilised at $60 in mid-February. Increasing supply and, in particular, the shifts in the production objectives of major oil-exporting countries played a key role. Moreover, financial factors may have amplified and steepened the initial drop.3 Uncertainty associated with these elements led to growing dispersion in oil price forecasts (Graph 3, right-hand panel).
The prices of industrial metals and agricultural commodities also declined, but by far less than that of oil, casting doubt on the importance of demand factors as drivers of the fall in oil prices. The price of copper, usually a strong indicator of global activity, fell by 10% during the period under review. A large part of this drop resulted from a mid-January sell-off reportedly led by China-based hedge funds, amid concerns of slower growth in China and financial investors' generally negative outlook on commodities.
Lower oil prices severely affected the profitability and outlook of energy-related firms. As a result, energy firms' stock prices fell sharply and borrowing costs surged, before stabilising and partly reverting, respectively, when oil prices bounced back in February (Graph 4, left-hand and centre panels). High debt burdens may force these firms to maintain production despite the fall in prices in order to generate the cash flow necessary to service the debt, thereby putting additional downward pressure on the price of oil.
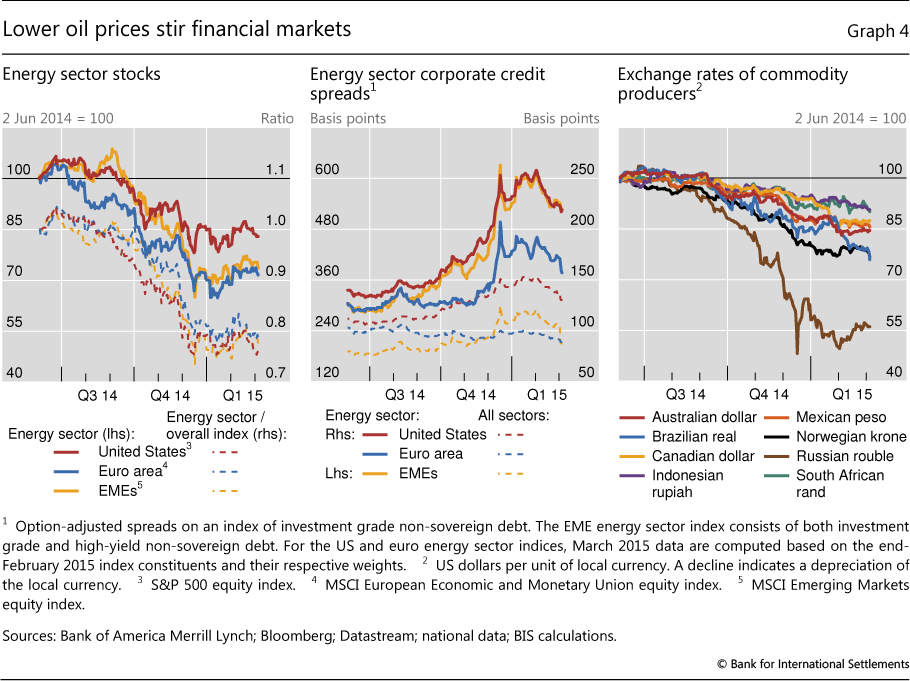
The commodity price drop also drove down the exchange rates of net commodity exporters (Graph 4, right-hand panel). The central banks of Norway and Canada responded to the risk of an economic slowdown by lowering interest rates, adding further downward pressures on exchange rates. The Reserve Bank of Australia cut its key policy rate by 25 basis points to 2.25% in early February, citing concerns over weak domestic demand. The central bank of Brazil, where net exports of commodities account for 36% of the total exports of goods, was a notable exception to this trend. It increased its key policy rate in three steps from 11.25% to 12.75%, citing above-target inflation as its primary concern.
Among the major commodity-exporting economies, Russia was particularly affected by the oil market turmoil. The rouble plunged 18% between early December and late February, due to the combined effect of lower oil prices, international sanctions and the corporate sector's large foreign debt position. The Russian central bank increased its key policy rate from 10.5% to 17% in mid-December to shore up the currency, before lowering it to 15% at the end of January. The currency fell to an intraday historical low of 79 roubles per dollar on 16 December amid concerns that a leading oil producer might convert the proceeds of a large bond issue into US dollars.
Dollar strength, euro weakness
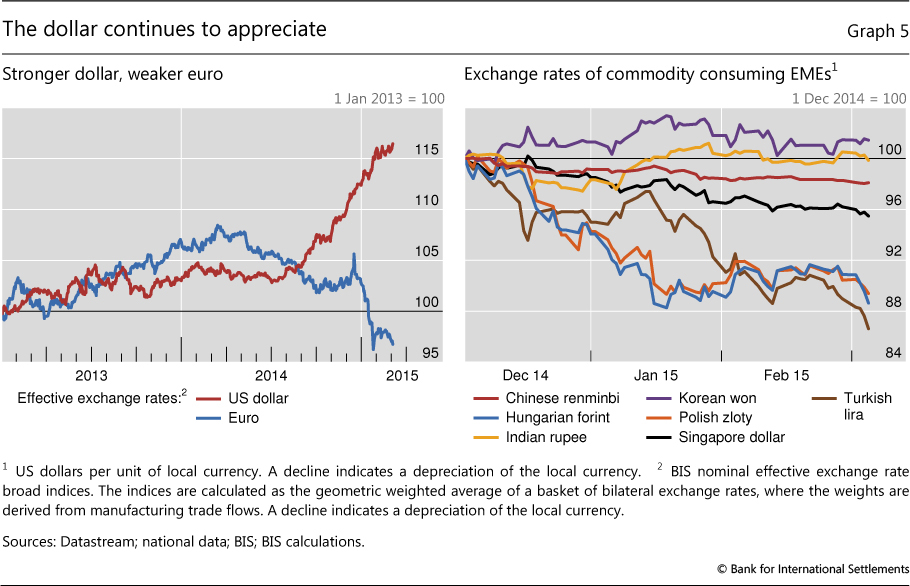
The oil price plunge coincided with a continued appreciation of the US dollar. From early December 2014 to early March 2015, the dollar appreciated by around 6% on a trade-weighted basis (Graph 5, left-hand panel). In particular, it strengthened against the euro and the currencies of a large number of emerging market economies, both commodity-producing and -consuming countries (Graph 5, right-hand panel). From the beginning of the sharp commodity price decline in early June 2014 to 4 March 2015, the dollar gained more than 12% in effective terms. Historically, a strong dollar has often gone hand in hand with falling commodity prices. This partly reflects the dollar's global use as the invoicing currency: when it appreciates, local currency commodity prices go up, requiring a price decline to balance global supply and demand. Other explanations may be financial factors4 and reduced capital flows to commodity producers.
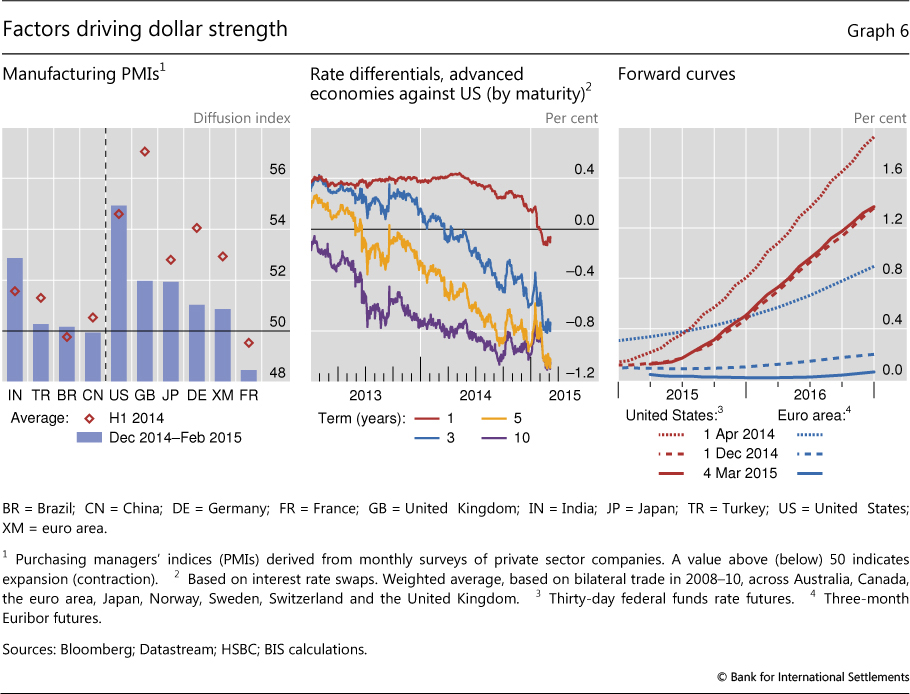
Dollar strength primarily reflected a strong US economy. Average values of manufacturing purchasing managers' indices (PMIs) in the United States for December 2014-February 2015 were around those for the first half of 2014, indicating a consolidation of strong economic activity (Graph 6, left-hand panel). At the same time, the outlook for economic activity remained weak in many other economies, despite the drop in oil prices. Both the World Bank and the IMF cut their global growth forecasts in January, with the IMF's downward revision being its steepest in three years.
Differing economic outlooks were reflected in further diverging monetary policies, which fed through into foreign exchange markets. Amid a flood of monetary easing by advanced economy central banks in recent months, the Federal Reserve was the main exception. US interest rate differentials vis-à-vis other advanced economies increased along the maturity curve, supporting a strong dollar against major currencies (Graph 6, centre panel). Market participants continued to expect that the Fed would start hiking its federal funds rate target around the summer (Graph 6, right-hand panel).
In contrast, the ECB provided additional monetary stimulus, which pushed forward rates and the trade-weighted exchange rate of the euro lower (Graph 5, left-hand panel; Graph 6, right-hand panel). On 22 January, the ECB announced an expanded asset purchase programme of around €1.1 trillion which encompasses existing programmes for asset-backed securities and covered bonds, but also includes additional purchases of bonds issued by euro area central governments, agencies and European institutions. Monthly purchases of €60 billion started on 9 March and will run until at least end-September 2016, but may be conducted until headline inflation is in line with the ECB's medium-term target of below but close to 2%.
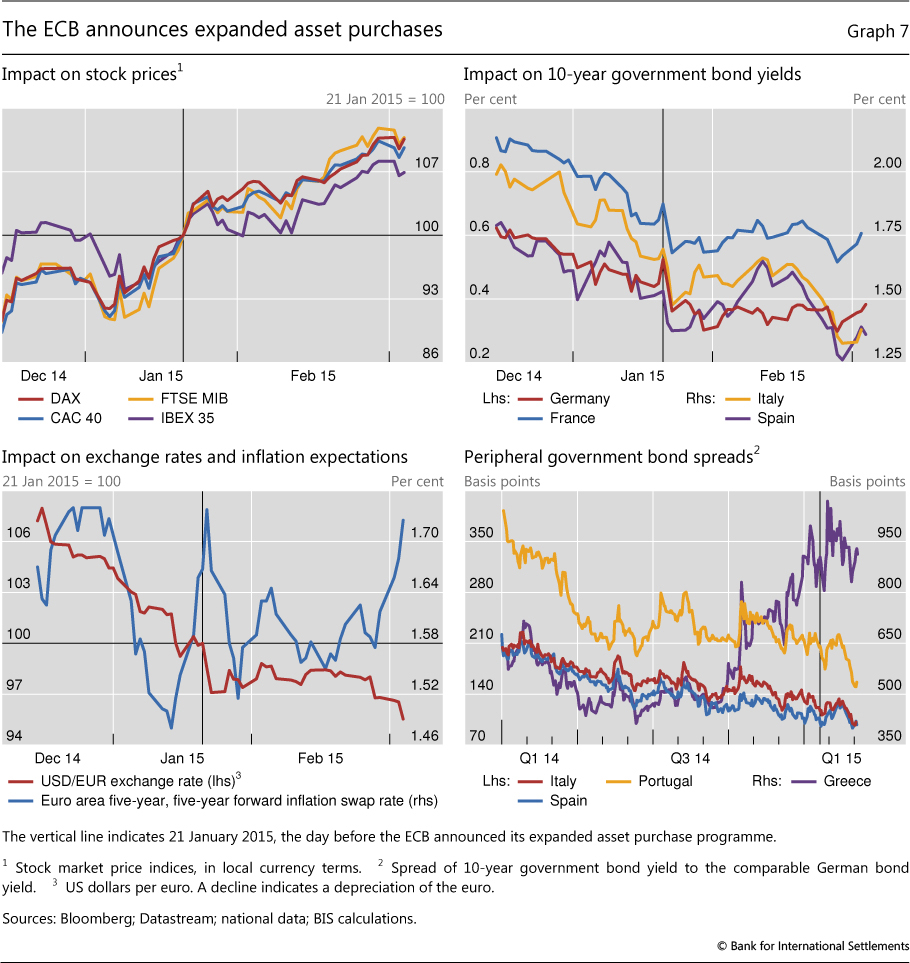
As the programme was larger and longer-lasting than market participants had anticipated, asset prices rose, despite having rallied already in the run-up to the January meeting of the ECB's Governing Council. On the announcement date, stock prices of the main core and peripheral euro area countries rose between 1.3% and 2.4%, while their sovereign bond yields dropped (Graph 7, top panels). The euro depreciated by around 1.5% against the US dollar, and estimates of market-based inflation expectations edged higher, as reflected by the increase in the five-year, five-year forward inflation swap rate for the euro area (Graph 7, bottom left-hand panel). This indicator, which is closely watched by both the ECB and market participants, fell back subsequently, but moved higher again in the run-up to the March Governing Council meeting.
At the same time, uncertainties about the policies of the newly elected Greek government weighed on market sentiment. Concerns about progress in negotiations between Greece and its creditors over the terms of the bailout programme led to spells of volatility and drove Greek sovereign yields to the highest level since July 2013. But contagion was limited, with Italian, Portuguese and Spanish government bond yields clearly decoupling (Graph 7, bottom right-hand panel).
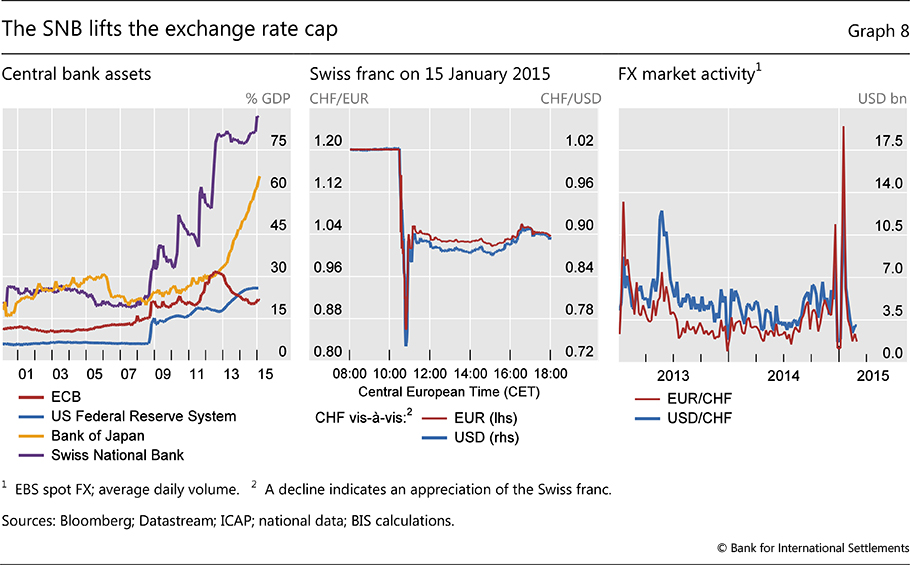
Dollar strength and euro weakness prompted further rounds of policy easing across the globe. Pressures mounted, especially on exchange rates pegged to the euro. The SNB, which had maintained a minimum exchange rate of CHF 1.20 per euro, introduced a negative interest rate (-0.25%) on large sight deposits on 18 December in order to mitigate upward pressures on the currency. These tensions followed increased risk aversion and spikes in volatility in global financial markets, which had propelled demand for safe assets. The defence of the minimum exchange rate had caused the SNB's total assets to surge to 87% of GDP in December (Graph 8, left-hand panel). Then, on 15 January, one week before the ECB announced its expanded asset purchase programme, the SNB discontinued the cap, citing divergences between the monetary policies of the major currency areas and dollar appreciation as the main reasons behind its move. The central bank also lowered its deposit rate further to -0.75%.
Financial markets reacted strongly to the removal of the cap. The main Swiss stock index plummeted almost 9% on the day, and yields on longer-dated Swiss government bonds fell below zero. The franc dived to an all-time low against the euro immediately after the announcement, before moving back to more stable levels later during the day (Graph 8, centre panel). Trading activity in EUR/CHF and USD/CHF spot markets shot up to levels not seen since May 2010 and August 2011, respectively (Graph 8, right-hand panel). Following the SNB announcement, the Hungarian forint and Polish zloty weakened considerably, driven by concerns about spillover effects of a stronger Swiss franc to the Hungarian and Polish economies (Graph 5, right-hand panel).
Pressures on the Danish krone from a weaker euro also started to mount. Danmarks Nationalbank lowered interest rates on certificates of deposit four times in just three weeks to -0.75% on 5 February, in order to defend the peg of the Danish currency to the euro. The central bank sold DKK 106.3 billion ($16 billion) in support interventions in January, followed by a monthly record of DKK 168.7 billion ($26 billion), or around 9% of GDP, in February, according to data published on its website.
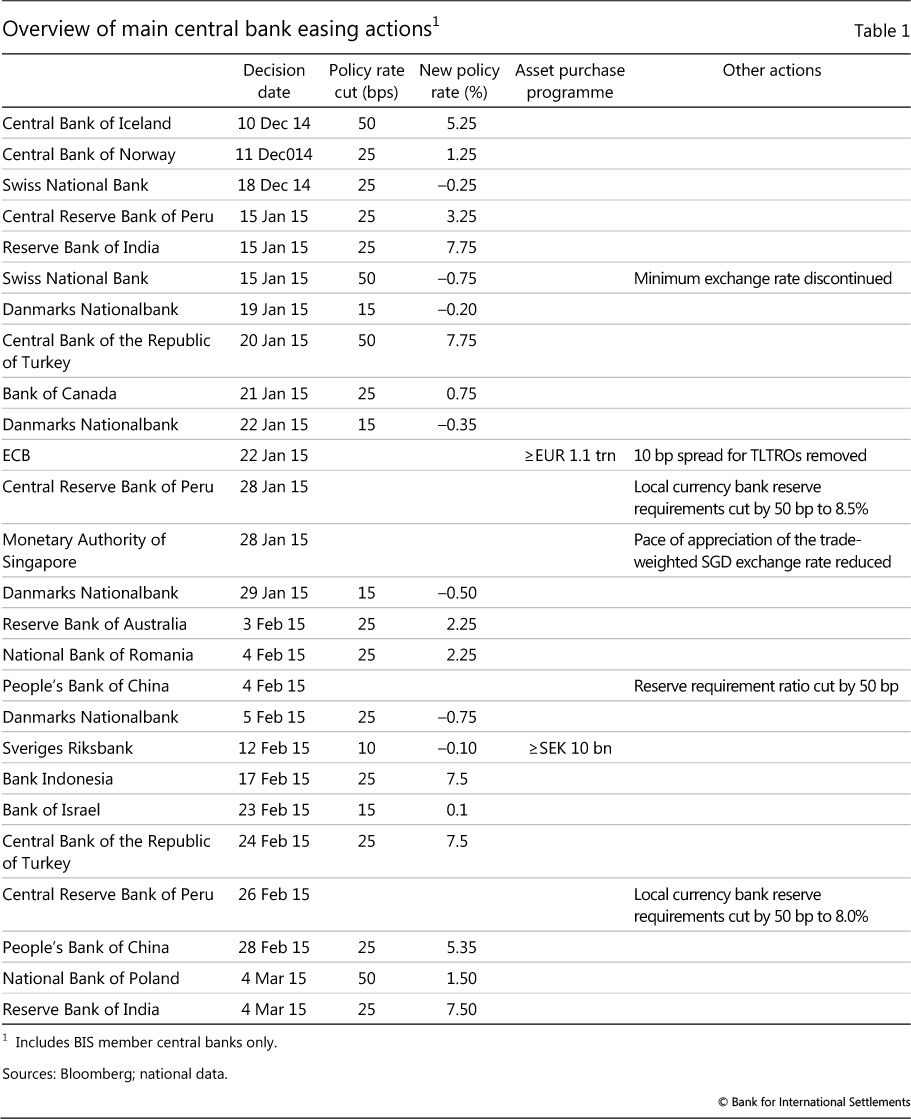
These easing central banks were not alone - in fact, well over a dozen eased their policies during the past three months, against the backdrop of the disinflationary impact of plunging oil prices and increasing foreign exchange market tensions (Table 1). The policy rates of four central banks - the ECB and the central banks of Denmark, Sweden and Switzerland - were below zero early in March. These moves often surprised financial markets, fostering risk-taking and the search for yield, which pushed up valuations of risky assets. On 12 February, Sveriges Riksbank reduced its repo rate by 10 basis points to -0.1% and announced that it would start purchases of government bonds for a total of SEK 10 billion. The Riksbank assessed that a more expansionary monetary policy was needed to ensure that long-term inflation expectations were compatible with its policy target.
Disinflationary pressures prompted several central banks to ease. With CPI inflation possibly falling below the 2016 target, the Reserve Bank of India surprised markets on 15 January by cutting its main policy rate by 25 basis points to 7.75%, the first reduction in 20 months. It surprised markets again on 4 March, lowering rates by another 25 basis points in an unscheduled inter-meeting move. The Monetary Authority of Singapore (MAS) unexpectedly eased policy on 28 January. It operates a managed float regime for the Singapore dollar under which the trade-weighted exchange rate is allowed to fluctuate within a policy band. The MAS announced that it would continue its policy of a modest and gradual appreciation of the band but reduce the pace of appreciation in order to moderate disinflationary pressures. The Singapore dollar depreciated by around 1% against the US dollar on the day of the announcement, to its lowest level since May 2010 (Graph 5, right-hand panel).
On 4 February, the People's Bank of China (PBC) unexpectedly announced a 50 basis point reduction in the reserve requirement ratio for a broad range of banks - the first industry-wide cut since May 2012. Then on 28 February, the PBC lowered its benchmark policy rates, which followed rate cuts in November 2014. The one-year benchmark deposit and lending rates were reduced 25 basis points to 2.5% and 5.35%, respectively. Other benchmark deposit and lending rates were lowered accordingly. The PBC also announced measures to further liberalise deposit rates, bringing China another step closer to the final removal of interest rate controls.
Interest rates fall ever lower
Extraordinarily easy monetary policies fed through into unprecedented conditions in bond markets. Government bonds across a wide range of markets traded at historically low and often negative yields (Graph 9, left-hand panel). Interest rates across the full maturity structure from two to 30 years dropped to record lows for several European countries. The decline was most pronounced for the longest maturities, with intraday yields on 30-year Danish, French and German bonds falling by around 60 basis points, while those for Spain and Italy shrank by 90 and 100 basis points, respectively. US 30-year Treasury yields fell to a historical low of 2.2% at the end of January. Many sovereigns' yields for maturities of up to five years, and for Switzerland up to 10 years, sank below zero. In the case of Denmark, Sweden and Switzerland, yields were pushed lower when central bank policy rates breached the zero lower bound. For some sovereigns, even issuance yields fell below zero. At the end of February, around $2.4 trillion of global long-term sovereign debt was trading at negative yields, of which more than $1.9 trillion was issued by euro area sovereigns.
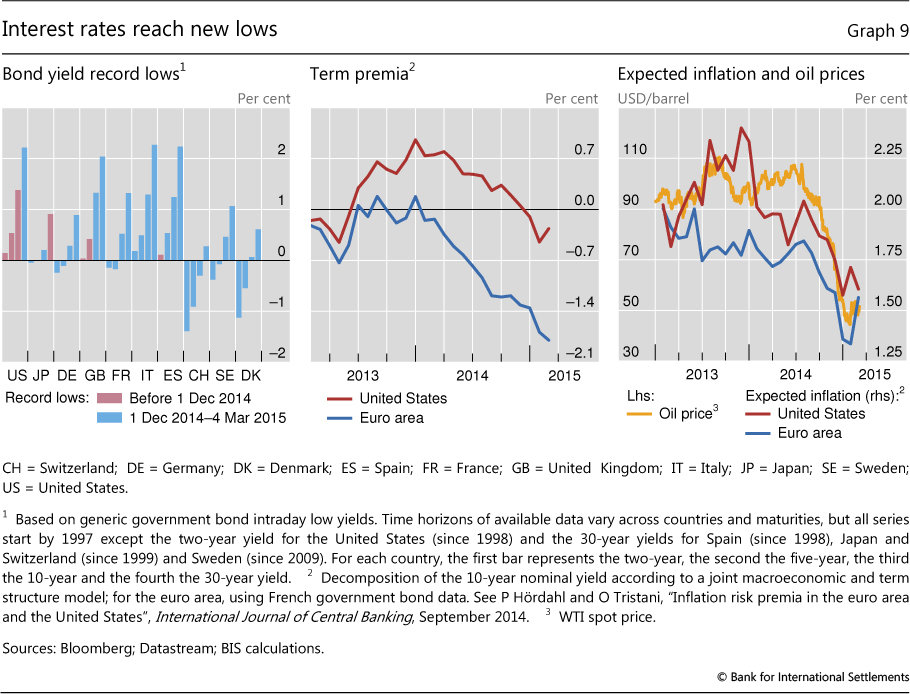
Estimates indicate that the sharp fall in long-term yields in the US and euro area was driven mainly by a compression of term premia, and to a lesser extent lower inflation expectations (Graph 9, centre and right-hand panels). Estimates of the term premium, ie the compensation for the risk of holding long-duration bonds exposed to future fluctuations in nominal rates, declined further into negative territory. The drop in term premia may reflect a reach for duration in the face of the ECB's expanded asset purchase programme and international portfolio adjustment effects. At the same time, declining inflation expectations in both the US and euro area were associated with falling oil prices (Graph 9, right-hand panel).
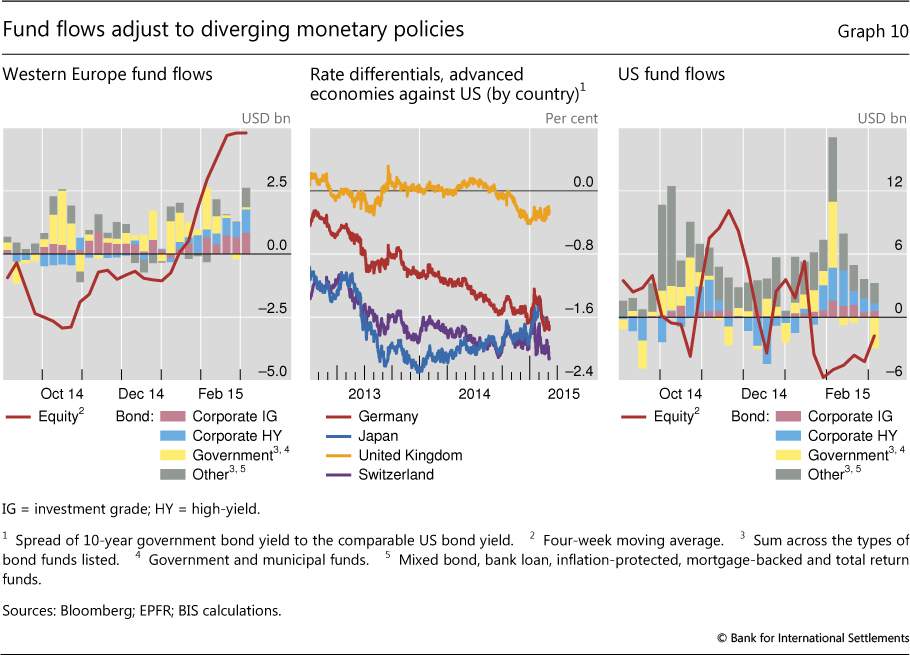
The ECB's announcement that it would start full-scale quantitative easing in March had an impact well beyond the markets immediately affected. Historically low interest rates and compressed risk premia pushed investors into riskier assets in their search for yield. During the four weeks following the announcement, European equity funds registered a cumulative inflow of almost $19 billion, the highest amount ever recorded for a similar period (Graph 10, left-hand panel). And the appetite for higher-yielding corporate debt increased markedly as well, reflected by the largest inflows into European high-yield corporate bond funds in a year. Conditions in corporate credit markets followed those in sovereign debt markets when on 3 February the yield on a Nestlé four-year euro-denominated bond turned negative.
That yields in both the US and the euro area declined despite diverging monetary policies in those economies points at possible spillover effects from European bond markets to those in the US. Indeed, against the backdrop of a stronger US dollar and increasing spreads between German and US sovereign yields, flows into US Treasury bond funds for the week after the ECB announced its expanded asset purchases were the highest since end-January 2014 (Graph 10, centre and right-hand panels). Overall, bond funds domiciled in the US saw historically large inflows totalling around $40 billion during the four weeks after the ECB's announcement - around three times the average inflow to these funds for any four-week period in 2014. The large inflow comprised $15 billion of investments in corporate bond funds that was associated with widening spreads between US and euro area corporate debt yields.
Flows into EME funds were more muted amid concerns about the growth outlook for Brazil, China and Russia. At the same time, this may also be associated with the attractiveness of US assets as an option for international investors searching for yield. But average EME figures mask important differences across regions. While emerging European and Latin American equity funds have registered net outflows since the beginning of February, Asian equity funds have attracted substantial inflows.
1 This article was prepared by the BIS Monetary and Economic Department. Questions about the article can be addressed to Aytek Malkhozov (aytek.malkhozov@bis.org) and Adrian van Rixtel (adrian.vanrixtel@bis.org). Questions about data and graphs should be addressed to Alan Villegas (alan.villegas@bis.org).
2 See D Domanski, H S Shin, M Lombardi and J Kearns, "Oil and debt", BIS Quarterly Review, March 2015, pp 55-65.
3 See Domanski et al, op cit.
4 See Domanski et al, op cit.