Buoyant yet fragile?
Markets remain buoyant despite mid-October's spike in the volatility of most asset classes. This sharp retreat in risk appetite reflected growing uncertainty about the global economic outlook and monetary policy stance, as well as increased geopolitical tensions. As selling pressure increased, market liquidity temporarily dried up, amplifying market movements.1
Markets rebounded quickly as economic concerns faded and some major central banks further eased monetary policy. In particular, the Bank of Japan and the ECB provided further stimulus, while the Federal Reserve ended its QE3 asset purchase programme. These opposing moves unsettled exchange rates, with the dollar appreciating against most other currencies.
These abrupt market movements were even more pronounced than similar developments in August, when a sudden correction in global financial markets was quickly succeeded by renewed buoyant market conditions. This suggests that more than a quantum of fragility underlies the current elevated mood in financial markets.
Growing signs of fragility
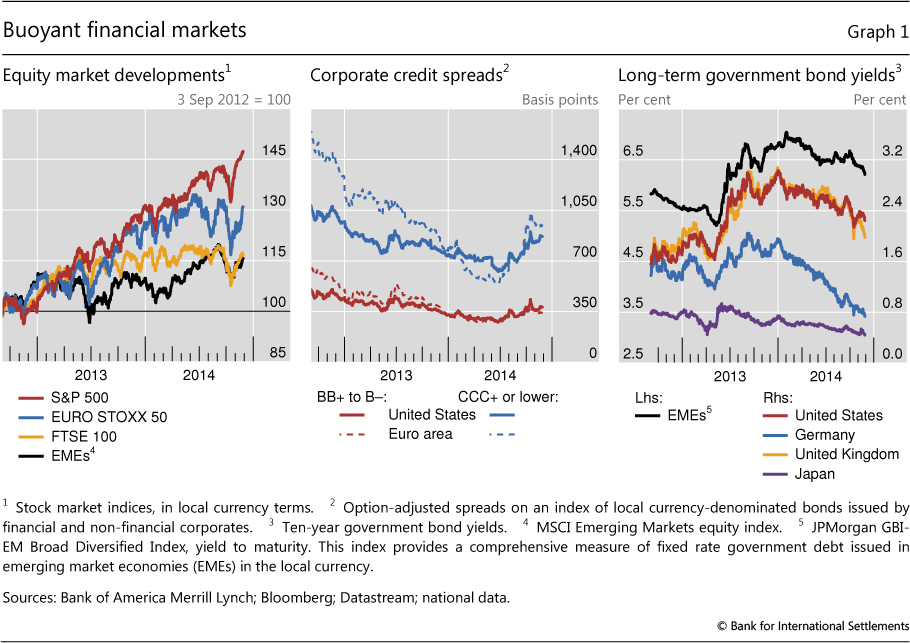
Intermitted by volatility spikes, markets have remained buoyant during the period under review. This prolonged a surge in global financial markets over the last two years, occurring against a backdrop of low growth and unusually accommodative monetary policies in advanced economies. Ample monetary stimulus fuelled investors' risk appetite and boosted a search for higher-yielding assets. Stock markets rallied during these two years, in particular in advanced economies (Graph 1, left-hand panel). Yields on high-yield corporate bonds narrowed (centre panel) and record low government bond yields pushed up valuations of risky assets (right-hand panel). The search for yield also revived structured finance and drove leverage loan markets to levels not seen since 2008 (Box 1).
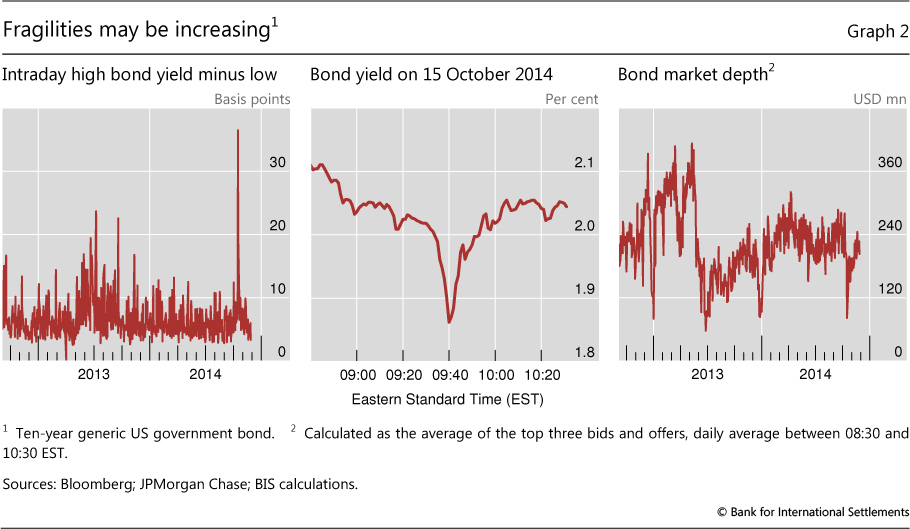
But recent developments suggest that markets are becoming increasingly fragile. Global equity markets plummeted in early August and mid-October (Graph 1, left-hand panel). Mid-October's extreme intraday price movements underscore how sensitive markets have become to even small surprises. On 15 October, the yield on 10-year US Treasury bonds fell almost 37 basis points (Graph 2, left-hand panel), more than the drop on 15 September 2008 when Lehman Brothers filed for bankruptcy. Market movements were particularly sharp during a 20-minute window when yields slipped and then rose by around 20 basis points (Graph 2, centre panel). These fluctuations were large relative to actual economic and policy surprises, as the only notable negative piece of news that day was the release of somewhat weaker than expected retail sales data for the United States one hour before the event.
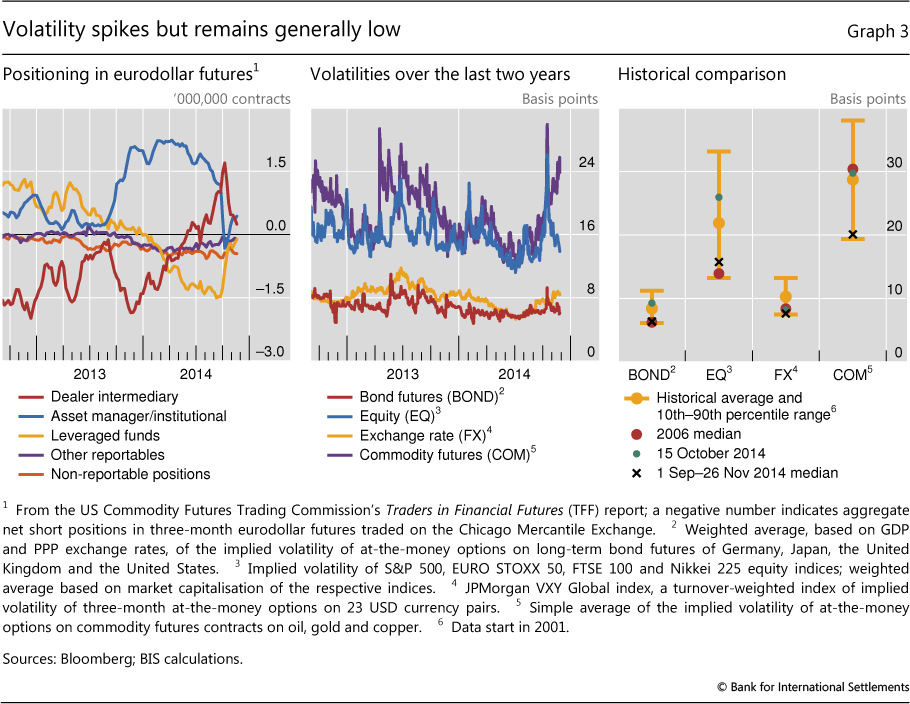
The initial shock was significantly amplified by deteriorating liquidity conditions. Since the beginning of the year, many leveraged investors (typically hedge funds) had positioned themselves for a rise in long-term rates by holding large net short positions in eurodollar futures (Graph 3, left-hand panel). They began to unwind these positions from late September onwards, yet exposures remained large by mid-October. And as some market participants tried to quickly shed more of these positions, liquidity evaporated, thereby magnifying the bad news (Graph 2, right-hand panel).
But markets rebounded quickly, and some asset classes reached new records by the end of November. Early support was provided by statements of US and UK central bank officials indicating that quantitative easing could be prolonged. Market confidence was then further bolstered by stronger than expected macroeconomic data, such as for US industrial production. From the end of October onwards, monetary policy was eased further in China, Europe and Japan, boosting US equity markets to new all-time highs (Graph 1, left-hand panel) and pushing long-run government bond yields to record lows in many euro area economies. Corporate credit spreads, however, remained above their summer lows (Graph 1, centre panel).
Box 1
Signs of recovery in structured finance and leveraged loan markets
Branimir Gruić, Adrian van Rixtel and Jhuvesh Sobrun
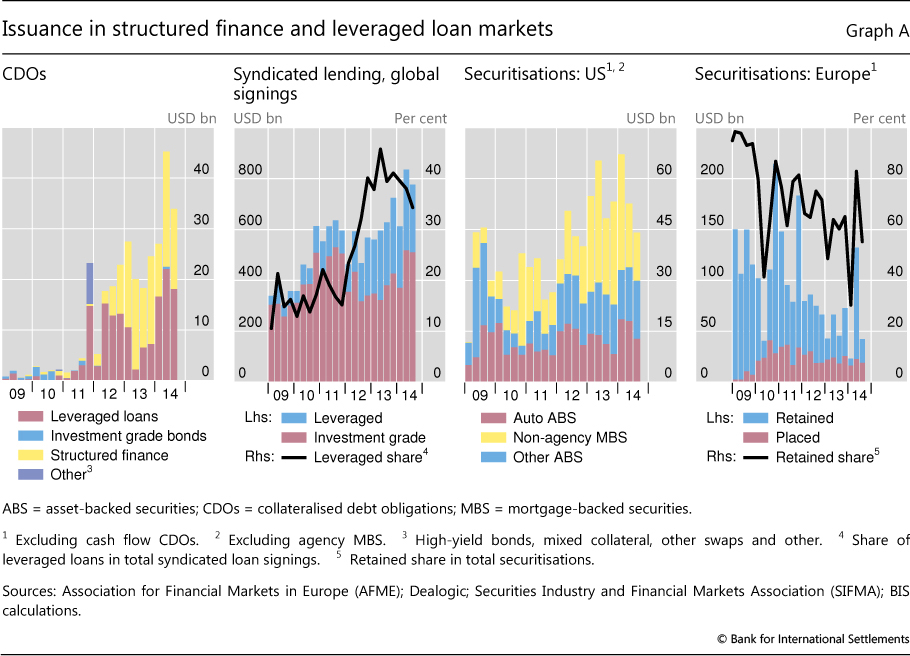
The search for yield revived segments of structured finance markets and drove leveraged loan issuance to unprecedented levels. Issuance of collateralised debt obligations (CDOs) recovered strongly in the first three quarters of 2014 (Graph A, left-hand panel). These instruments package portfolios of assets into a new security, offering higher yields with relatively diversified assets as collateral. Before the crisis, the bulk of CDOs were collateralised by asset-backed securities. Recently, around 55% of CDOs consisted of leveraged loans. Structured finance thus boosted the investor base for these loans, which accounted for approximately 40% of syndicated lending in recent years (Graph A, second panel). Activity in the leveraged loan markets even surpassed the levels recorded before the crisis: average quarterly announcements during the year to end-September 2014 were $250 billion, well above the average of $190 billion during the pre-crisis period from 2005 to mid-2007. In contrast, recent issuance volumes of CDOs remained well below the record high amounts issued in 2006 and 2007.
Securitisation markets have also shown signs of a revival in recent years, especially in the United States (Graph A, third panel). Total US securitisation issuance (excluding agencies) in the first three quarters of 2014 reached $164 billion, well above the levels during similar periods in 2009 and 2010. The increase was the most pronounced for non-agency mortgage-backed securities, reflecting improvements in US housing and mortgage markets. The recovery of securitisation markets has been much more subdued in Europe, where issuance between January and September 2014 increased compared with the same period in 2013, but remained significantly below the amounts issued in earlier years. But there has been an important change in the composition of issuance, as retained securitisations have given way to publicly placed issues (Graph A, right-hand panel). Retained issues are not placed in capital markets, but kept on the issuer's balance sheet for collateral purposes in central bank liquidity operations. The share of retained issues in total issuance fell from 97% in the first three quarters of 2009 to 56% over the same period in 2014, reflecting greater participation of private investors in European securitisation markets.
Changes in sentiment were reflected in sharp fluctuations of implied (forward-looking) volatilities of major asset classes. On 15 October, stock market volatility spiked to levels not seen in more than two years. Volatility in credit, commodity and foreign exchange markets also fluctuated markedly (Graph 3, centre panel). But given the rebound in optimism, the jump proved short-lived, so that most of the time volatilities (ie median volatilities) were low relative to historical benchmarks and roughly in line with developments in 2006 (Graph 3, right-hand panel).
Despite signs of heightened fragilities, the release of the ECB's comprehensive assessment on 26 October had little effect in an environment of improved market conditions. Based on their financial positions as of end-2013, the asset quality review and the stress test revealed an aggregate capital shortfall of €25 billion at 25 of the 130 participating institutions. But given the capital injections during this year so far, the current capital shortfall stands at €9.5 billion, distributed among 13 banks. Initial market reactions were neutral to positive. While the majority of banks covered by the ECB exercise witnessed a decline in equity prices on the first trading day after the disclosure of the results, by the end of the week quotes for most banks had recovered, with the exception of banks reporting large capital shortfalls.
Global divergence may heighten fragilities
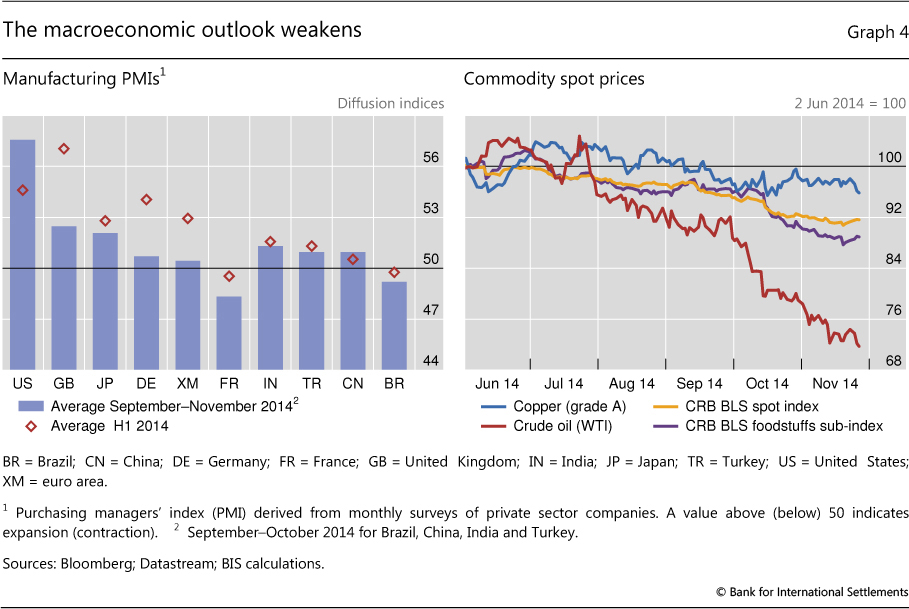
The recent bout of volatility in financial markets occurred in an environment of growing uncertainty about the global economic outlook and increasing geopolitical tensions. Manufacturing purchasing managers' indices (PMIs) indicated a loss of economic momentum, especially in Europe (Graph 4, left-hand panel). Markets were particularly surprised by data for Germany, where the widely watched Ifo Business Climate Index fell almost to a two-year low in October. Markets were also affected by the IMF's bleak forecast for the global economy that identified other weak spots, including Japan, China and major emerging market economies (EMEs). One major exception to this softer macroeconomic outlook was the United States, where recent data pointed to a more sustained recovery.
The prices of oil and other commodities continued to fall sharply (Graph 4, right-hand panel). This partly reflected weaker growth, but increasing supply seems to have been the key factor, at least for oil. Several major oil producers significantly increased production in recent months. On balance, the overall impact on the global economy of lower commodity prices is likely to be positive. Net commodity-importing countries in particular will benefit, through improvements in their current accounts and reduced energy subsidies. But commodity-exporting countries, especially those with weaker macroeconomic fundamentals, could be hit, contributing to negative market sentiment for countries like Brazil and Russia.
Diverging macroeconomic developments were reflected in diverging monetary policy actions. The Federal Reserve ended QE3 on 29 October. This programme boosted the Fed's balance sheet by nearly 60% to $4.5 trillion since September 2012, an increase of 25% relative to mid-2014 GDP. At the same time, the Fed kept the federal funds rate at the lower zero bound. Given that these policy actions were widely anticipated, they had no marked effect on asset prices, unlike last year's "taper tantrum".
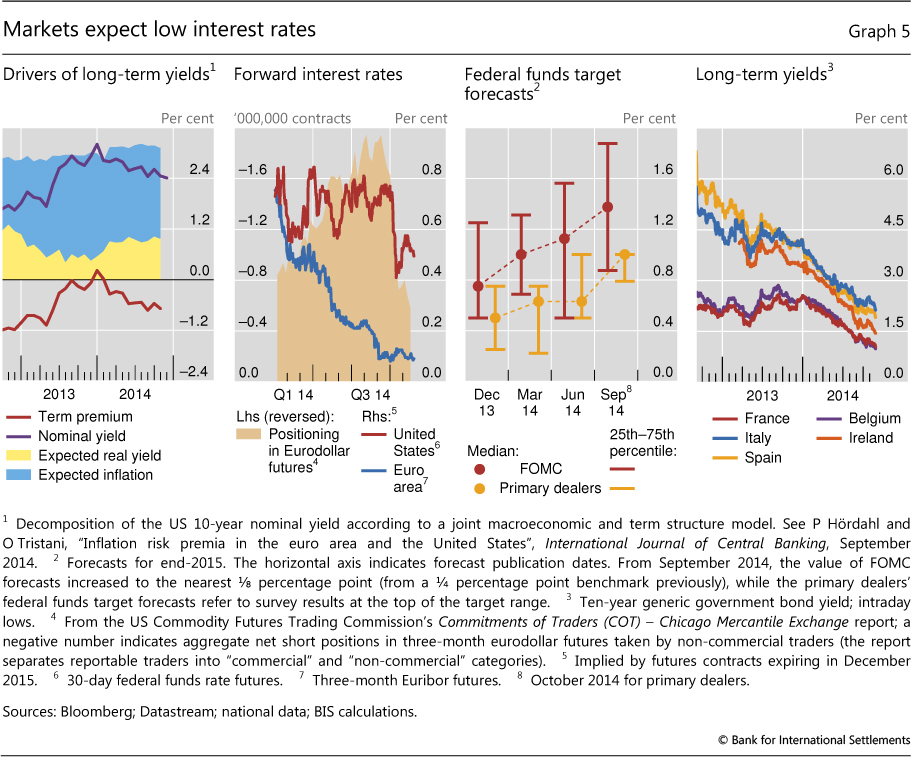
Despite the Federal Reserve's exit from QE3, estimates of the term premium on Treasury yields remained deep in negative territory and even declined further. On the 10-year Treasury bond they fell by more than 10 basis points from September to end-October 2014 (Graph 5, left-hand panel).
Market expectations of future US short-term interest rates also decreased. Forward rates for the end of 2015 fell (Graph 5, second panel), and similar developments were evident across the maturity spectrum. Particularly sharp adjustments occurred on 15 October, and they were not reversed during the actual end of QE3. Throughout the year, primary dealers have consistently and significantly forecasted lower future rates than members of the Federal Open Market Committee (Graph 5, third panel). A future alignment of expectations could raise the risk of abrupt adjustments.
In contrast to the Federal Reserve, the ECB loosened its monetary policy stance further. In early September, it lowered the interest rate on its main refinancing operations by 10 basis points to 0.05% and the rate on the deposit facility to -0.20%. In addition, the Governing Council announced it would purchase asset-backed securities with underlying assets consisting of claims against the euro area non-financial private sector and euro-denominated covered bonds issued by monetary financial institutions (MFIs) domiciled in the euro area. These programmes started in October and in November, respectively. Together with the series of targeted longer-term refinancing operations to be conducted until June 2016, these programmes are expected to bring the ECB's balance sheet back towards its early 2012 size. The balance sheet could thus increase by around €1 trillion - equivalent to 50% of its current size or around 10% of euro area GDP (as of mid-2014).
The main policy announcements in recent months were anticipated by markets and thus elicited little reaction. But long-term government bond yields fell to record lows for many euro area countries after a speech by ECB President Draghi on 21 November, which stressed that the ECB will do what is required to raise inflation and inflation expectation by adjusting the size, pace and composition of asset purchases, if the currently announced policies prove to be insufficient. This initiated a further decline in 10-year government bond yields, which fell to all-time lows for nine large euro area countries including France, Ireland and Spain by 26 November, the end of the period under review (Graph 5, right-hand panel).
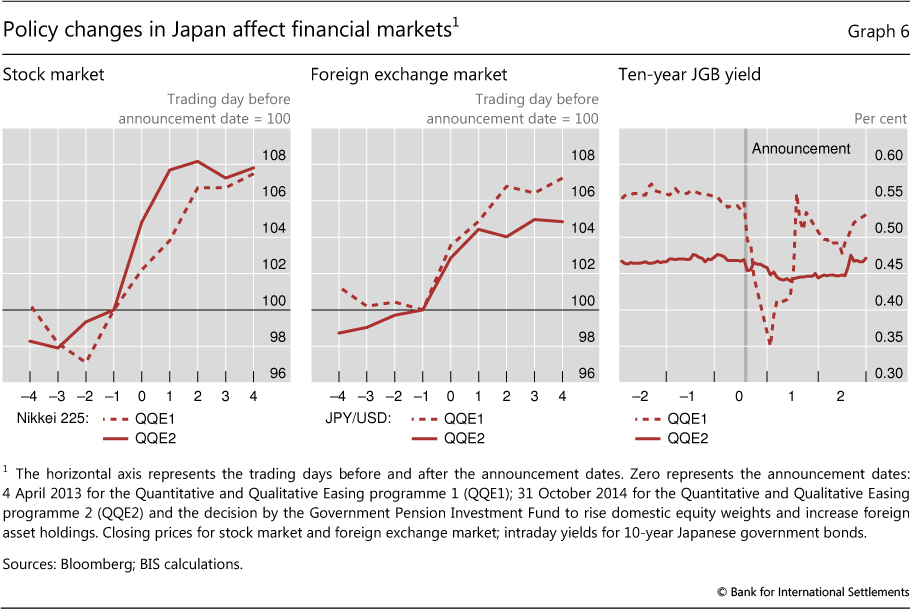
On 31 October, the Bank of Japan surprised markets by stepping up its Quantitative and Qualitative Easing (QQE) programme as it raised the central bank's target for enlarging the monetary base from ¥60-70 trillion to ¥80 trillion a year. If implemented, this will increase the Bank of Japan's balance sheet over the course of the next year by nearly 30%, or more than 16% of mid-2014 GDP. On the same day, the Government Pension Investment Fund (GPIF) announced a rise in domestic equity weights and an increase in foreign asset holdings for its portfolio.
Financial markets reacted strongly to the policy changes in Japan. On the announcement day, Japanese equity prices rose by almost 5% and the yen fell by around 3% against the dollar (Graph 6, left-hand and centre panels). These changes were either greater than or nearly at par with those on 4 April 2013 when QQE was introduced. In contrast, the impact on already low Japanese government bond yields was modest, perhaps reflecting market confidence that the extreme volatility in bond markets after the initial introductions of QQE would not be repeated (Graph 6, right-hand panel). Expectations that sales of Japanese government bonds by the GPIF would partially offset bond purchases by the Bank of Japan also played a role.
Against the backdrop of a slowdown in economic growth, the People's Bank of China cut its benchmark policy rates on 21 November after local markets had closed - the first such move since July 2012. The one-year benchmark lending rate was cut by 40 basis points to 5.6%, and the one-year benchmark deposit rate by 25 basis points to 2.75%. Rates for loans and deposits at different maturities were also lowered accordingly. Global markets responded positively to the news. Spot prices for crude oil immediately increased by 1.1%. On the following Monday, the CSI300 index - the equity index for the largest Chinese companies listed in Shanghai and Shenzhen - rose by 1.2%.
Opposing moves by the world's major central banks resulted in sharp exchange rate movements. The dollar appreciated against most currencies (Graph 7, top panels). Amongst advanced economy currencies, the yen was especially affected, not only on 31 October but throughout the period under review. This led to a sharp increase in the activity in the dollar/yen spot market, resulting in record turnover in global foreign exchange markets (Graph 7, bottom left-hand panel).
Most EME currencies also fell against the dollar, with the currencies of commodity importers depreciating less than those of commodity exporters (Graph 7, bottom right-hand panel). The Turkish lira, Indian rupee and Thai baht depreciated by less than 3% vis-à-vis the dollar over the last three months. The Korean won fell slightly further.
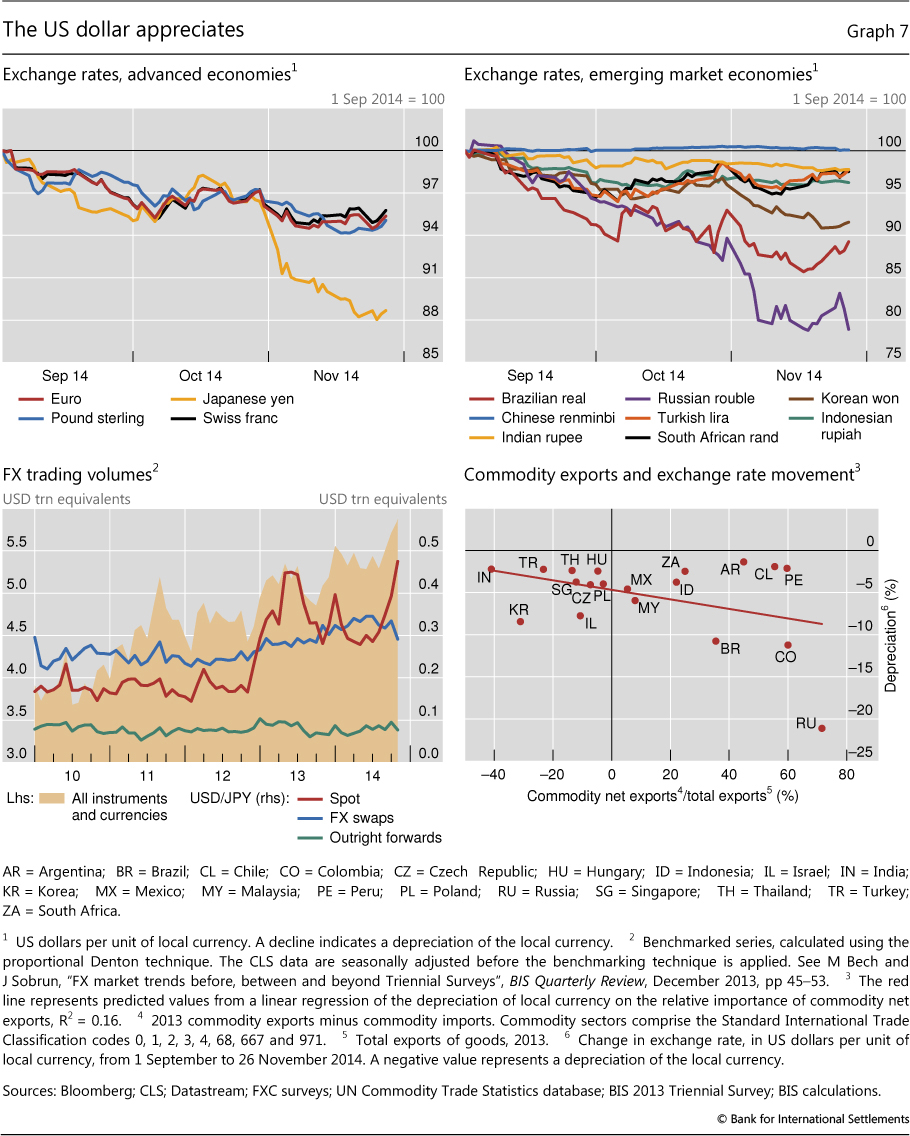
The combination of a strong dollar and weak commodity prices led to sizeable depreciations of the currencies of net commodity exporters. In some cases, these global factors interacted with country-specific vulnerabilities. For example, the Brazilian real depreciated amidst uncertainty associated with the presidential election and a general weak economic outlook. Economic sanctions against Russia and a worsening of the conflict in Ukraine led the rouble to plummet by more than 13% during September and October. To shore up its currency, the Russian central bank increased policy rates by 150 basis points on 31 October. But the downward pressure continued. The 5 November decision to reduce foreign exchange interventions to support the currency was followed by a 4% depreciation the next day. On 10 November, the central bank abandoned the rouble's trading corridor, allowing the currency to float freely, stabilising the exchange rate.
Box 2
The Shanghai-Hong Kong Stock Connect programme
Feng Zhu
On 10 April 2014, the China Securities Regulatory Commission (CSRC) and the Securities and Futures Commission (SFC) of Hong Kong SAR announced Shanghai-Hong Kong Stock Connect, a pilot programme aimed at establishing mutual stock market access between mainland China and Hong Kong. On 17 October, the CSRC and SFC signed a memorandum of understanding (MoU) and agreed on the principles and arrangements for cross-boundary regulatory and enforcement cooperation under the programme. On 10 November, the CSRC and SFC approved the launch of the Stock Connect on 17 November 2014.
The Stock Connect - also known as the "Through Train" - will allow trading of shares between the Shanghai Stock Exchange (SSE) and Stock Exchange of Hong Kong Limited (SEHK). In the Shanghai-to-Hong Kong "southbound trading link", mainland investors can trade in up to 266 eligible stocks listed in Hong Kong, up to a daily quota for (net) purchases of RMB 10.5 billion, and an aggregate quota of RMB 250 billion. The shares qualified for trading represent 82% of the SEHK's market capitalisation. In the Hong Kong-to-Shanghai "northbound trading link", global investors can trade in up to 568 eligible stocks listed in Shanghai, up to a daily quota for (net) purchases of RMB 13 billion, and an aggregate quota of RMB 300 billion, with the shares qualified for trading representing 90% of the SSE's market capitalisation. The quotas constrain only buy orders; sell orders are always allowed. The quotas are open to future adjustments.
The programme needs to ensure that brokers comply with the rules and regulations in two very different markets. Preparing and streamlining operations for the Stock Connect brought significant challenges and required extensive cooperation by the respective regulators. One major issue was taxation. On 14 November, China's Finance Ministry, State Administration of Taxation and the CSRC announced that capital gains levies would be waived for an unspecified period for northbound investors, and for three years for southbound individual investors. Investors on both sides would be exempt from the business taxes on stock trading.
The Stock Connect can be an important landmark for China's capital account liberalisation process. The SSE has the seventh highest market capitalisation in the world, with $2.96 trillion at the end of October 2014, yet it remains relatively closed. Foreign institutional investors could only access China through the Qualified Foreign Institutional Investor (QFII) and RMB QFII (RQFII) programmes under an existing MoU between the firm's home nation and China; these require regulatory approval and are subject to strict, individually granted trading quotas. The Stock Connect represents a significant addition to the existing programmes, and opens up China's capital markets to an unprecedented degree:
- While the existing schemes focus on one-way flows, the Stock Connect relaxes restrictions on capital flows in both directions: northbound trading is open to all investors, and southbound trading to mainland institutional investors and individual investors with securities and cash balances of at least RMB 500,000.
- Northbound trading will be quoted in renminbi but settled in offshore renminbi, and southbound trading will be quoted in Hong Kong dollars but settled in onshore renminbi. Trading and settlement in renminbi will encourage its further use.
- At RMB 1.1 trillion, Hong Kong's liquidity pool consisted of renminbi deposits and certificates of deposit, and was large enough to meet the projected demand under the Stock Connect. Yet the People's Bank of China moved to abolish the daily RMB 20,000 per person conversion cap for Hong Kong residents, effective on 17 November. This would facilitate their participation and encourage local financial institutions to introduce more renminbi investment products. But renminbi transfers to onshore bank accounts remain subject to a daily limit of RMB 80,000 per person, limiting the likely impact on cross-boundary capital flows.
- Mainland firms not participating in the Qualified Domestic Institutional Investor programme can now raise funds globally, as their shares become accessible to global investors under the new programme.
- Compared to the QFII and RQFII programmes, trading via the Stock Connect has no lockup or repatriation restrictions.
The Stock Connect has been expected to narrow the price differences for shares of Chinese companies listed in both markets, ie the A shares listed on mainland exchanges, and the H shares listed in Hong Kong. The shares are traded separately, with heavy restrictions on foreign access to A shares, and investors' ability to arbitrage the two markets was limited. As the widely anticipated launch of the Stock Connect neared, the price differences between the A and H shares narrowed significantly over the third quarter of 2014, briefly achieving parity in early October (Graph B, left-hand panel). When the launch date was confirmed on 10 November, the price discount on A shares quickly turned into a premium, reflecting investors' strong demand for those shares. Indeed, initial trading was lopsided, with the northbound trading volume hitting the daily quota limit by 14:00 local time on the first day, while southbound trading ended the day reaching RMB 1.768 billion, just 17% of the quota (Graph B, centre panel). Trading volumes declined in the following days; the daily quota used by northbound investors dropped to 17.5% on 20 November, but stabilised towards 25% on day 26 after a strong rebound on day 24. Several factors might have contributed to weak trading, eg investors' unfamiliarity with the new system, lack of expertise on A and H shares, and concerns over adequate investor protection.
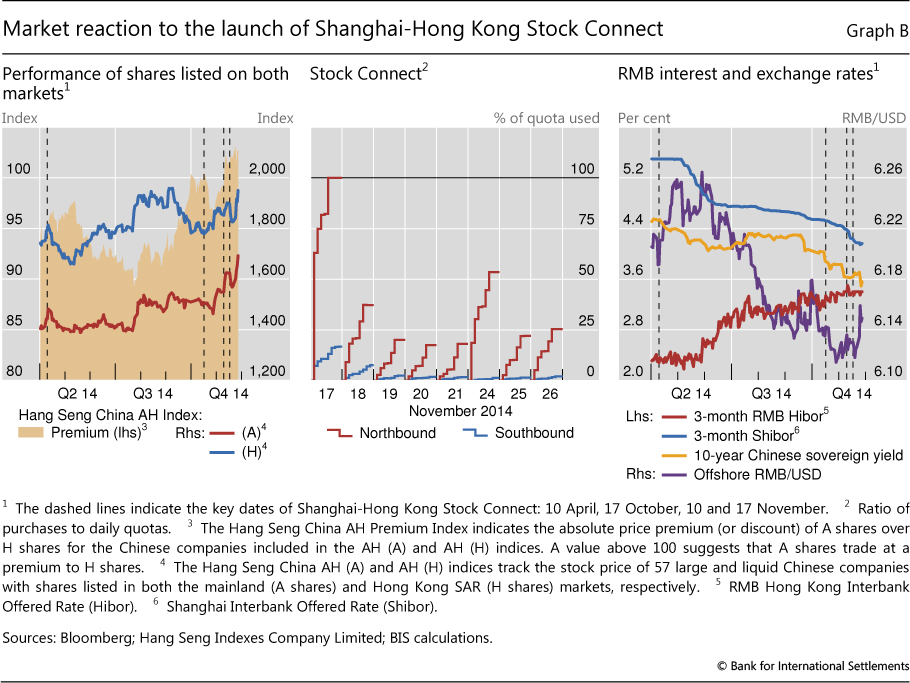
The effects of the Stock Connect may spill over to other assets, despite the fact that both funds and securities stay in the "closed loop" of the two settlement systems: once a northbound investor sells her A shares bought through the Stock Connect, the resulting funds go back to her bank account in Hong Kong. She will not be able to use the proceeds to invest in other types of mainland assets. Even so, QFII and RQFII investors can now free up part of their quotas originally destined for equities to invest in eg fixed income assets. In fact, the 10-year Chinese government bond yield fell following the major announcements (Graph B, right-hand panel). In addition, the gap between onshore and offshore renminbi interest rates has narrowed since May 2014. Yet initial weak Stock Connect trading contributed to a rise in the offshore RMB/USD rate as renminbi enthusiasm waned.
So far, the Stock Connect has operated smoothly. As currently designed, it applies only to equities traded on the two exchanges, although in principle trading quotas could be increased and the programme expanded to other exchanges, instruments and asset classes. Ultimately, the Stock Connect may encourage a convergence of market rules, accounting and information disclosure standards between the SEHK and mainland exchanges. The Stock Connect is also expected to bring greater transparency to the mainland market and enhance corporate governance at Chinese firms.
Figures quoted in this paragraph are as of March 2014.
The appreciation of the dollar against the backdrop of divergent monetary policies may, if persistent, have a profound impact on the global economy, in particular on EMEs. For example, it may expose financial vulnerabilities as many firms in emerging markets have large US dollar-denominated liabilities.2 A continued depreciation of the domestic currency against the dollar could reduce the creditworthiness of many firms, potentially inducing a tightening of financial conditions.
1 This article was prepared by the BIS Monetary and Economic Department. Questions about the article can be addressed to Mathias Drehmann (mathias.drehmann@bis.org) and Adrian van Rixtel (adrian.vanrixtel@bis.org). Questions about data and graphs should be addressed to Alan Villegas (alan.villegas@bis.org).
2 M Chui, I Fender and V Sushko, "Risks related to EME corporate balance sheets: the role of leverage and currency mismatch", BIS Quarterly Review, September 2014, pp 35-47.