The credit default swap market: what a difference a decade makes
Over the last decade, the size and structure of the global credit default swap (CDS) market have changed markedly. With the help of the BIS derivatives statistics, we document how outstanding amounts have fallen, central clearing has risen and the composition of underlying credit risk exposures has evolved. Netting of CDS contracts has increased, due to the combination of a higher share of standardised index products and the clearing of such contracts via central counterparties. In turn, this has led to a further reduction in counterparty risk. Underlying credit risks have shifted towards sovereigns and portfolios of reference securities with better credit ratings. The distribution of credit risks across counterparty categories has remained broadly unchanged.1
JEL classification: G23, G28.
After its inception in the early 1990s, the credit default swap (CDS) market saw a steady increase in volumes, followed by a rapid surge in growth in the run-up to the Great Financial Crisis (GFC) of 2007-09.2 The size of the market and the role it played in the crisis led to calls for strengthened transparency and resilience (CGFS (2009)).
Since then, the market has undergone a series of important changes. Market participants have reduced their exposures and eliminated redundant contracts - a process that started before the GFC but intensified in its immediate aftermath. Post-crisis reforms have included standardisation of contracts, expanded reporting requirements, mandatory central clearing and margin requirements for a wide range of derivatives (FSB (2017)).
This feature builds on BIS derivatives data to take stock of developments in the CDS market from the GFC to end-2017. The emphasis is on the more recent, and ongoing, changes, notably those reflecting the decline in inter-dealer positions and the rise of central counterparties (CCPs). In the first section, we document the continuous decline in outstanding notional amounts. We argue that, in the immediate aftermath of the GFC, this was mostly driven by the compression of contracts and the reduction of exposures. In the second section, we turn to the growth of CCPs, which have been a key factor in shaping more recent market developments. Clearing penetration is higher in the multi-name market, and clearing is highly concentrated on a handful of CCPs. The third section analyses how the underlying risks have shifted and argues that the combination of a rapidly rising share of standardised index products and increased clearing via CCPs has helped to reduce counterparty risks. We also document that credit risks have not concentrated at any specific type of counterparty.
Key takeaways
- Outstanding notional amounts of credit default swap (CDS) contracts fell markedly, from $61.2 trillion at end-2007 to $9.4 trillion 10 years later. During the Great Financial Crisis (GFC) and its aftermath this was driven by compression, whereas in recent years it appears to have been driven by the rise of central clearing.
- The share of outstanding amounts cleared via central counterparties has risen rapidly, from 17% in mid-2011 to 55% at end- 2017, while the share of inter-dealer trades has fallen, from 53% to 25%. Box A discusses different measures of clearing rates.
- The share of CDS underlying credits rated investment grade has risen post-GFC, to 64% at end-2017. The share of CDS on sovereign entities has also risen (16% as of end-2017).
- Reporting dealers continue to be net buyers of CDS protection ($258 billion at end-2017). Hedge funds have markedly reduced their net purchases of protection from dealers, to $16 billion at end-2017.
- Box B reviews global residential property price developments, using data compiled by the BIS.
The global CDS market: rapid expansion and steady decline
The BIS monitors derivatives markets through several data sets (Wooldridge (2016)). The semiannual over-the-counter (OTC) derivatives statistics provide a regular, comprehensive and global overview. These data capture the consolidated positions of about 70 banks and other reporting dealers based in 12 countries (ie each dealer reports the positions of all entities worldwide belonging to its corporate group). As the CDS market tends to be concentrated (Stulz (2010), Abad et al (2016)), these data are representative of global activity. An even more comprehensive view of the market emerges every three years from the Triennial Central Bank Survey. The most recent instalment, in 2016, compiled OTC derivatives data from more than 400 reporting institutions in 46 countries. The survey data showed that the dealers reporting to the semiannual statistics covered more than 99% of the global CDS market at end-June 2016.3
After an almost tenfold increase in the run-up to the GFC, the global CDS market has shrunk virtually without interruption since. In terms of notional amounts outstanding, the market has seen a continuous decline after peaking at roughly $61.2 trillion at end-2007 (Graph 1, left-hand panel; see also online interactive graphs). A similar pattern can be observed for the gross market value of outstanding positions, which capture the cost of replacing contracts at market prices prevailing on the reporting date. Whereas notional amounts reflect the maximum potential counterparty exposure of the protection seller to the protection buyer, gross market values provide an indication of current credit risk exposures.4
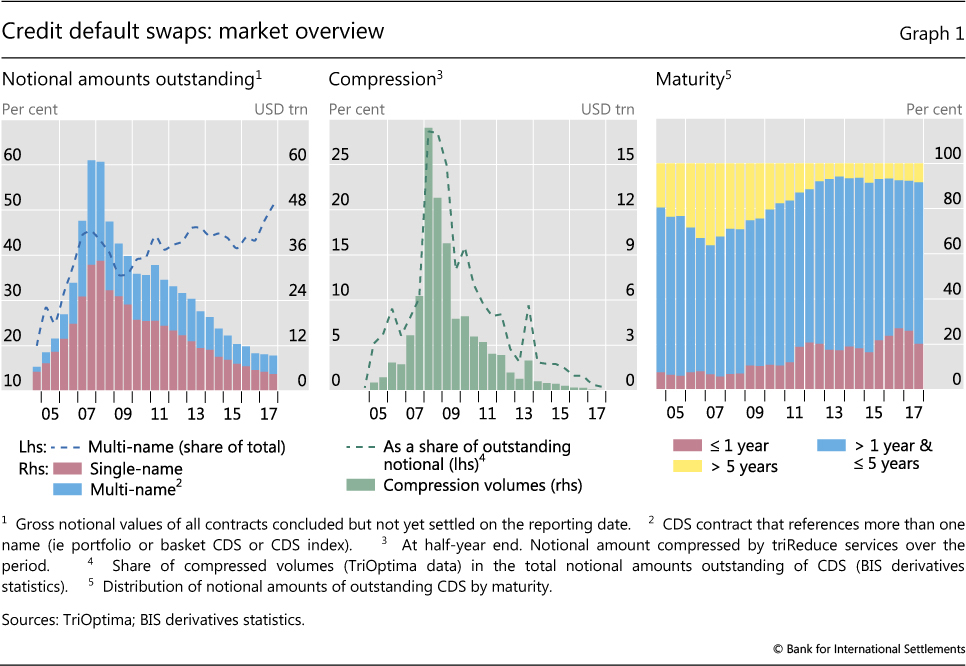
The post-GFC decline has been broad-based, as seen in the simultaneous reduction of both single-name and multi-name contracts.5 In the years immediately before and after the crisis, compression of bilateral and multilateral portfolios accounted for a large share of the decline in notional amounts outstanding.6 Compression is a technique through which two or more counterparties tear up existing contracts and replace them with new ones. This reduces both the number of contracts and gross notional amounts while keeping net exposures fixed. Since the immediate post-crisis period, compression outside CCPs has been less common, as it declined substantially from its peak in 2008 (Graph 1, centre panel).7
The market has also become increasingly standardised, reflecting the spread of documentation standards such as the "Big Bang" and "Small Bang" initiatives in 2009 (Augustin et al (2014)). In particular, contract maturity is concentrated around the five-year mark (Abad et al (2016)). Contracts with maturities beyond five years have steadily declined post-GFC (Graph 1, right-hand panel).
The rise of central counterparties
The reduction in notional amounts outstanding has been most pronounced in inter-dealer positions. While these used to dominate the market (Peltonen et al (2014), D'Errico et al (2018)), outstanding inter-dealer positions shrank from around $17.7 trillion in mid-2011 to $2.3 trillion at end-2017. Inter- dealer positions fell faster than the overall market in recent years, declining from 57% of outstanding notional at end-2011 to just 25% at end-2017 (Graph 2, left-hand panel).
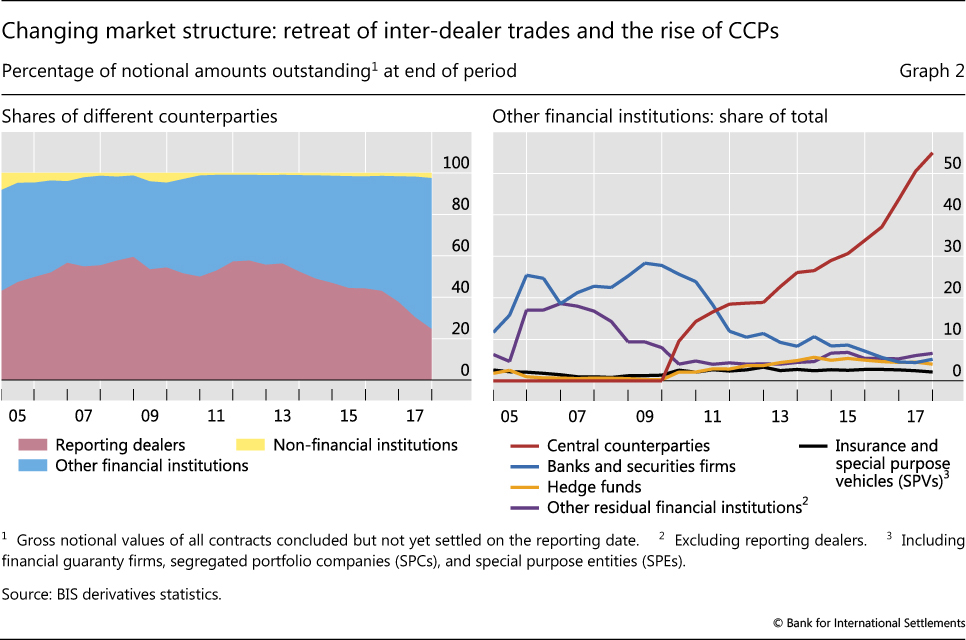
The decline in inter-dealer positions has coincided with the rise of CCPs, as the share of dealers' positions vis-à-vis CCPs has grown at a remarkable pace. At end-December 2017, the reported amount reached 55% of outstanding notional amounts (Graph 2, right-hand panel), although this figure is likely to overestimate the actual share of cleared outstanding contracts (Box A). The share of positions with non-dealer banks peaked at around 30% during the GFC and has since declined continuously.
This suggests that CCPs are likely to have been a key driver behind the reduction in inter-dealer positions and notional amounts outstanding in recent years. In principle, the reductions could be driven by: (i) the interposition of a CCP as a counterparty between dealers ("novation"); (ii) a reduction in notional through multilateral netting by CCPs; and/or (iii) a contraction in underlying inter-dealer activity.
Box A
Calculating clearing rates in BIS derivatives statistics
The calculation of clearing rates - the proportion of contracts cleared through CCPs - may seem straightforward, but several complications arise. One fundamental issue relates to whether to use trading activity or outstanding contracts (ie flow or stock data). Clearing rates based on trading activity, such as turnover, can better capture the degree of clearing of current contracts. However, such data overweigh short-term contracts, which are turned over more frequently. For the CDS market, the BIS covers only outstanding contracts.
A second issue is how to address the double-counting of dealer contracts that are novated to CCPs. In the BIS derivatives statistics, dealers report outstanding contracts by counterparty type. Thus double-counting of inter-dealer positions, including cross-border inter-dealer trades, can be eliminated. However, indirect inter-dealer trades - ie those that are novated to a CCP - are still counted twice. Novation effectively replaces one inter-dealer trade with two dealer-to-CCP trades. Since a CCP typically acts as a counterparty to two dealers, counting each dealer's position with the CCP again introduces double-counting. Ignoring this problem, the clearing rate for the CDS market was 55% at end-December 2017, which can be treated as an upper bound (Graph A1, left-hand panel). Dividing the positions with CCPs by two yields an adjusted minimum clearing rate, as it assumes that all positions with CCPs are initially inter-dealer contracts. This lower bound on the clearing rate was around 38% at end-December 2017.
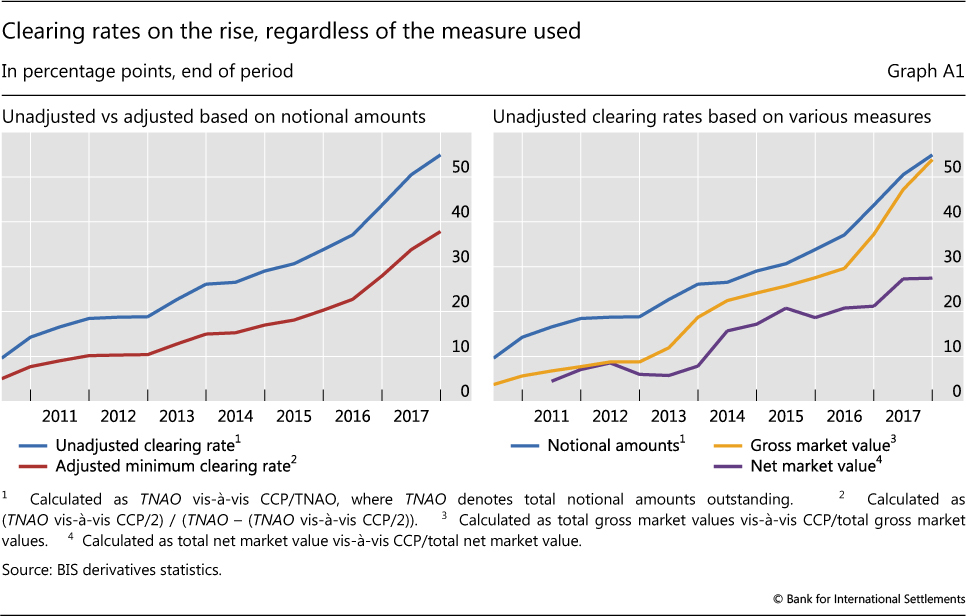
A third issue is the choice of inputs used to measure clearing rates for outstanding contracts, such as notional amounts, gross market values or net market values. Notional outstanding amounts are a natural, and indeed the most common, choice for computing clearing rates based on outstanding contracts. But using market values instead can provide interesting insights. Gross market values, for instance, are a closer measure of the amount that might be lost in a credit event. If credit risk shrinks, so does the market value of the contract. Net market values, in addition, take into account legally enforceable netting agreements (among CDS contracts and not considering collateral), which further reduces values. Yet market values may introduce a downward bias in clearing rates. Newer, standardised contracts, which have zero market value at inception, are likely to be cleared, whereas legacy and bespoke contracts are more likely to be in the money (ie have a high market value) and less likely to be cleared. While all the different measures yield a rising trend in clearing rates, the steepness of the trend differs (Graph A1, right-hand panel). Recently, clearing rates based on notional amounts and gross market values have converged, as uncleared legacy contracts with high market values have been maturing. Using net market values yields significantly and persistently lower clearing rates, as netting is more common for cleared contracts.
This is the most realistic of the two extreme assumptions, as the clearing members of the CCPs engaged in CDS clearing are a subset of BIS reporting dealers. Therefore, for the CDS market at least, the minimum estimated clearing rate is likely to be very close to the actual one.
Novation replaces a single inter-dealer trade with two offsetting trades between the respective dealers and the CCP. This mechanically reduces the share of inter-dealer trades. However, this effect can explain only a relatively small portion of the decline in inter-dealer positions (13% out of the 86% total decline in notional amounts between end-2011 and end-2017).
Netting by CCPs is likely to account for much of the remaining decline in outstanding notional amounts. CCPs net offsetting positions across counterparties, thereby reducing reported gross notional amounts outstanding - in a similar fashion to the workings of compression around the GFC. Dealers have regulatory incentives to take advantage of opportunities for netting, as it reduces margining requirements and alleviates leverage ratio constraints.
Trading activity may also have contributed to the overall decline in notional amounts outstanding, but probably to a smaller extent. Underlying trading activity, especially for index products, does not seem to have declined substantially.8 Furthermore, other indicators also point to sustained market activity: liquidity has improved (Loon and Zhong (2014, 2016)), and pricing anomalies reflecting thin markets such as the CDS-bond basis have disappeared (Markit (2016)).9
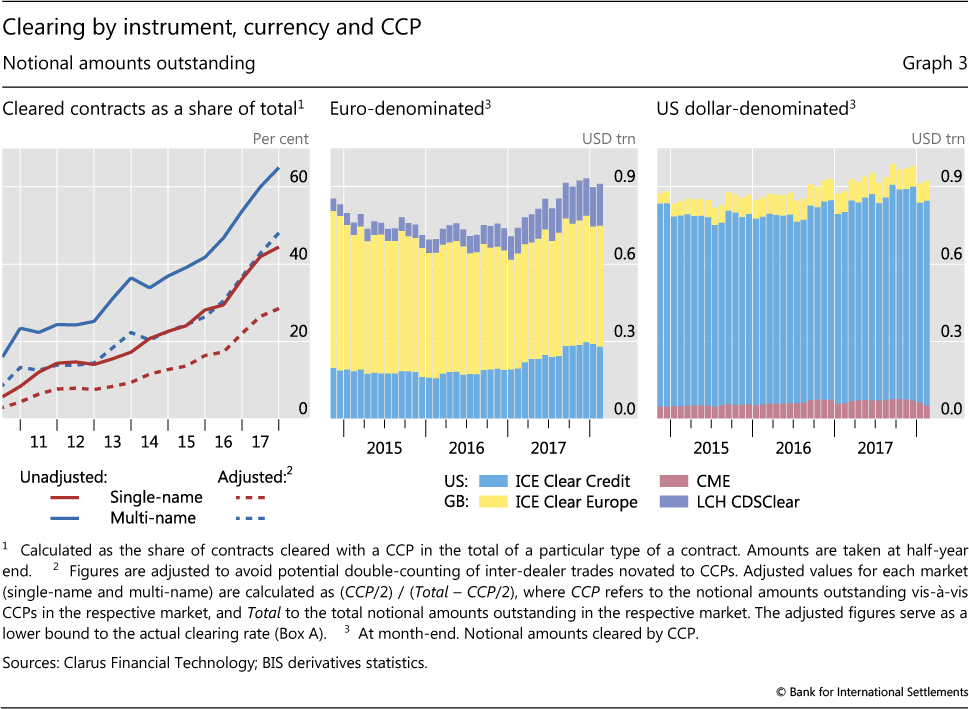
The penetration of clearing has been highest in the multi-name market (Graph 3, left-hand panel), which consists predominantly of CDS indices. At end-December 2017, the share of all single-name contracts (in terms of notional amounts) cleared with CCPs stood at 44%, compared with 65% for multi-name contracts.10 Multi-name contracts are more standardised, hence easier to clear. Furthermore, in key jurisdictions, such as the United States and the European Union, clearing of CDS index products has become mandatory. In the United States, single-name CDS products have generally remained outside the scope of post-crisis reforms designed to increase central clearing such as central clearing requirements and margin requirements for bilateral uncleared trades (FSB (2017)).
The clearing of CDS contracts is highly concentrated among a small number of major CCPs. ICE Clear Europe, based in the United Kingdom, followed by ICE Clear Credit, based in the United States, dominate euro-denominated contracts (Graph 3, centre panel). LCH CDS Clear has also made inroads into this segment in recent years. ICE Clear Credit, in turn, dominates the dollar segment (Graph 3, right-hand panel).11 Some CCPs specialise in contracts in certain currencies, such as the CME in US dollars or JSCC in Japanese yen.12
Where have the risks shifted to?
The overall decline in global outstanding CDS contracts has coincided with significant compositional shifts in risk exposures. CDS entail exposure to two types of risk: the underlying credit risk of the reference entity and the counterparty risk faced by the CDS protection buyer. We argue that, on balance, both types of risk have diminished. Underlying credit risks have shifted towards sovereigns and portfolios of underlying reference securities with overall better credit ratings. The rise of CCPs and the increased standardisation in the CDS market have facilitated the netting of exposures. This, in turn, has helped to lower counterparty risks. Despite these structural changes, credit risks have not concentrated at specific counterparty types.
Underlying reference entities
Outstanding notional amounts on sovereign entities increased substantially in the aftermath of the GFC and during the euro area crisis, from around $1.6 trillion (3.4% of the market) in mid-2007 to around $3.3 trillion (13.3%) at mid-2013 (Graph 4, left-hand panel). The timing of this increase points to the role of growing solvency concerns in the euro area in late 2011 and the first half of 2012. In addition, a ban on short sales of European sovereign debt, introduced by Germany in May 2010 and permanently adopted by the European Union in November 2012, may have nudged investors towards replicating these exposures by buying CDS contracts instead.13 The share of sovereign reference entities in the overall market continued to rise, reaching around 16% at end-2017, even though gross notional amounts declined.
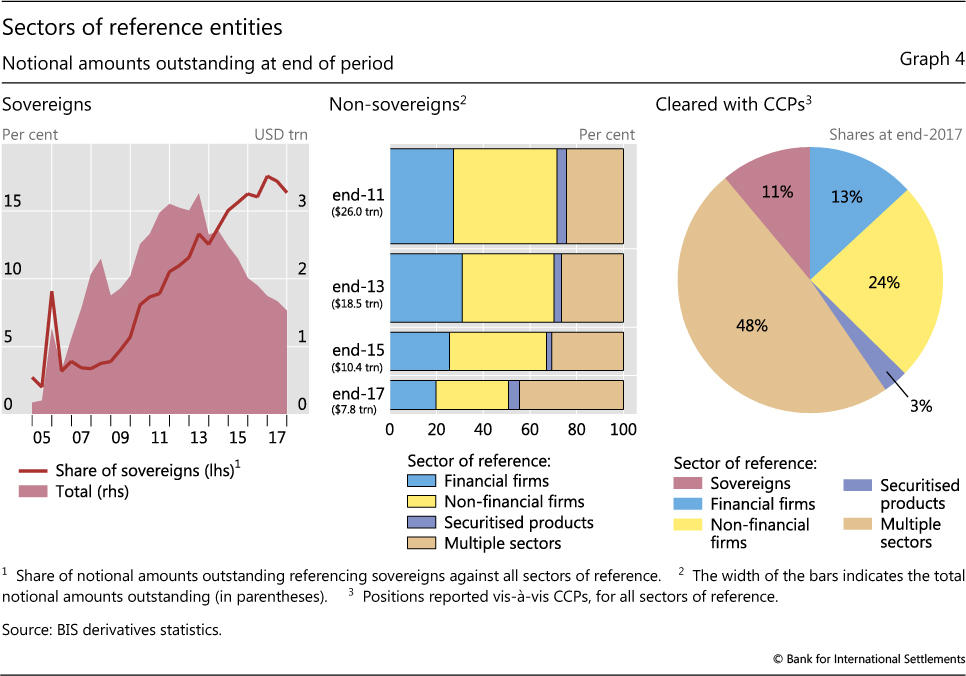
Despite the growth of CDS on sovereign entities, those on non-sovereign names still make up the majority of the market. Within the non-sovereign segment, the rise of index products has shifted credit risk exposures away from individual financial and non-financial firms (Graph 4, centre panel).14
The post-crisis shift towards sovereign and index products went hand in hand with an overall improvement in the credit quality of the underlying reference entities. The share of outstanding notional amounts with investment grade underlying credits increased from 42% at end-2007 to 64% at end-2017 (see online interactive graphs).
Counterparty risk: standardisation, CCPs and netting
A significant factor behind the rise of index products was the post-GFC drive to reduce counterparty risks through standardisation (Vause (2010)). Standardisation increases the likelihood of a counterparty holding a CDS position with exactly offsetting cash flows, which facilitates netting. The resulting reduction of net credit exposures can be especially large for major CDS dealers, which by the nature of their business tend to have large gross but small net exposures. Clearing via CCPs has widened the scope for netting further, as it enables netting across different counterparties (Graph 4, right-hand panel).15
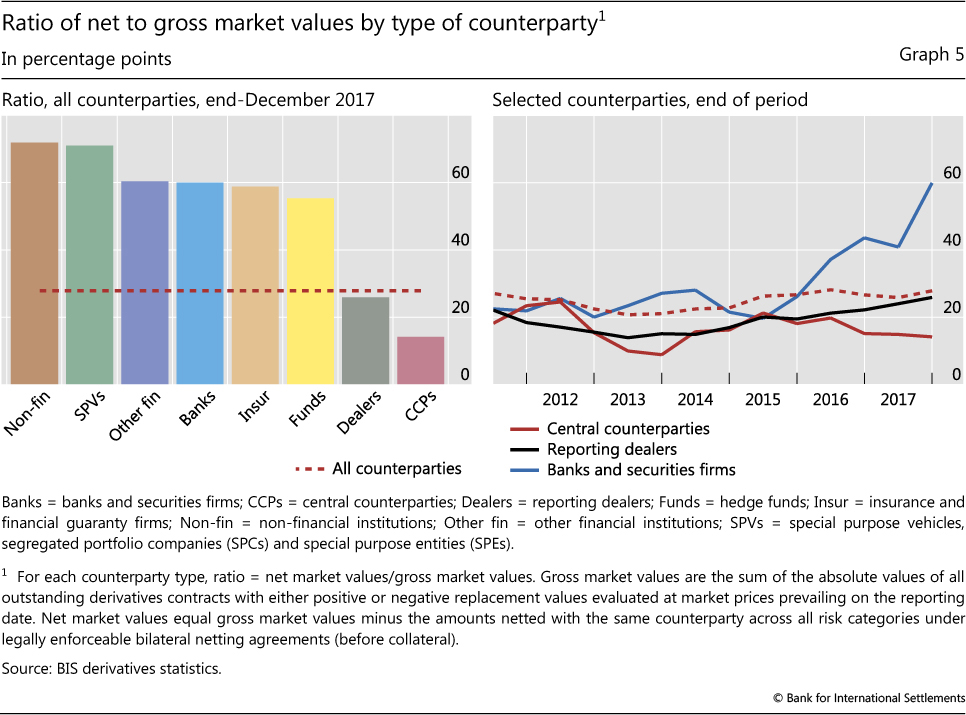
The ratio of net to gross market values of CDS contracts sheds light on the incidence of netting. Net market values16 adjust gross market values for legally enforceable bilateral netting (not taking into account any posted collateral). The lower the ratio of net to gross market values, the higher the degree of netting.
CCPs and dealers boast the lowest ratios - that is, the highest implicit rate of netting (Graph 5, left-hand panel). For bilateral trades with other counterparties that are not CCP clearing members, netting appears to be significantly lower.17 Indeed, the emergence of CCPs appears to have reduced netting activity by (non-reporting) banks and securities firms over time (Graph 5, right-hand panel).
On balance, CCPs and standardisation have helped to reduce credit and counterparty risk. Gross exposures have shrunk as the scope for cross-counterparty netting of cleared and standardised contracts has widened. While counterparty risks are now absorbed by CCPs, several safety buffers to reduce those risks have been put in place, such as default funds, multiple levels of margin requirements, and equity and reserve requirements for CCPs.
Credit risk shifting across counterparties
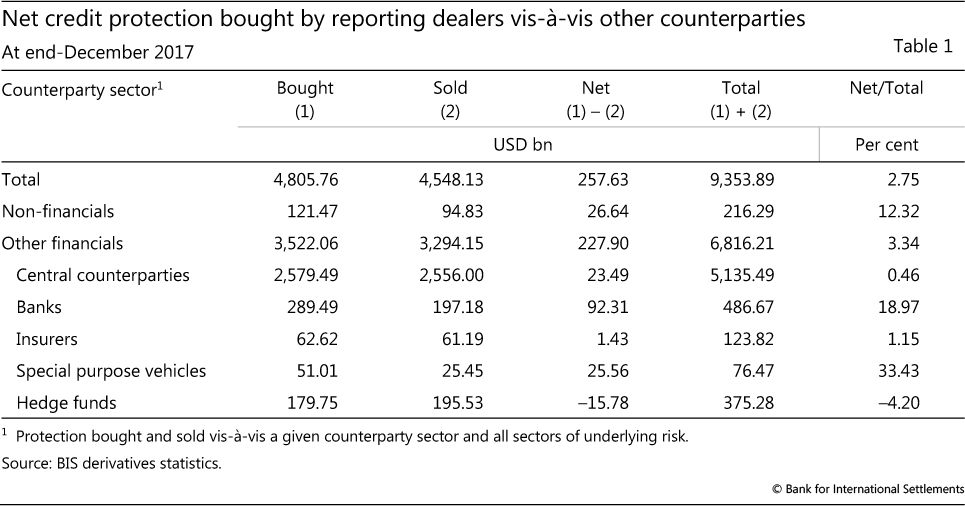
Despite the structural changes in the market, the distribution of exposures across counterparties has remained fairly stable and has not concentrated at specific counterparty types. Reporting dealers continue to be net buyers of protection, which is likely to reflect trading inventories to fulfil their market-making role but also serves to insulate them from adverse effects in case of credit events. With the retreat of monoline insurers from the CDS market, other financials - in particular non-reporting banks - have been absorbing most of those credit risks. Their ratio of net protection bought to total CDS positions is, however, relatively small (Table 1, last column). Non-financial counterparties have also been significant net absorbers of credit risks; but their CDS market share is much smaller (2% at end-2017). The ratios in the last column of Table 1 have been broadly constant post-GFC.
Hedge funds continue to be net buyers of protection from dealers, in particular for single-name CDS. This is likely to be related to arbitrage opportunities that arose around the GFC and the euro area crisis (the negative CDS-bond basis; see Augustin et al (2014) and Gyntelberg et al (2017)). As basis spreads have narrowed in recent years, hedge funds have markedly reduced their net purchases of CDS protection vis-à-vis reporting dealers from around $307 billion (32% of hedge funds' outstanding amounts) at end-June 2011 to $15.8 billion (4.2%) at end-2017 (Table 1, last row).18
Box B
Global real housing prices
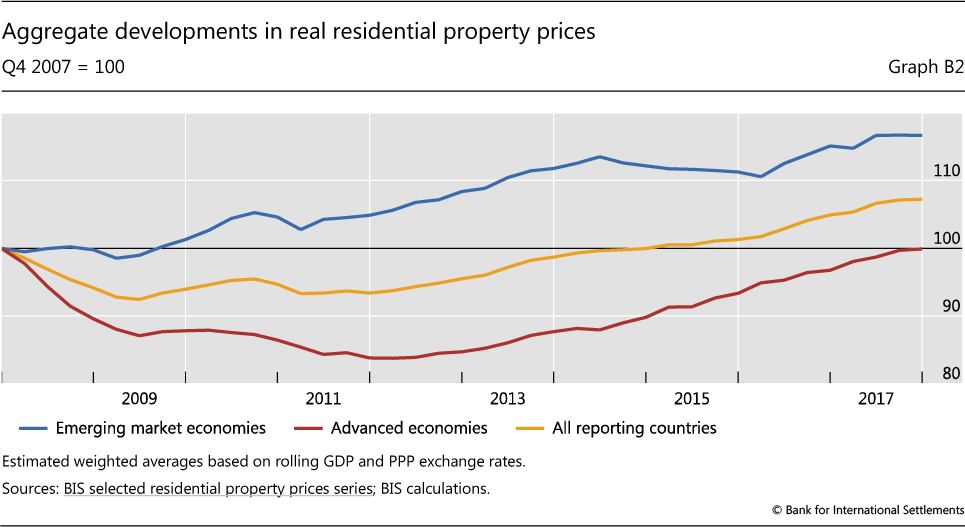
Global real residential property prices increased by 2% from end-2016 to end-2017, to stand 7% above their pre-Great Financial Crisis (GFC) level.
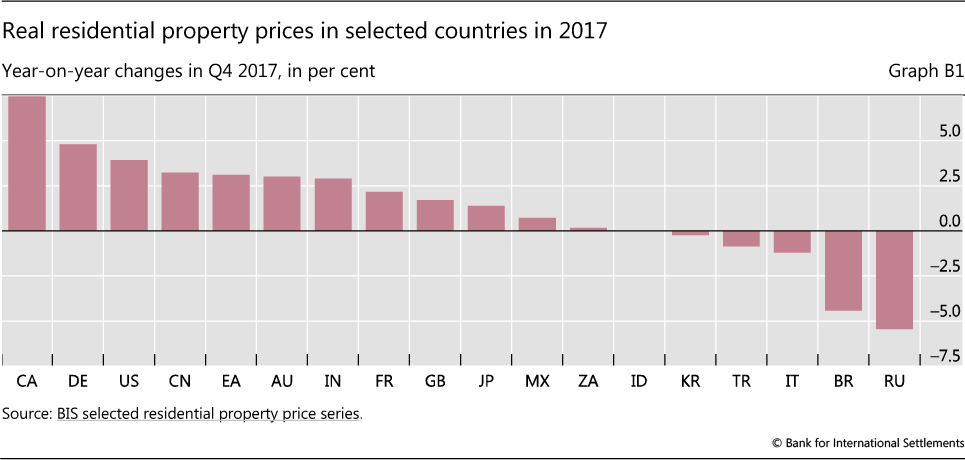
In advanced economies (AEs), prices grew by 5% on average in nominal terms and 3% in real terms - ie deflated by the CPI - from end-2016 to end-2017. The rise was particularly marked in Canada; prices rose more moderately in Australia, the United States and the euro area as a whole (Graph B1). Among the euro area countries, real property prices increased significantly in Germany, Ireland and Spain but fell slightly in Italy. Prices increased only slightly in Japan and the United Kingdom.
Turning to emerging market economies (EMEs), prices increased by only 4% in nominal terms and 1% in real terms in 2017. Compared with 2016, real prices decelerated significantly in China and India and broadly stabilised in Indonesia, Korea, Mexico and South Africa. They continued to fall markedly in Brazil and Russia.
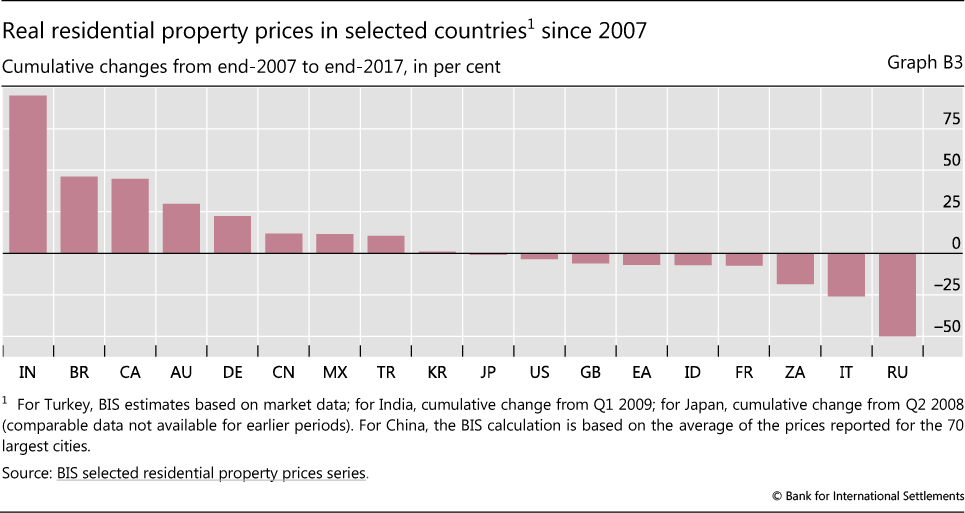
Taking a longer-term perspective, property prices continue to recover slowly worldwide. After a sharp decline in the aftermath of the GFC, average real residential property prices in AEs bottomed out in 2011-12 (Graph B2). Since 2012, they have increased continuously and are now back to their pre-GFC levels. But the situation varies across countries. Real prices are still significantly below their 2007 levels, by 3-7%, in the euro area, the United Kingdom and the United States (Graph B3). Within the euro area, however, there are major disparities. Post-GFC, real property prices have risen by 22% in Germany, fallen by 7% in France, and dropped quite sharply, by 24-33%, in Ireland, Italy and Spain. Regarding the AEs that were less affected by the GFC, real housing prices have almost returned to their pre-GFC levels in Japan, and are significantly above them in Australia and Canada (Graph B3).
Mainly as a result of their marked expansion in the early 2010s, real residential property prices in EMEs are 16% above the levels registered before the crisis (Graph B2). Prices have almost doubled since the crisis in India and are close to 50% higher in Brazil, despite the significant recent decline in that country. They are also above their pre-crisis levels in China, Mexico and Turkey, but below them in Indonesia and South Africa. In Russia, they have fallen by more than 50% compared with 2007 (Graph B3).
The data discussed here are CPI- deflated, unless otherwise stated. Residential property prices refer to the national average or its closest proxy for each country. Regional aggregates and global data are weighted using GDP numbers adjusted for PPP for the reporting countries. A statistical release focusing on the most recent developments is published on the BIS website every February, August and November. GDP-weighted averages using PPP exchange rates.
References:
Scatigna, M and R Szemere (2015): "BIS collection and publication of residential property prices", Irving Fisher Committee Bulletin, no 39, April.
Scatigna, M, R Szemere and K Tsatsaronis (2014): "Residential property price statistics across the globe", BIS Quarterly Review, September, pp 61-76.
Shim, I and K Kuttner (2013): "Can non-interest rate policies stabilise housing markets? Evidence from a panel of 57 economies", BIS Working Papers, no 433, November.
Tissot, B (2014): "Monitoring house prices from a financial stability perspective - the BIS experience", International Statistical Institute Regional Statistics Conference, November.
References
Abad, J, I Aldasoro, C Aymanns, M D'Errico, L Fache-Rousová, P Hoffmann, S Langfield, M Neychev and T Roukny (2016): "Shedding light on dark markets: first insights from the new EU-wide OTC derivatives dataset", ESRB Occasional Papers, no 11, September.
Augustin, P, M Subrahmanyam, D Tang and S Wang (2014): "Credit default swaps: a survey", Foundations and Trends in Finance, vol 9, no 1-2, pp 1-196.
Bank for International Settlements (2018): "Statistical release: OTC derivatives statistics at end-December 2017", May.
Committee on the Global Financial System (2009): "Credit risk transfers statistics", CGFS Papers, no 35, September.
D'Errico, M, S Battiston, T Peltonen and M Scheicher (2018): "How does risk flow in the credit default swap market? ", Journal of Financial Stability, vol 35, April, pp 53-74.
D'Errico, M and T Roukny (2017): "Compressing over-the-counter markets", ESRB Working Papers, no 44, May.
Duffie, D (2010): "Is there a case for banning short speculation in sovereign bond markets?", Bank of France, Financial Stability Review, July.
Ehlers, T and E Eren (2016): "The changing shape of interest rate derivatives markets", BIS Quarterly Review, December, pp 53-65.
Financial Stability Board (2017): OTC derivatives market reforms - Twelfth Progress Report on Implementation, June.
Gyntelberg, J, P Hördahl, K Ters and J Urban (2017): "Arbitrage costs and the persistent non-zero CDS-bond basis: evidence from intraday euro area sovereign debt markets", BIS Working Papers, no 631, April.
Ledrut, E and C Upper (2007): "Changing post-trading arrangements for OTC derivatives", BIS Quarterly Review, December, pp 83-95.
Loon, Y C and Z Zhong (2014): "The impact of central clearing on counterparty risk, liquidity and trading: evidence from the credit default swap market", Journal of Financial Economics, vol 112, no 1, April, pp 91-115.
--- (2016): "Does Dodd-Frank affect OTC transaction costs and liquidity? Evidence from real-time CDS trade reports", Journal of Financial Economics, vol 119, no 3, March, pp 645-72.
Markit (2016): "CDS bond-basis tightens as sentiment improves", March.
Peltonen, T, M Scheicher and G Vuillemey (2014): "The network structure of the CDS market and its determinants", Journal of Financial Stability, vol 13(C), August, pp 118- 33.
Pu, X and J Zhang (2012): "Sovereign CDS spreads, volatility, and liquidity: evidence from 2010 German short sale ban", Financial Review, vol 47, January, pp 171-97.
Schrimpf, A (2015): "Outstanding OTC derivatives positions dwindle as compression gains further traction", BIS Quarterly Review, December, pp 24-5.
Stulz, R (2010): "Credit default swaps and the credit crisis", Journal of Economic Perspectives, vol 24, no 1, pp 73-92.
Vause, N (2010): "Counterparty risk and contract volumes in the credit default swap market", BIS Quarterly Review, December, pp 59-69.
Wooldridge, P (2016): "Comparison of BIS derivatives statistics", Proceedings of the Eighth IFC Conference, Basel, 8-9 September.
1 The authors would like to thank Stefan Avdjiev, Claudio Borio, Benjamin Cohen, Marco D'Errico, Alex Joia, Cathérine Koch, Paul Lewis, Robert McCauley, Patrick McGuire, Thomas O'Keeffe, Denis Pêtre, Hyun Song Shin, Nikola Tarashev, Nicholas Vause, Laurence White and Philip Wooldridge for helpful comments and Kristina Mićić for excellent research assistance. The views expressed in this article are those of the authors and do not necessarily reflect those of the BIS.
2 In a CDS contract, a protection buyer purchases insurance against a credit event of a reference entity (say, the bond of a given sovereign) from a protection seller. For that protection, the buyer pays a regular premium, whereas the seller commits to compensate the buyer if a credit event occurs.
3 This ratio was similar in previous vintages of the Triennial Survey. Since May 2018, information from the semiannual statistics and Triennial Surveys is merged and published as one data set (BIS (2018)).
4 The term "gross" indicates that contracts with positive and negative replacement values with the same counterparty are not netted.
5 Single-name CDS are credit derivatives where the reference entity is a specific debtor such as a non-financial corporation, a bank/dealer, or a sovereign. Multi-name or index CDS refer to contracts where the reference entity is composed of more than one name.
6 See eg Ledrut and Upper (2007) or D'Errico and Roukny (2017). Dealers drove both the sharp pre-crisis rise in notional amounts outstanding and the compression that took place around the crisis. For a detailed account of the role of compression in the aftermath of the crisis and how it affected notional amounts outstanding during 2007-09, see Vause (2010).
7 Trade compression remains an important activity in other derivatives markets. For a broader overview of compression, see Schrimpf (2015). For more details on compression in interest rate swaps, where most of this activity currently takes place, see Ehlers and Eren (2016).
8 Data on the count of outstanding trades from DTCC's Trade Information Warehouse, which is a rough proxy for market activity, show a mild reduction in the index market and a more substantial one in the single-name market (see ISDA Swapsinfo).
9 The CDS-bond basis is the difference between the CDS rate (paid for credit protection) and the credit spread of the underlying bond. The persistent and wide negative basis spread after the GFC and during the euro area crisis presented arbitrage opportunities for institutions with available balance sheet resources, such as hedge funds. A negative basis spread implies that an investor can earn a riskless premium by purchasing credit protection (paying the CDS rate) and interest rate risk protection (paying the swap rate) while holding the underlying bond (receiving the bond rate).
10 As discussed in Box A, the clearing rates obtained without adjusting for potential double-counting of inter-dealer positions novated to CCPs overestimate the share of cleared positions. The adjusted minimum clearing rates for single-name and multi-name contracts are 29% and 48%, respectively.
11 The concentration of the market in terms of currencies applies also to the non- cleared segment. The lion's share is taken by trades in US dollars and euros (Abad et al (2016)).
12 We do not show clearing amounts for the yen, as its overall market share is around 0.1%.
13 The short-sale ban, which included a ban on CDS protection buying without possession of the underlying reference asset (so-called "naked" CDS), may itself have contributed to wider CDS spreads. See eg Duffie (2010) or Pu and Zhang (2012).
14 Prior to 2011, the BIS semiannual OTC derivatives statistics do not allow a precise breakdown into the subsectors of non-sovereign exposures.
15 CCPs do not necessarily increase the scope for netting. They only allow multilateral netting for a given product, whereas bilateral CDS contracts, which are not cleared through a CCP, allow cross-product netting (eg netting between different CDS products or different types of derivatives). In less standardised markets (eg the interest rate swap market), the scope for bilateral cross- product netting may outweigh that for multilateral netting of a given product through CCPs.
16 Analysing market values instead of notional amounts outstanding can lead to a downward bias. If contracts with high market values (such as longer-term contracts) are netted to a greater extent, then the ratio of net to gross market values would drop - independently of the actual degree of netting. Whereas this is likely to be the case for interest rate swaps, we do not see any reason why such a bias would emerge in a significant way for the CDS market.
17 The netting ratios for non-CCP counterparties, however, are likely to understate the true degree of netting, as they do not take into account cross-product netting across different types of derivatives (for instance, CDS and equity-based derivatives). The ratio of net to gross market values presented here reflects only multilateral netting for a given type of product.
18 Table 1 presents net purchases from the viewpoint of reporting dealers. Positive net purchases of hedge funds are therefore displayed as negative net purchases of dealers vis-à-vis hedge funds.